
Crude Rallied After Hormuz Deal Terms Hit a Wall
Crude oil finished higher Friday after the market reconsidered this week’s Hormuz diplomacy and decided nothing announced so far will move a barrel. Brent and WTI sold off hard earlier in the week on hopes that Iran and Oman were close to a shipping deal. Then the proposed terms came out and the buying started. Iran wants control over the route, fees on every cargo and the authority to block U.S. and Israeli-linked vessels.
Brent jumped back above the 50-day moving average on the rally and the near-term tone flipped. October Brent crude oil settled at $83.55, up $1.06 or 1.3%. September WTI crude oil finished at $78.18, up 89 cents or 1.15%. The weekly damage was still heavy. Brent lost more than 8% and WTI fell more than 7%. The market priced a deal that does not exist yet and spent the back half of the week paying for it.

Daily October Brent Crude Oil Futures Technical Analysis
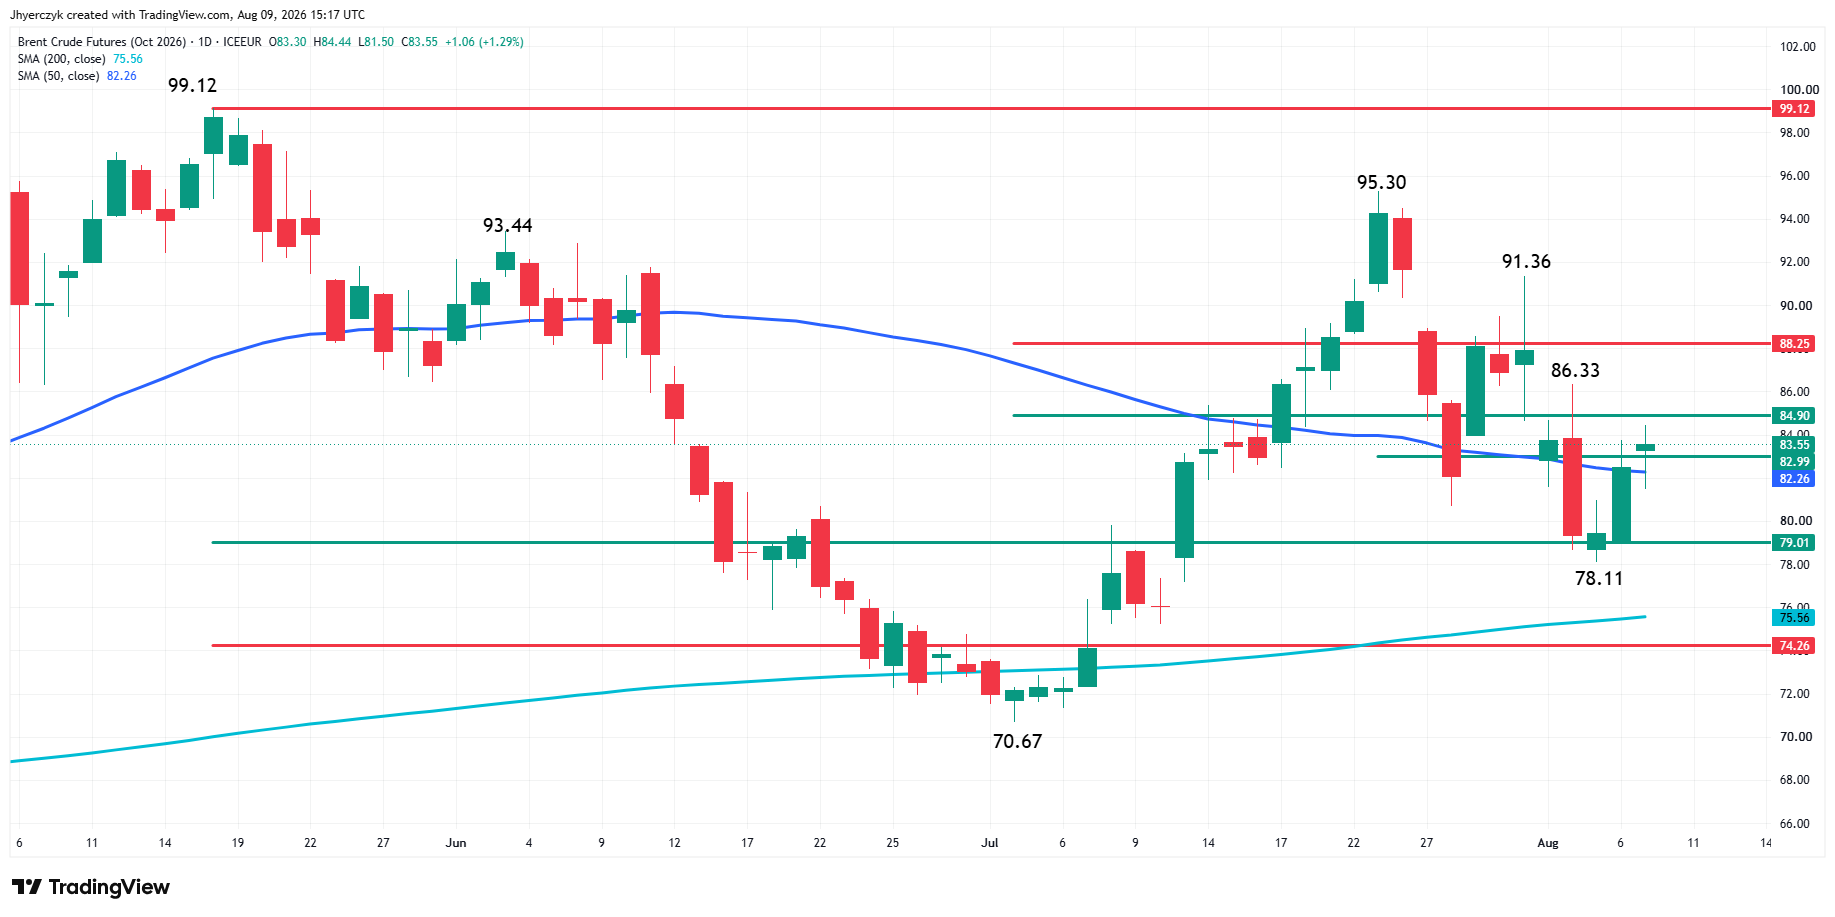
October Brent crude oil futures closed higher for a third straight session on Friday, reaffirming Wednesday’s closing price reversal bottom at $78.11.
The market found support last week at $78.11, just inside the long-term retracement zone at $79.01 to $74.26 and just in front of the 200-day moving average at $75.56.
The subsequent rally jumped the 50-day moving average at $82.26, putting the market in a strong position to extend the rally. Nonetheless, the market still faces several headwinds before it’s even a threat to challenge the major tops at $95.30 and $99.12. These headwinds include an intermediate retracement zone at $84.90 to $88.25 and swing tops at $86.33 and $91.36.
Monday’s direction is likely to be determined by trader reaction to the 50-day moving average.
Brent Oil Price Forecast
Every new Brent Oil analysis as it publishes, today's technical signal and key levels, live price — on one page.
See all Brent Oil forecastsDaily September WTI Crude Oil Futures Technical Analysis
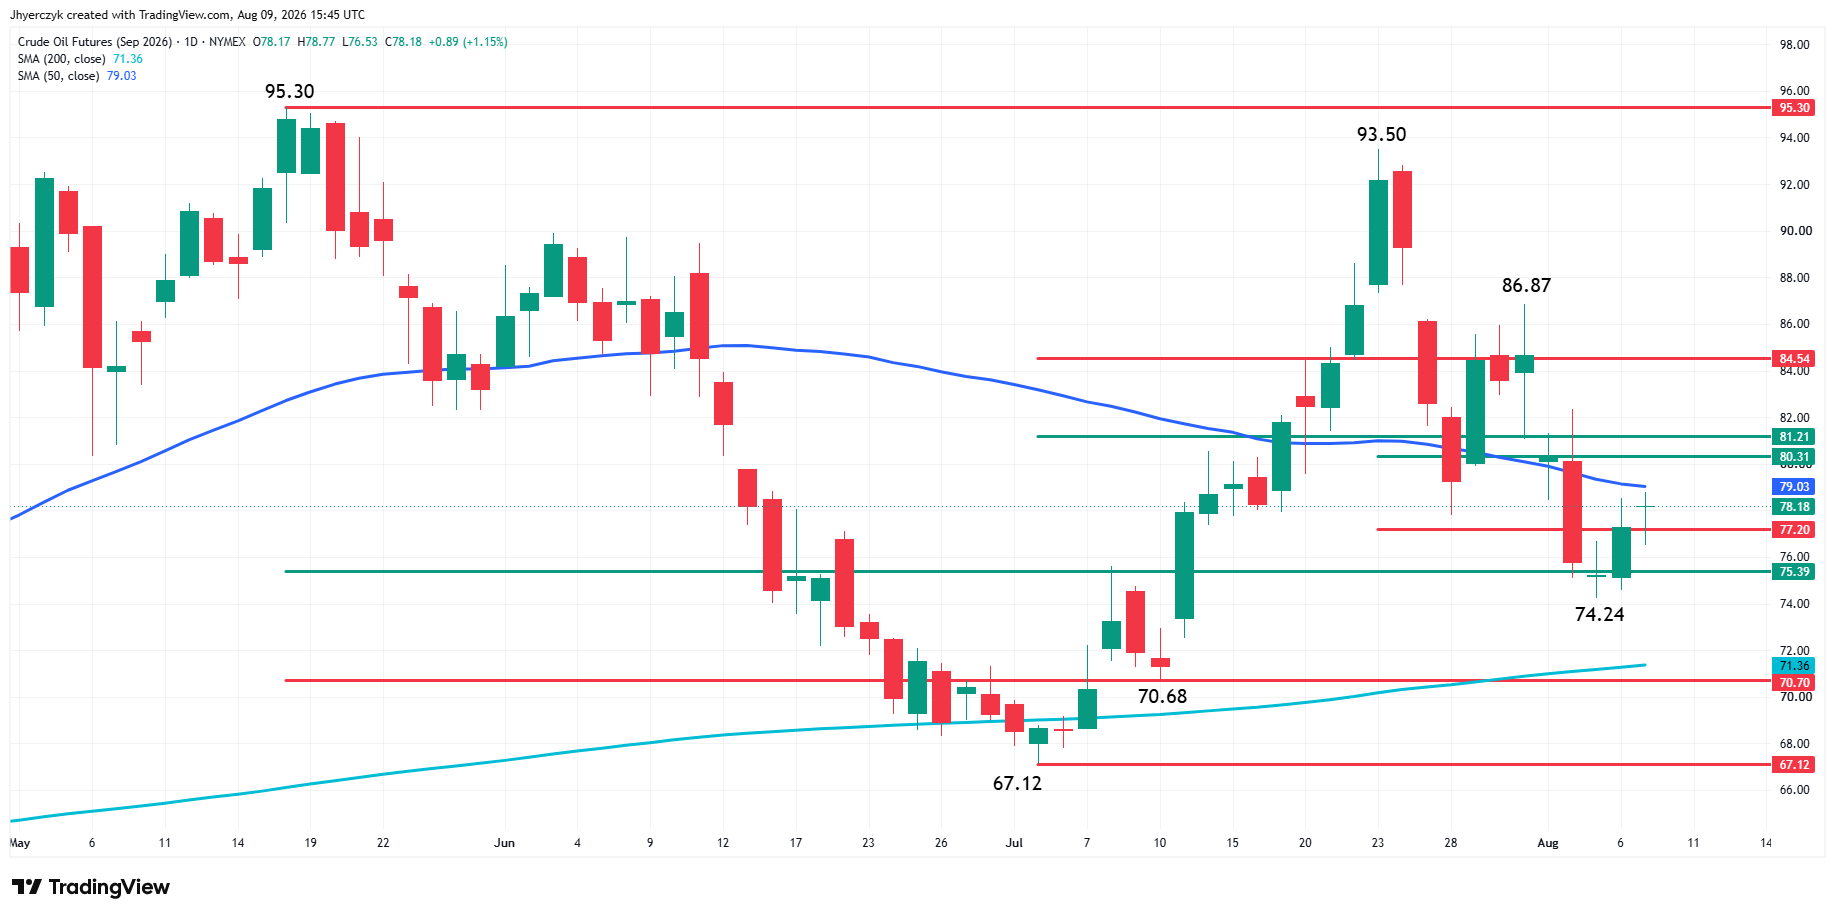
September WTI crude oil futures closed higher on Friday, putting the U.S. benchmark within striking distance of the 50-day moving average at $79.03. Trader reaction to this trend indicator will set the tone on Monday.
A sustained move over the 50-day MA will signal the presence of buyers. Initially, WTI could face headwinds at $80.31 and $81.21. Overcoming the latter, however, could launch an acceleration into $84.54. This is the last resistance before the main tops at $86.87 and $93.50, and the contract high at $95.30.
A failure to overtake the 50-day MA will indicate the presence of sellers. This could lead to an early retest of the minor Fibonacci level at $77.20 and the long-term 50% level at $75.39. Taking out the swing bottom at $74.24 will signal a resumption of the downtrend with the 200-day moving average at $71.36 the next target, followed by the long-term Fibonacci level at $70.70.
Iran Wants Fees, Route Control and the Right to Block Ships
Iran and Oman agreed on a route. That is the part nobody was worried about. The fees and the vessel restrictions are where the deal falls apart.
Iran is pushing for 5% to 7% of cargo value on every transit. Oman floated 3%. Washington wants zero. Iran also wants to decide which ships pass through and is looking at barring anything tied to the U.S. or Israel. That is not a commercial negotiation anymore. That is a fight over who controls the most important chokepoint in global energy and the market figured that out Friday.
The selloff earlier in the week was traders front-running a deal. Friday’s rally was traders realizing the deal is not close. The gap between Iran’s terms and what Washington, insurers and shipowners will accept is wide enough that every barrel stuck behind the strait stays stuck until someone moves first.
Gulf Barrels Are Still Missing and Inventories Are Paying for It
Refiners have been covering the Hormuz gap by pulling from storage and rerouting cargoes for weeks. That works until it does not. Drawdowns are showing up in the weekly data and every report that prints a decline without strait traffic normalizing makes the physical market tighter than the front-month contract looks.
Iran’s proposed terms do not fix that. Fees, vessel restrictions and insurance questions leave the same barrels stuck behind the same chokepoint. It was trading the realization that the strait is not reopening on anyone’s original timeline.
Citi and Goldman Both See the Premium Lasting Longer
Citi raised its third-quarter Brent forecast to $80 from $75 because the negotiations are running late and the disruption is not ending when the market expected. The bank kept Q4 at $70 and 2027 at $65. The near-term number went up. The longer-term numbers did not.
Goldman Sachs has Brent in an $80 to $90 range until there is either a confirmed U.S.-Iran agreement or a serious escalation. That range fits where the market is sitting right now. No full shutdown priced. No full reopening priced. Just a premium that stays in place because the strait is not functioning and nobody has offered terms that change that.
Brent Holds Above the 50-Day and Sellers Have No Deal to Point To
Iran’s fee demands, vessel restrictions and the insurance mess left behind by this week’s negotiations gave buyers everything they needed Friday. Citi and Goldman both raised near-term forecasts because the disruption is lasting longer than anyone priced in, and commercial drawdowns are getting harder to ignore. The only thing that takes the premium out is an agreement that puts tankers on a repeatable schedule through the strait. Nobody is offering that yet.
Brent is back above the 50-day moving average and WTI is pressing toward its own at $79.03. Clearing that level on both benchmarks confirms the same trade. The selloff earlier this week showed how fast crude reprices a deal headline, and that is the risk sitting over every long position going into Monday.
If you’d like to know more about how to trade crude oil, please visit our educational area.