
Crude Lost 11% Selling a Deal and Spent Friday Buying It Back
September WTI crude oil finished the week at $77.08, down $9.72 or 11.20%. October Brent settled at $82.38, down $8.66 or 9.51%. The losses came from one trade. The market sold the prospect of a Hormuz reopening before the commercial terms were anywhere close to settled, and by Friday the buying started when traders realized the agreement still has several ways to fail.
At 04:00 GMT Monday, September WTI was trading $78.76, up $1.68 or 2.18%. October Brent was at $84.41, up $2.03 or 2.46%. The early recovery reflects a market repricing the gap between what was announced and what it takes to actually move barrels through the strait on a repeatable schedule.
The week ahead belongs to Hormuz. Crude will not be trading forecasts, speeches or the outline of some future arrangement. It will be trading whether ships can move safely and in enough volume for refiners to plan around Gulf supply again.

Iran Wants to Control the Strait, Not Just Reopen It
Crude sold off last Monday through Wednesday on the idea that Iran and Oman had a workable shipping framework coming. By Thursday the terms leaked and the buying started. Iran is demanding fees on every cargo, the right to block U.S. and Israeli-linked vessels and full authority over which ships enter the waterway. Washington rejected the fee structure before the ink was dry.
The market spent three days front-running a deal and two days unwinding it. The proposal sitting in Muscat does not solve the insurance problem, does not tell shipowners which hulls can transit and does not give refiners the confidence to book Gulf crude on a forward schedule. None of that changed over the weekend.
Houthi Threats and Stalled Strait Traffic Are Draining Inventories
Gulf supply has not come back. Iran’s demands now go beyond shipping terms. Tehran wants compensation, sanctions relief and security assurances before it fully reopens the waterway, and none of those are close to settled. That timeline got longer last week, not shorter.
The Red Sea is compounding the problem. Houthi claims of attacks on Saudi oil infrastructure and shipping have added pressure on the alternative route that Gulf producers were counting on. Tanker operators do not need every attack confirmed. They need to see enough risk to decide a cargo is not worth sending.
Brent Oil Price Forecast
Every new Brent Oil analysis as it publishes, today's technical signal and key levels, live price — on one page.
See all Brent Oil forecastsCommercial inventories are covering the gap. Refiners are pulling from storage and sourcing barrels from outside the Gulf. Every week that strait traffic stays restricted reduces that cushion further and the weekly data is starting to show it.
China’s Import Cuts Are the Only Reason Prices Are Not Running
China is the reason crude is not back at $90. Chinese imports averaged about 7.8 million barrels per day in June and July, well below pre-conflict levels. Beijing has been pulling from reserves instead of buying at these prices. Additionally, Asian refiners followed by cutting purchases once Middle East cargoes became harder to secure.
That is what stands between a restricted strait and a supply crisis. Remove the demand adjustment and every missing Gulf barrel hits the physical market immediately. It also explains last week’s selloff. Traders who thought the strait was reopening were not just pricing more supply. They were pricing more supply landing in a market where buyers had already walked away from the offer.
The bullish case does not need demand to grow. It needs the strait to stay closed while commercial inventories keep shrinking. The bearish case needs a deal that actually works, not a proposal sitting on a table in Muscat.
Weekly September WTI Crude Oil Futures Technical Analysis
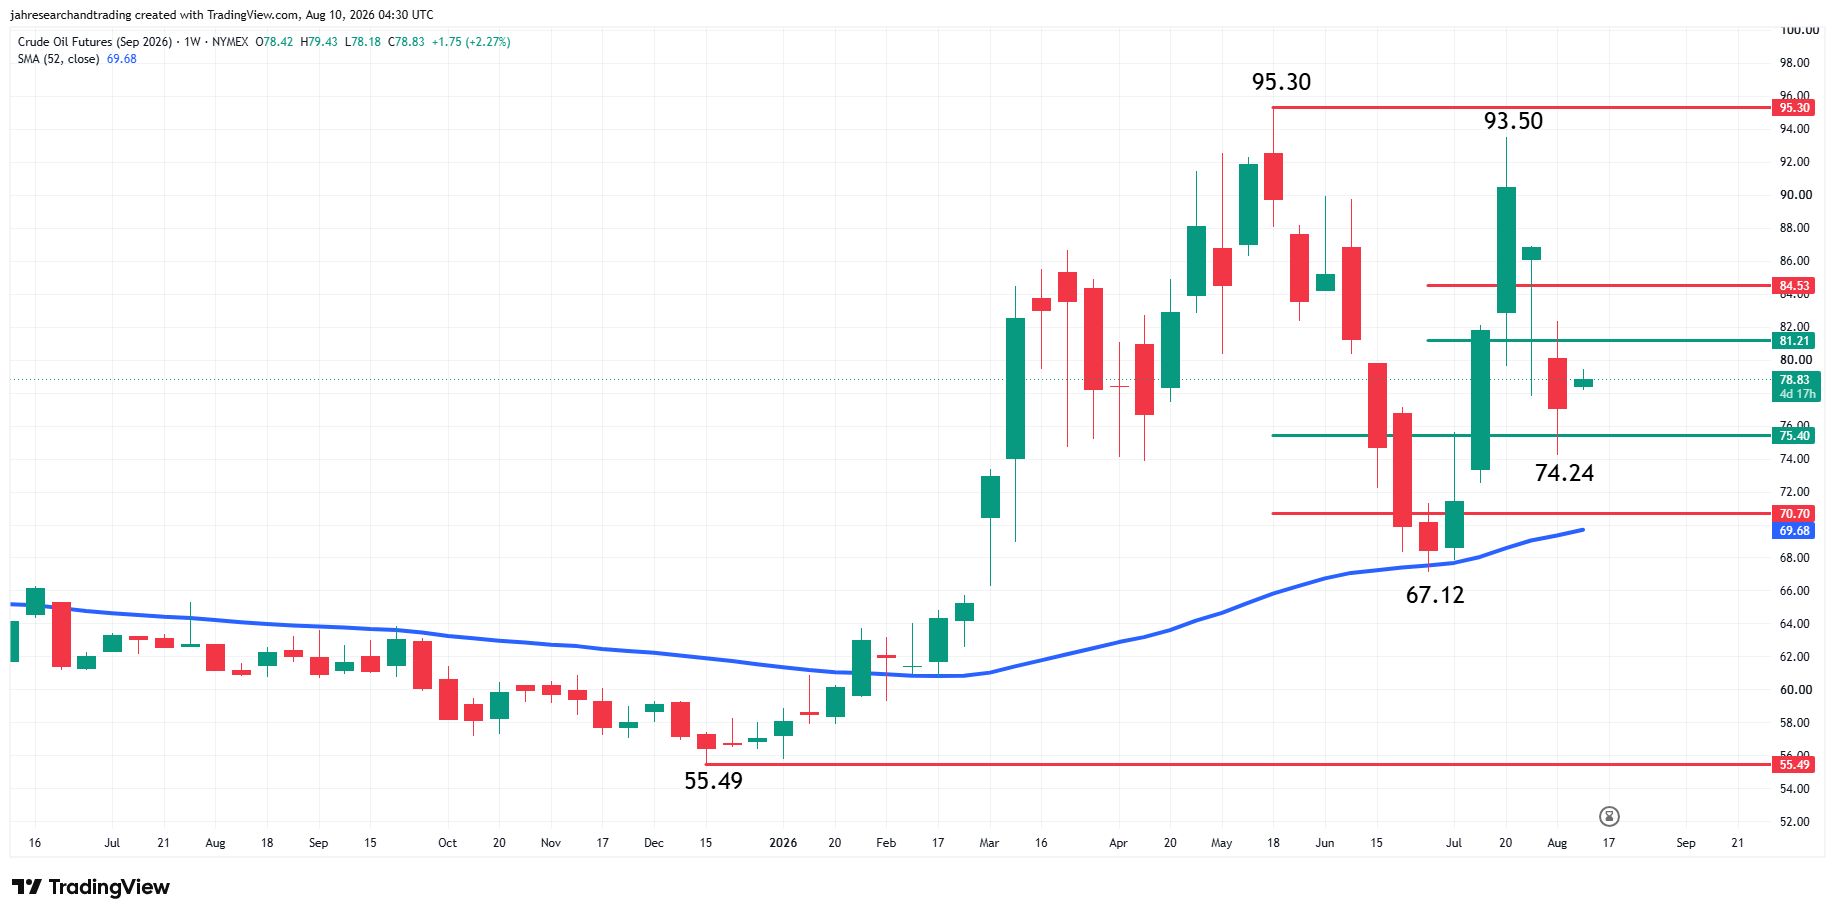
September WTI crude oil futures are edging higher early Monday as traders attempt to build on last week’s technical bounce.
The key support area is the long-term retracement zone at $75.40 to $70.70. Last week, this zone stopped the selling at $74.24. The market is also supported by the 52-week moving average at $69.68, which is also the trend indicator. As long as the 52-week MA holds, traders are likely to remain in “buy the dip” mode. In early July, the 52-week MA was successfully tested at $67.12, likely fueling the start of a three-week rally to $93.50.
On the upside, the nearest resistance is the retracement zone at $81.21 to $84.53. New buyers combined with aggressive short-covering will be needed to overcome this area. But if successful, the two main tops at $93.50 and $95.30 will come into play.
Weekly October Brent Crude Oil Futures Technical Analysis
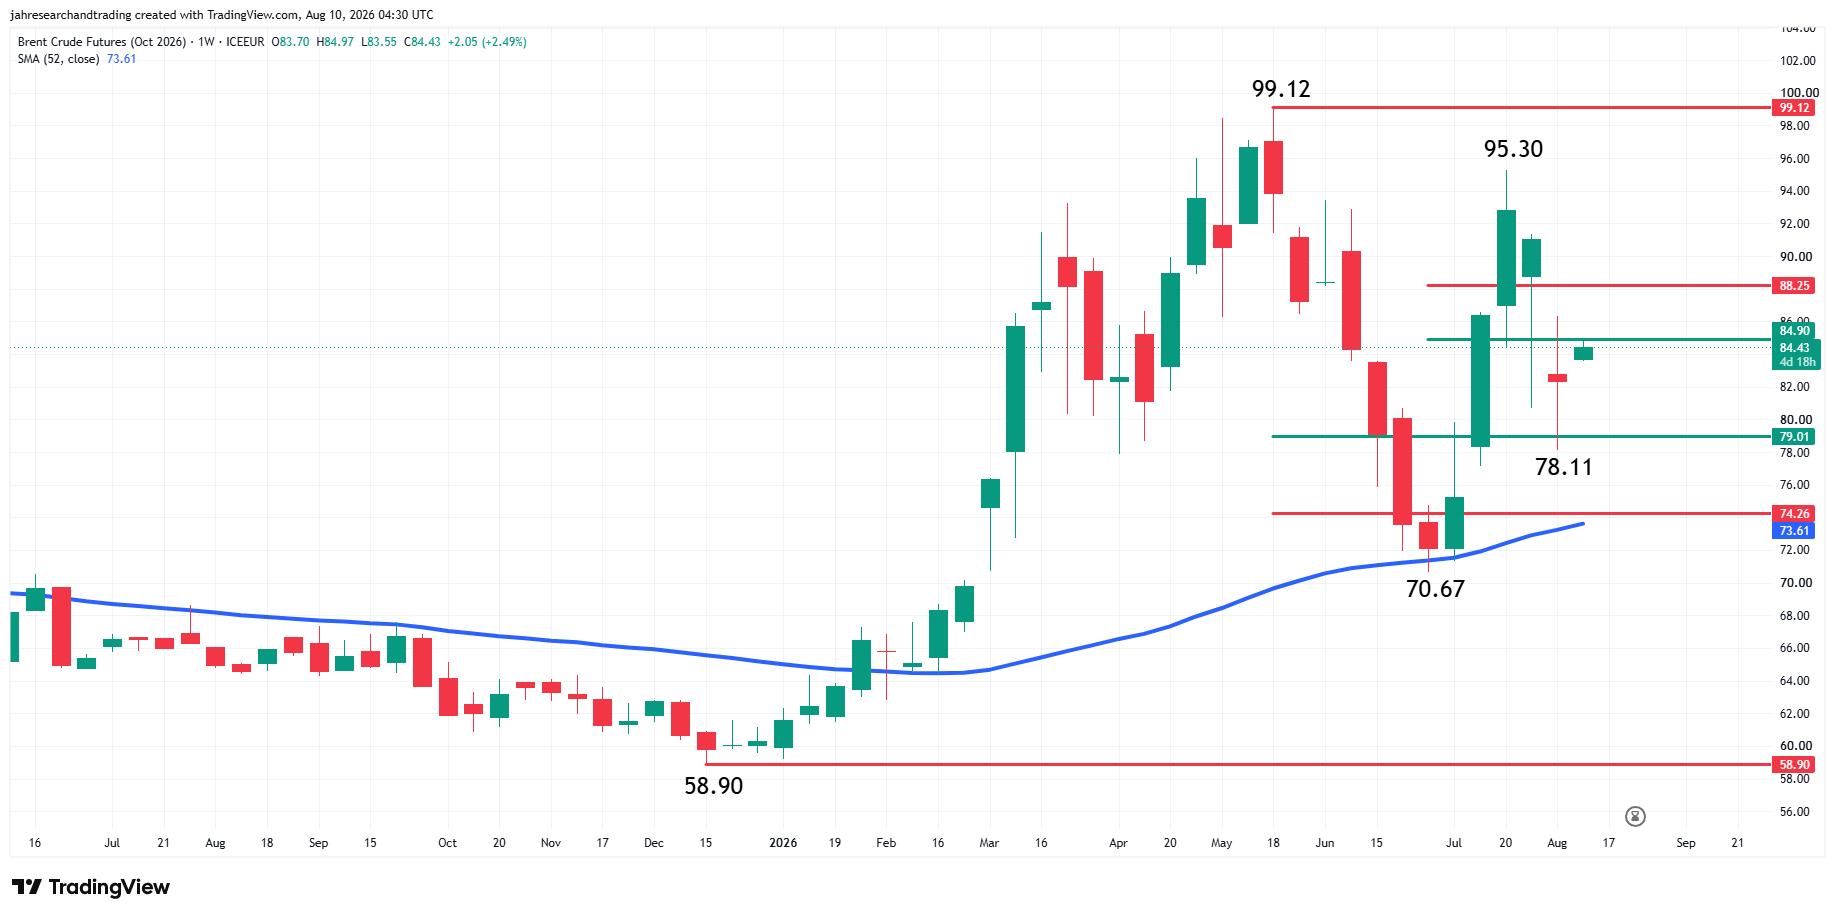
October Brent crude oil futures are higher to start the new week with early buyers attempting to overcome 50% resistance at $84.90. A successful attempt will put the Fibonacci level at $88.25 on the radar. This is a potential trigger point for an acceleration to the upside with the major tops at $95.30 and $99.12 the next likely target prices.
A failure to overcome $84.90 with conviction will indicate the return of sellers. If this starts to generate downside momentum then look for the selling to possibly extend into the long-term retracement zone at $79.01 to $74.26. This area is being propped up by the 52-week moving average at $73.61.
In my opinion, traders are likely to remain in “buy the dip” mode unless there are sustained closes below the 52-week MA.
Tanker Traffic Decides the Direction, Not Another Round of Talks
Iran’s fee demands and vessel restrictions killed the reopening trade last week and nothing announced over the weekend changed that. The risk is a headline that puts a credible deal back on the table. Last week proved how fast crude reprices when the market believes barrels are coming back. Until that happens, restricted traffic, falling commercial stockpiles and a Red Sea route that is getting harder to use keep the bid under both benchmarks. U.S. inventory data and inflation numbers land this week but crude is not trading the Fed right now. It is trading whether ships move through the strait or sit outside it.
Both benchmarks bounced off long-term retracement support last week. They are now pressing into overhead retracement zone resistance. WTI needs to clear its zone to open the path back toward the main tops. Brent is already testing its 50% level at $84.90. A push through it puts the next Fibonacci target at $88.25 in play. The buy-the-dip structure holds as long as the 52-week moving averages are intact underneath, and both are well below current prices. The charts are set up for a continuation higher but the fundamentals have to cooperate.
If you’d like to know more about how to trade crude oil, please visit our educational area.