
Oil prices dropped on Thursday following new diplomatic efforts involving Iran, Oman and Qatar. Brent crude dropped to $88.50 per barrel and WTI oil dropped to $81.60. The talks about the Strait of Hormuz fuelled optimism that additional oil flows could pass through major shipping channel. This reduced some of the geopolitical risk premium in prices. The long pause in U.S. strikes on Iran also boosted hopes of easing supply disruptions.
But the risk of another supply shock remains high. The oil flow in the Strait of Hormuz is still about 25% of pre-war levels. Iran and the United States also remain far apart on the conditions for reopening the waterway. Meanwhile, disruptions to Middle East refineries and attacks by the Ukrainians on Russian refineries have cut global diesel output. Inventories of U.S. distillates dropped 2.2 million barrels to record seasonal low of 103.4 million barrels last week. These shortages could prevent further cuts in crude oil and keep prices volatile until the talks produce clear agreement.

WTI Crude Oil Price Forecast: $77.50 and $87 Define the Next Move
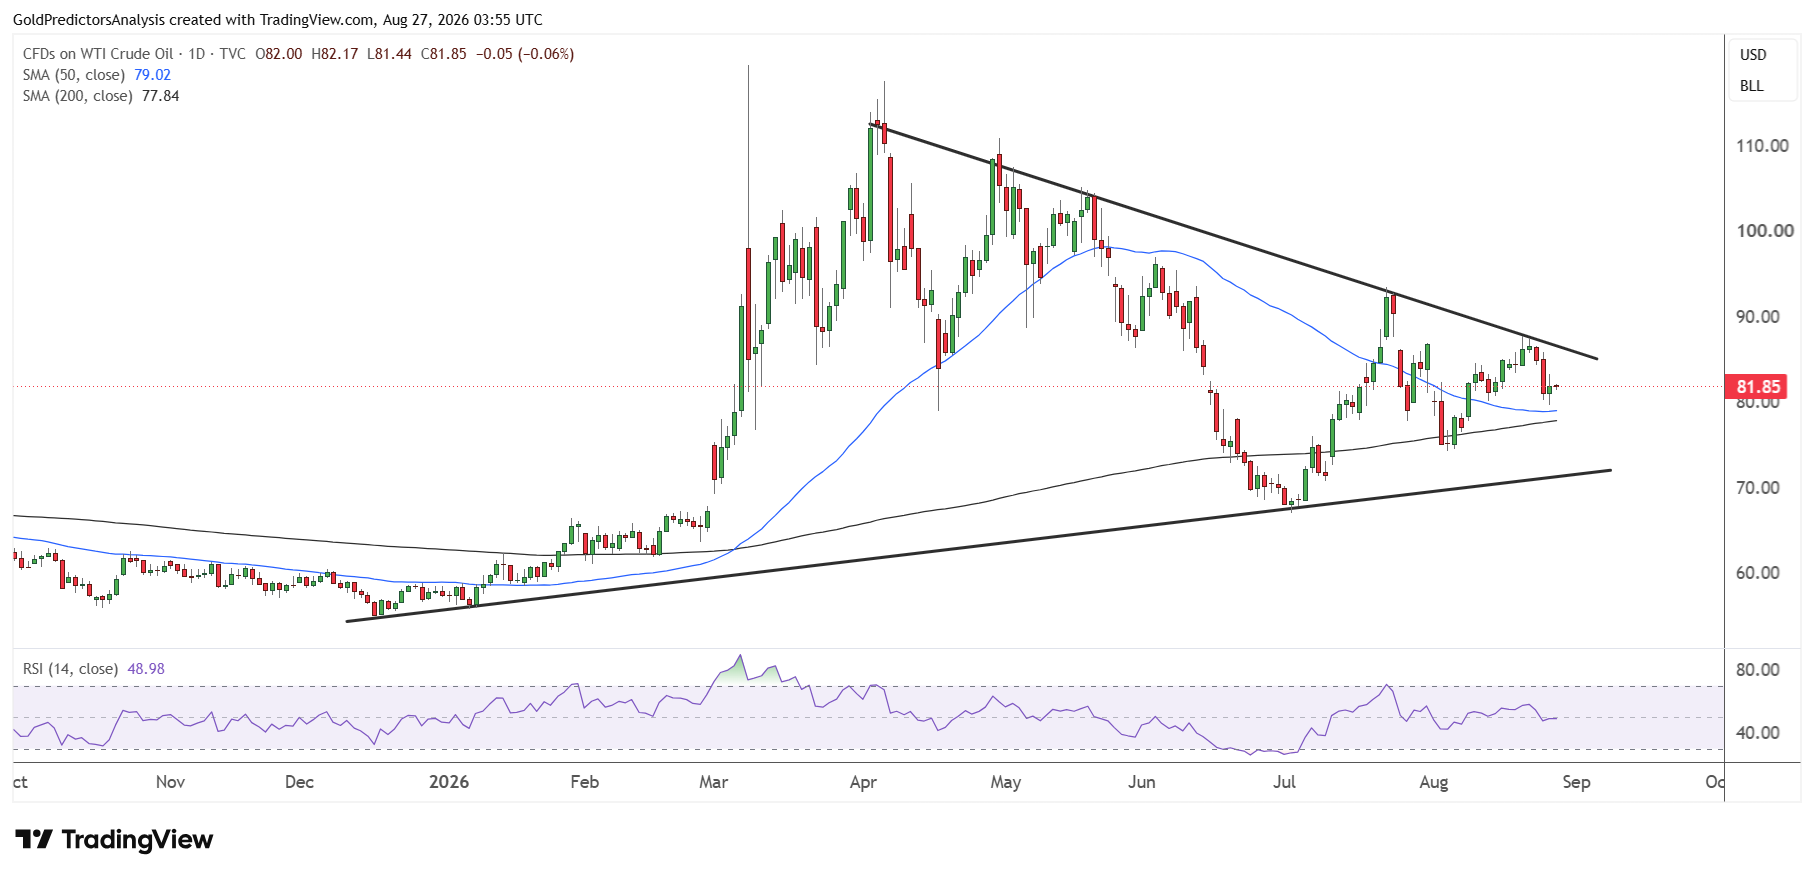
The daily chart for WTI crude shows that the price has dropped from the resistance near the $87 region. This resistance is defined by the descending trend line of the triangle pattern. But the price still remains above the 50-day and 200-day SMAs.
A break below $77.50 will likely push prices further down toward the support of triangle at the $72 region. But a break above $87 will likely push oil prices toward the $93 region. Oil prices remain in a consolidation zone and the consolidation is narrowing within the triangle pattern as the market prepares for the next move.
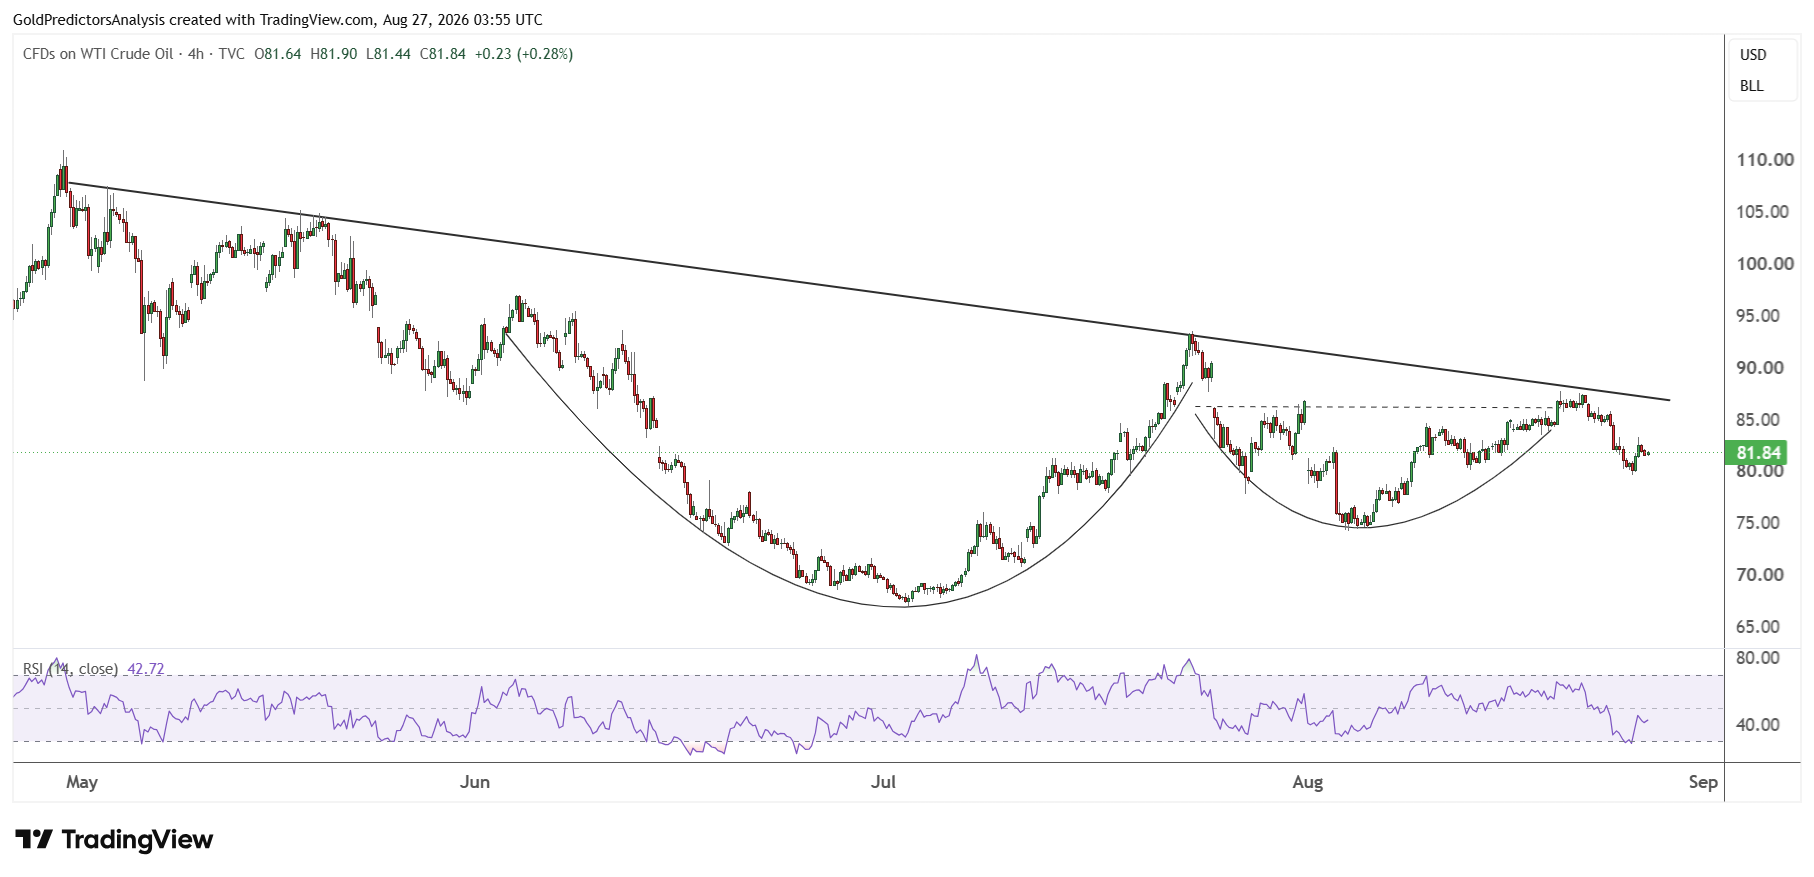
The 4-hour chart for WTI crude also shows that prices failed to break above the descending trend line that stretches from the April 2026 highs. But the overall bullish pattern still remains constructive as long as the price stays above the $74 area. The RSI has also entered the oversold region on the 4-hour chart, which points to a rebound toward the $86 area. But uncertainty in the oil market remains high.
Brent Oil Price Forecast
Every new Brent Oil analysis as it publishes, today's technical signal and key levels, live price — on one page.
See all Brent Oil forecastsBrent Crude Oil Price Forecast: Key Levels Keep Prices in a Wide Range
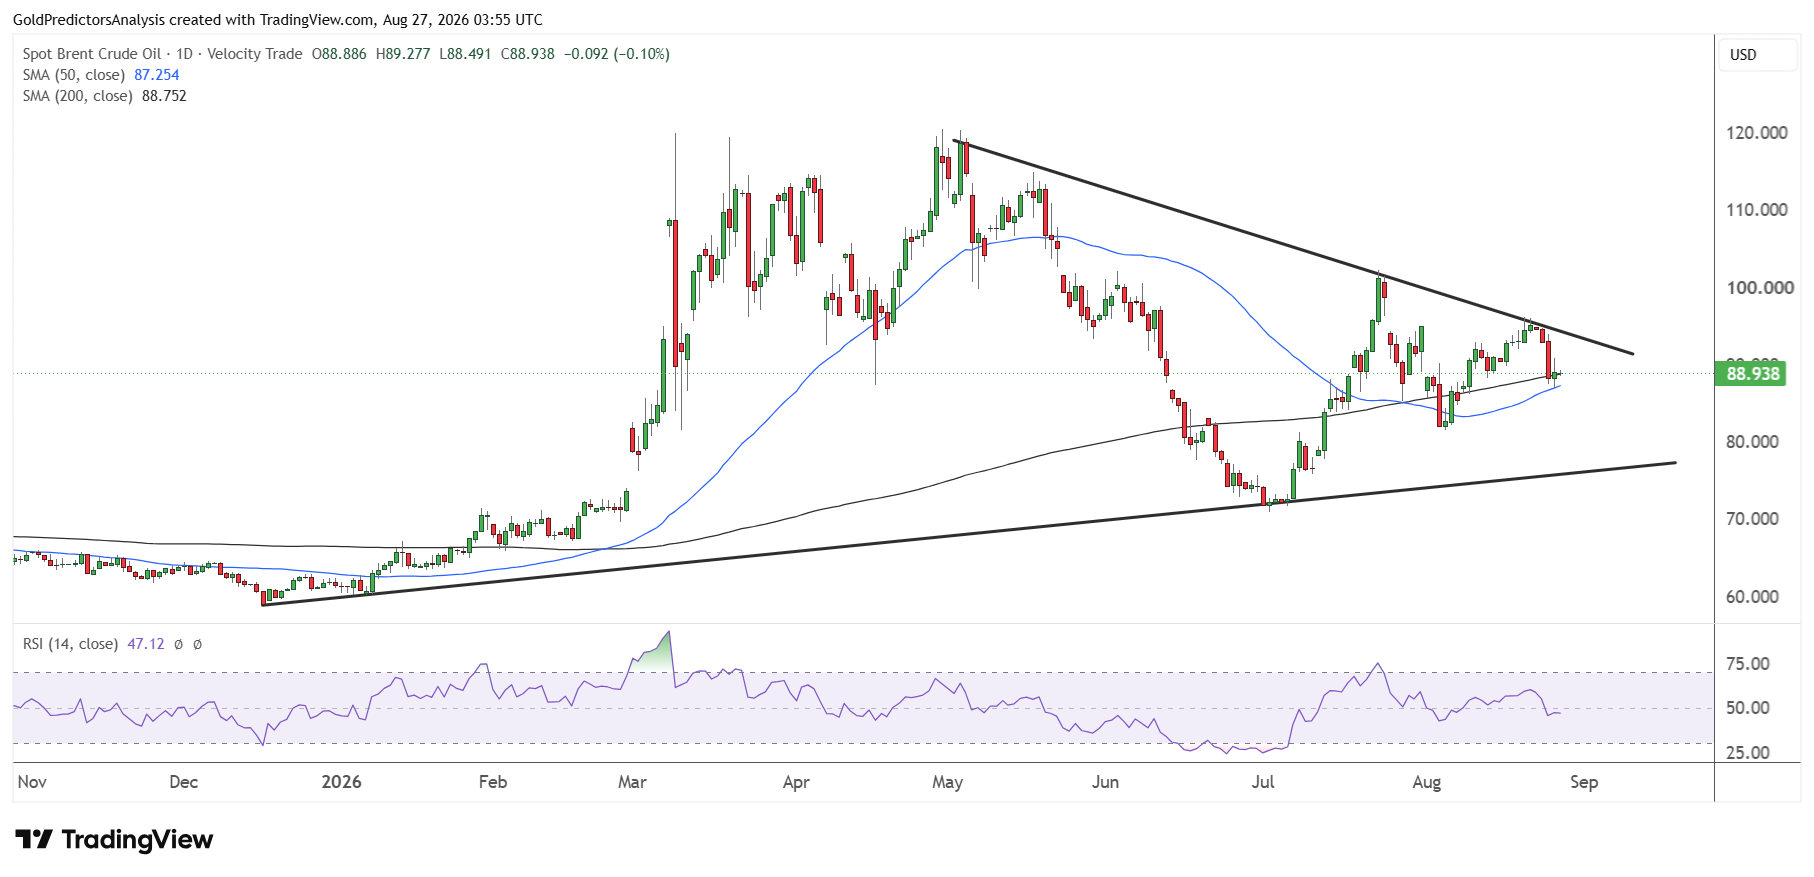
The daily chart for Brent crude oil shows that the price is consolidating within the triangle pattern. A break above $95 will likely break the triangle and open the door for a strong rally toward the $101 area. But a break below $86 will push prices toward $76. This level marks the triangle’s support. The short term direction of the oil price remains uncertain.
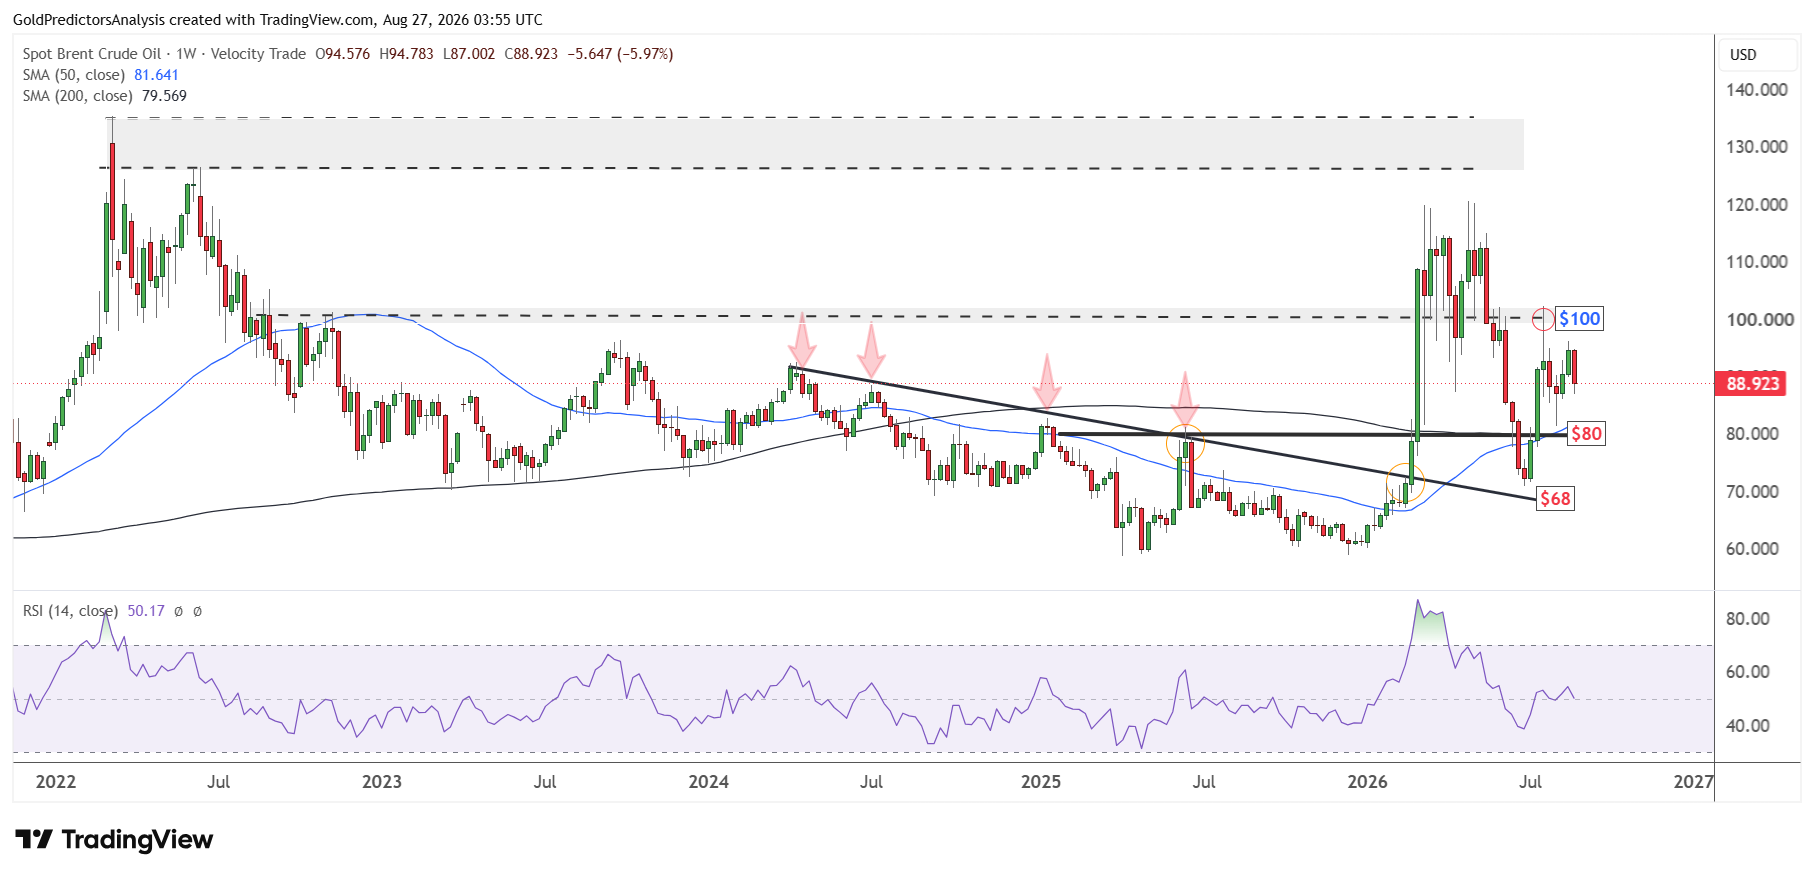
This uncertainty is also evident on the weekly chart, which shows a strong surge in the oil market from $67 to $120 after the Iran war and then a drop back toward the $70 area. Now, the price needs to break below the key region of $80 or above $100 to define the next move in the oil market.
Key WTI and Brent Levels to Watch
The diplomatic negotiations ease concerns about an immediate oil supply disruption and send mixed signals to oil prices. But the low flows through the Strait of Hormuz and tight diesel inventories keep the risk of supply disruptions high. This means that the Brent and WTI oil prices may remain volatile and fluctuate in wide range until the negotiations produce a clear agreement.
WTI needs to break above $87 to target $93, while a drop below $77.50 could expose the $72 region. Brent needs to break above $95 to open the way toward $101, while a drop below $86 could push the price toward $76. The short term direction for oil remains uncertain until the market breaks these key levels.
If you’d like to know more about how to trade crude oil, please visit our educational area.