



PPI Decides Whether the Three-Day Selloff Extends
Stock futures are trying to stabilize Thursday after three straight losing sessions. The August Producer Price Index is due at 12:30 GMT with headline estimates at 0.3% month over month and 5.3% year over year. Traders are pricing about a 60% chance of a rate hike at the September 15-16 Fed meeting and the Consumer Price Index Friday still has the final word.
Apple is providing some early support after its biggest product launch of the year. TSMC posted a record August revenue number that confirmed AI spending is still running. The technology names are holding up the tape ahead of the data. The bond market has the final say before the bell.
The Dow lost more than 400 points Wednesday, or 0.8%. The S&P 500 fell 0.5%. The Nasdaq Composite dropped 0.6%. Early Thursday, Dow and S&P 500 futures are slightly higher. Nasdaq-100 futures are nearly flat.
Daily September E-mini S&P 500 Index Technical Analysis
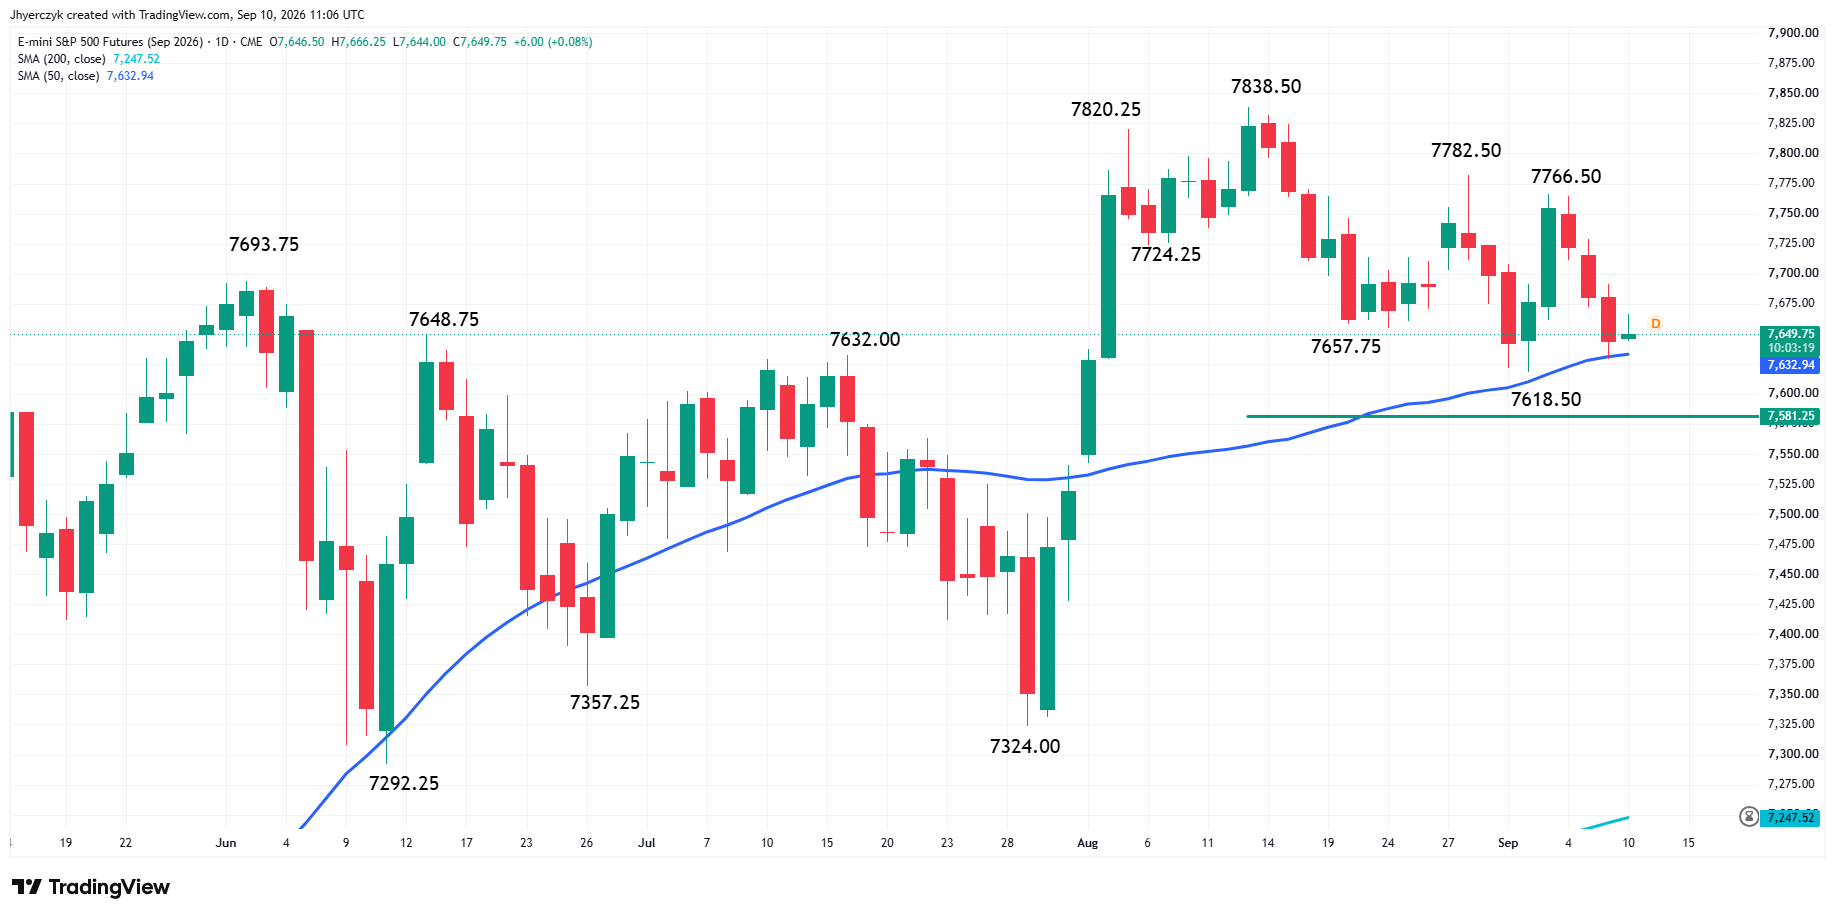
September E-mini S&P 500 Index futures are inching higher on Thursday after a successful test of the 50-day moving average at 7,632.99 the previous session.
The main trend is down according to the daily swing chart. A trade through 7,618.50 will reaffirm the downtrend. The main trend will change to up on a move through the last swing top at 7,766.50.
Since reaching an all-time high at 7,838.50 on August 13, the September E-mini S&P 500 futures contract has produced a pair of lower tops at 7,782.50 and 7,766.50. Coupled with the lower bottoms at 7,657.75 and 7,618.50, the swing chart pattern is driving the current downside bias. However, sellers are going to have to cross decisively to the weak side of the 50-day MA in order to generate the downside pressure needed to break through the 7,618.50 main bottom and extend the move.
On the upside, if the 50-day MA holds, we could see a counter-trend rebound into a pivot at 7,696.625.
S&P 500 Price Forecast
Every new S&P 500 analysis as it publishes, today's technical signal and key levels, live price — on one page.
See all S&P 500 forecastsHigher Yields and $101 Brent Are Both Working Against Stocks
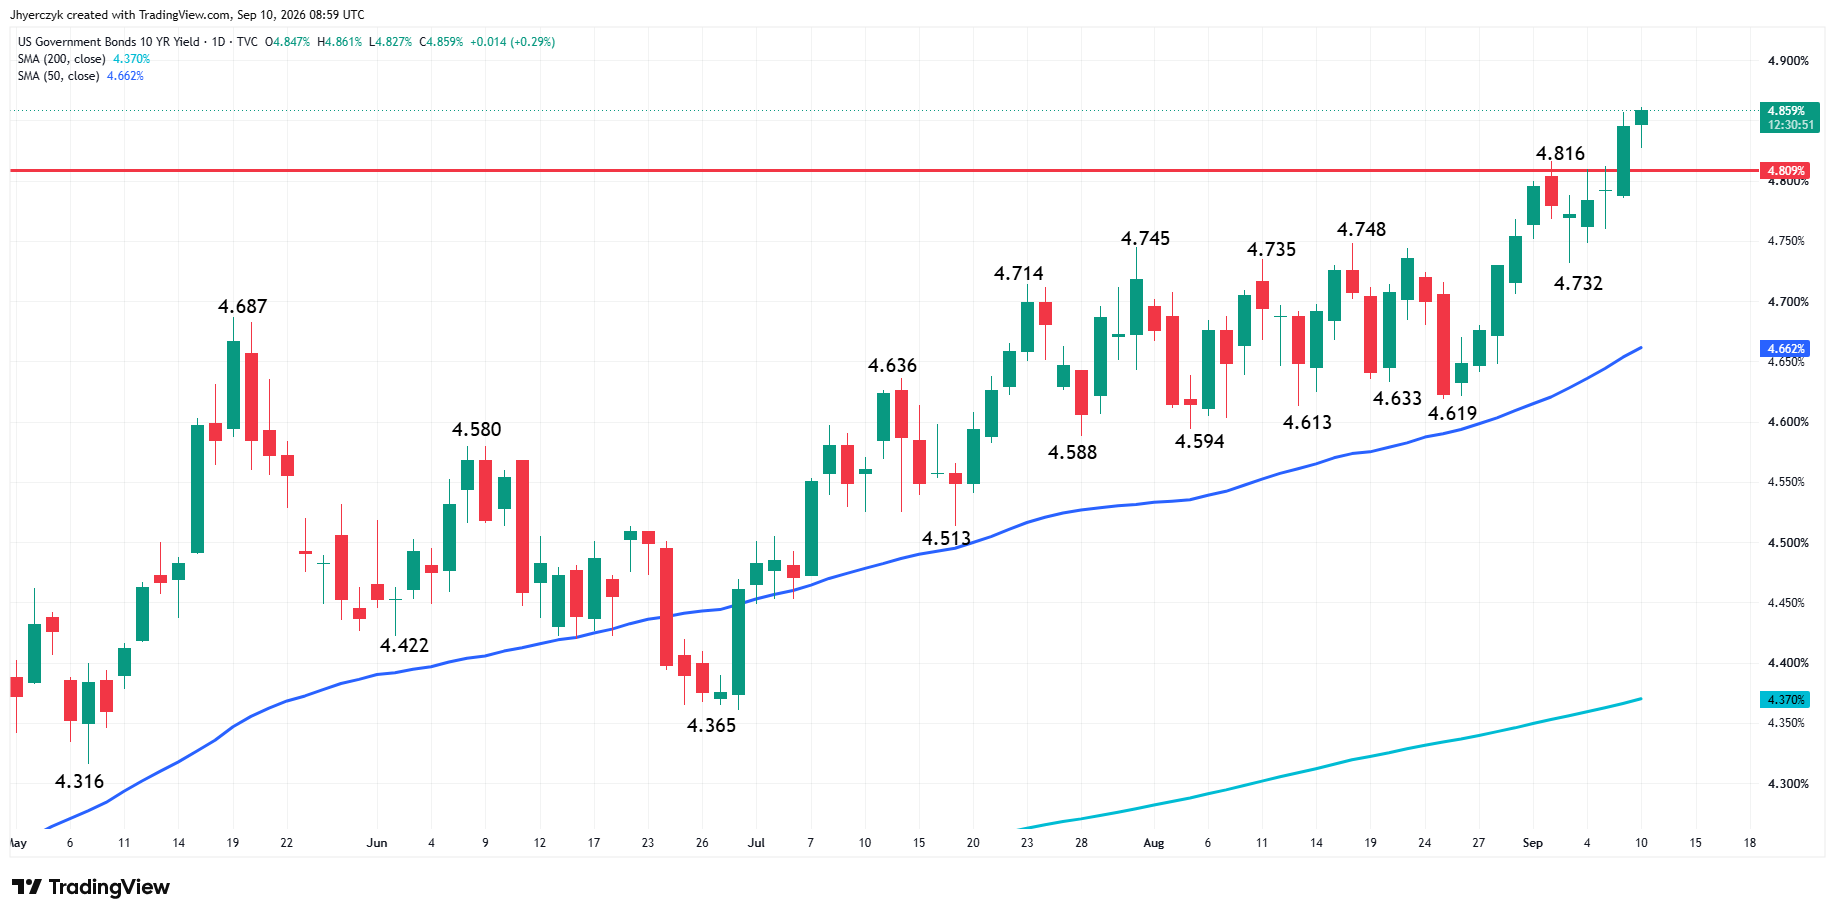
The 10-year Treasury yield was near 4.86% early Thursday after reaching its highest since November 2023. The 2-year was near 4.44%. Stocks have been fighting higher yields for three sessions. The PPI decides whether that pressure continues or backs off before Friday’s Consumer Price Index.
Brent crude settled Wednesday at $101.21 a barrel after gaining 3.4%. WTI finished at $96.05, up 3.3%. Both contracts posted their highest settlements since May. Oil was little changed early Thursday as fighting between the United States and Iran continued to threaten Middle East supply routes. Crude at these levels adds to the inflation risk going into the Producer Price Index and the Consumer Price Index.
Apple Caught a Bid on the Foldable iPhone
Apple shares are up about 1% in premarket after the company unveiled the $1,999 foldable iPhone Duo at Wednesday’s product event. The company also introduced the iPhone 18 Pro, AirPods 5, and Apple Watch Series 12.
The stock reaction matters after three days of selling. Apple is one of the largest weights in the major indexes. Buyers are responding to an actual product catalyst on Thursday morning, not a generic dip buy.
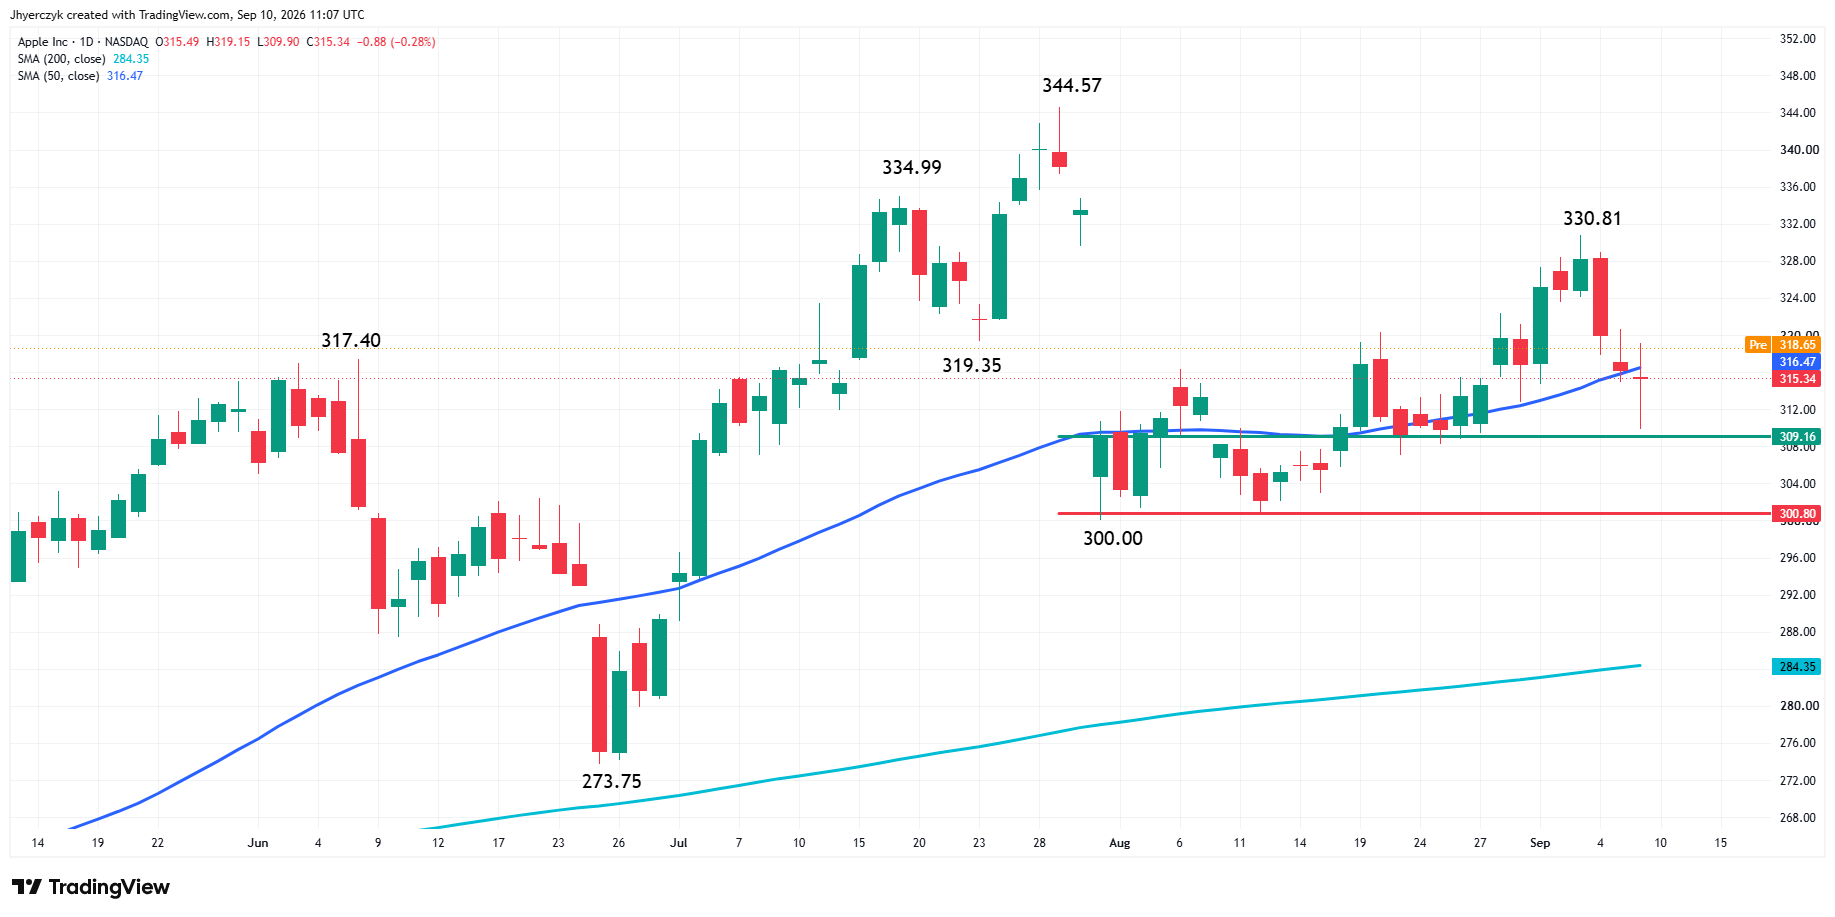
Apple shares are called higher on Thursday based on the premarket trade. Currently, the main trend is up according to the daily swing chart. A trade through $300.00 will change the main trend to down. Taking out the last swing top at $330.81 will reaffirm the uptrend.
Traders found support recently inside a retracement zone at $309.16 to $300.80. However, recapturing the 50-day moving average at $316.47 will be needed to create enough momentum to retest the recent top at $330.81.
My bias is to the upside early in the session because the trend is up and the stock is expected to open on the strong side of the 50-day MA. If it fails to hold the expected early gains and the move over the moving average, then my outlook will weaken, with a retest of the retracement zone at $309.16 to $300.80 a strong possibility.
TSMC Posted a Record August and AI Demand Is Still the Driver
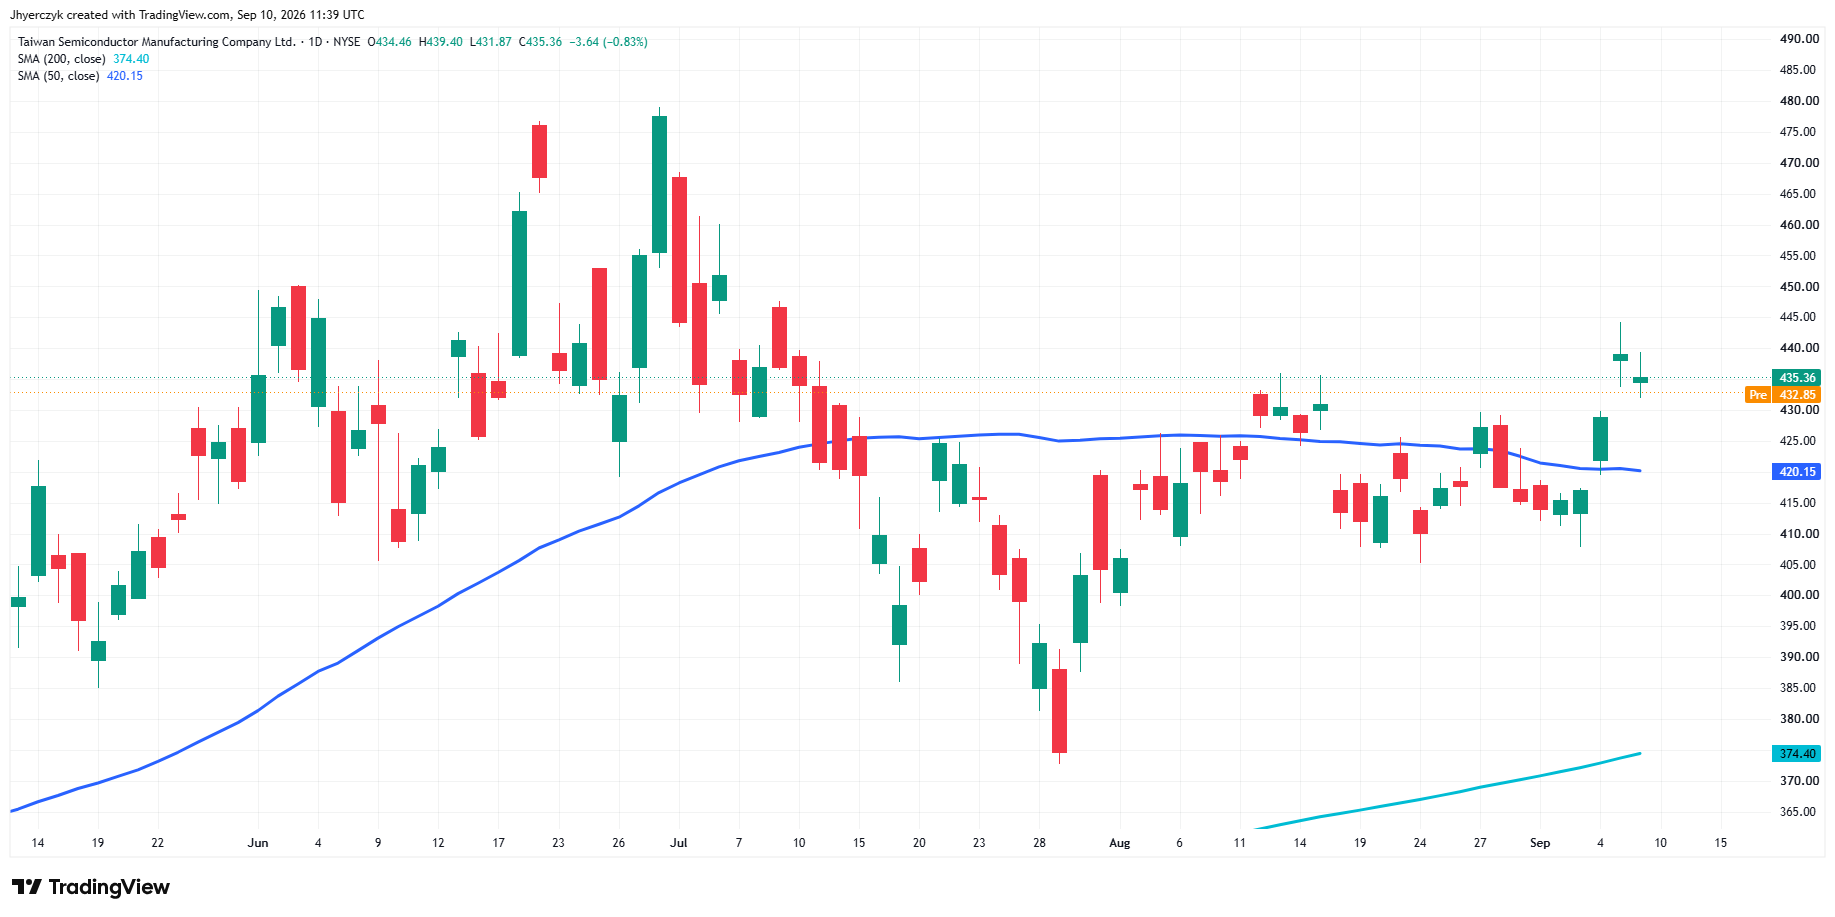
TSMC reported August revenue of NT$514.8 billion, about $16.35 billion. Revenue jumped 53.3% from a year earlier and 10.1% from July. That is a monthly record. The company has now posted four straight months of revenue growth.
TSMC controls 72.5% of the global foundry market. Advanced 5-, 4-, and 3-nanometer capacity remained fully booked during the second quarter as AI server processors continued to consume leading-edge chip capacity. The company said during its second-quarter earnings call that demand tied to artificial intelligence remained extremely strong. The August numbers confirmed it.
What to Watch
The Producer Price Index is the first test. The 10-year yield at 4.86% and crude above $100 Brent are already in the trade. A hot PPI that sends the 10-year through its recent highs keeps pressure on growth stocks and makes Thursday’s early futures recovery harder to hold. A softer print gives buyers their best chance to end the three-day losing streak. An in-line number may settle very little with the Consumer Price Index less than 24 hours away.
Apple has the product catalyst. TSMC has the revenue confirmation. The technology bid is real but it does not control the broader market if yields keep climbing. Friday’s Consumer Price Index is still waiting behind today’s report.
The S&P 500 bias stays to the downside with the trend down and a pattern of lower tops and lower bottoms since the August all-time high. The 50-day moving average held Wednesday. Sellers have to break it to extend the move. A hold there could produce a counter-trend bounce into the pivot at 7,696.625 but the trend does not change until 7,766.50 is taken out.
Apple’s trend is up and the stock is expected to open on the strong side of the 50-day at $316.47. The bias is bullish early in the session. A failure to hold the early gains and the move over the moving average weakens that read, with a retest of $309.16 to $300.80 the next risk.
More Information in our Economic Calendar.