


Silver Holding Steady With PPI Five Hours Away
Spot silver is down nearly 1% Thursday morning after Wednesday’s surge. Buyers are holding the metal near the top of the early range with the August Producer Price Index due at 12:30 GMT. The PPI is the first of two inflation reports before the Fed meets September 15-16. Traders are pricing a 60% chance of a 25-basis-point rate increase. That number has not settled. The Producer Price Index today and the Consumer Price Index Friday are the last reads that can move it.
At 09:11 GMT, Spot Silver (XAGUSD) is trading $66.69. The session high is $67.95. The low is $66.61.
The PPI Estimates Are Not Soft
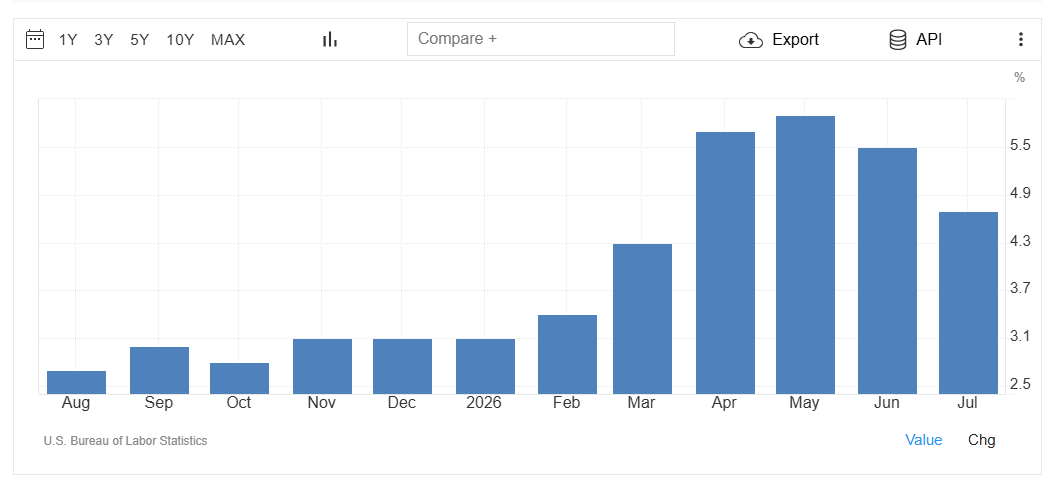
Headline producer prices are expected to rise 0.4% month over month after coming in flat in July. The annual rate is expected to climb to 5.3% from 4.7%. Core PPI is expected at 0.3% for the month, up from 0.2% in July. The annual core rate is expected to increase to 4.6% from 4.2%.
The street is already looking for an acceleration on both the headline and core readings. That is the baseline going into the number. Where the actual print lands relative to those estimates is what moves the trade today.
A Hot Number Puts the Bond Market Back in Front
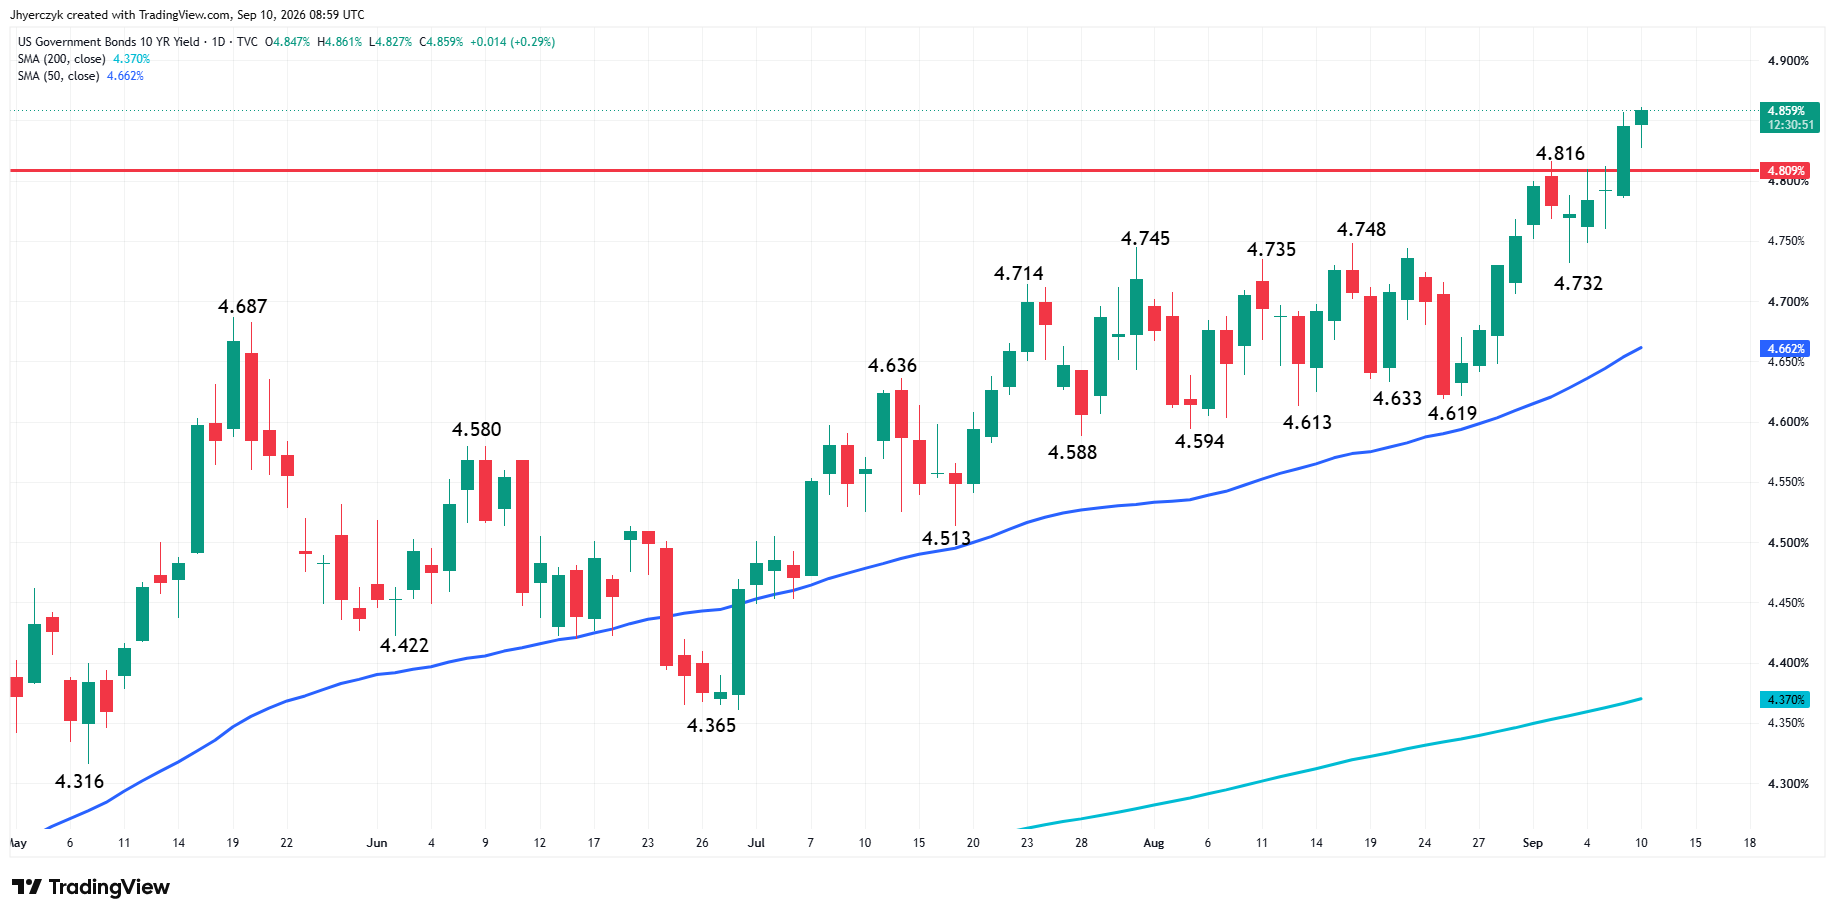
Treasury yields have already been running at elevated levels on inflation concerns, higher crude oil prices, and the possibility of tighter Fed policy. The 10-year yield recently reached its highest level since October 2023 before easing early Thursday.
Silver Price Forecast
Every new Silver analysis as it publishes, today's technical signal and key levels, live price — on one page.
See all Silver forecastsA PPI number above expectations puts sellers back into Treasuries. Yields move higher. Rate-hike odds for September climb. Silver does not pay interest and higher yields make interest-bearing assets more competitive against the metal.
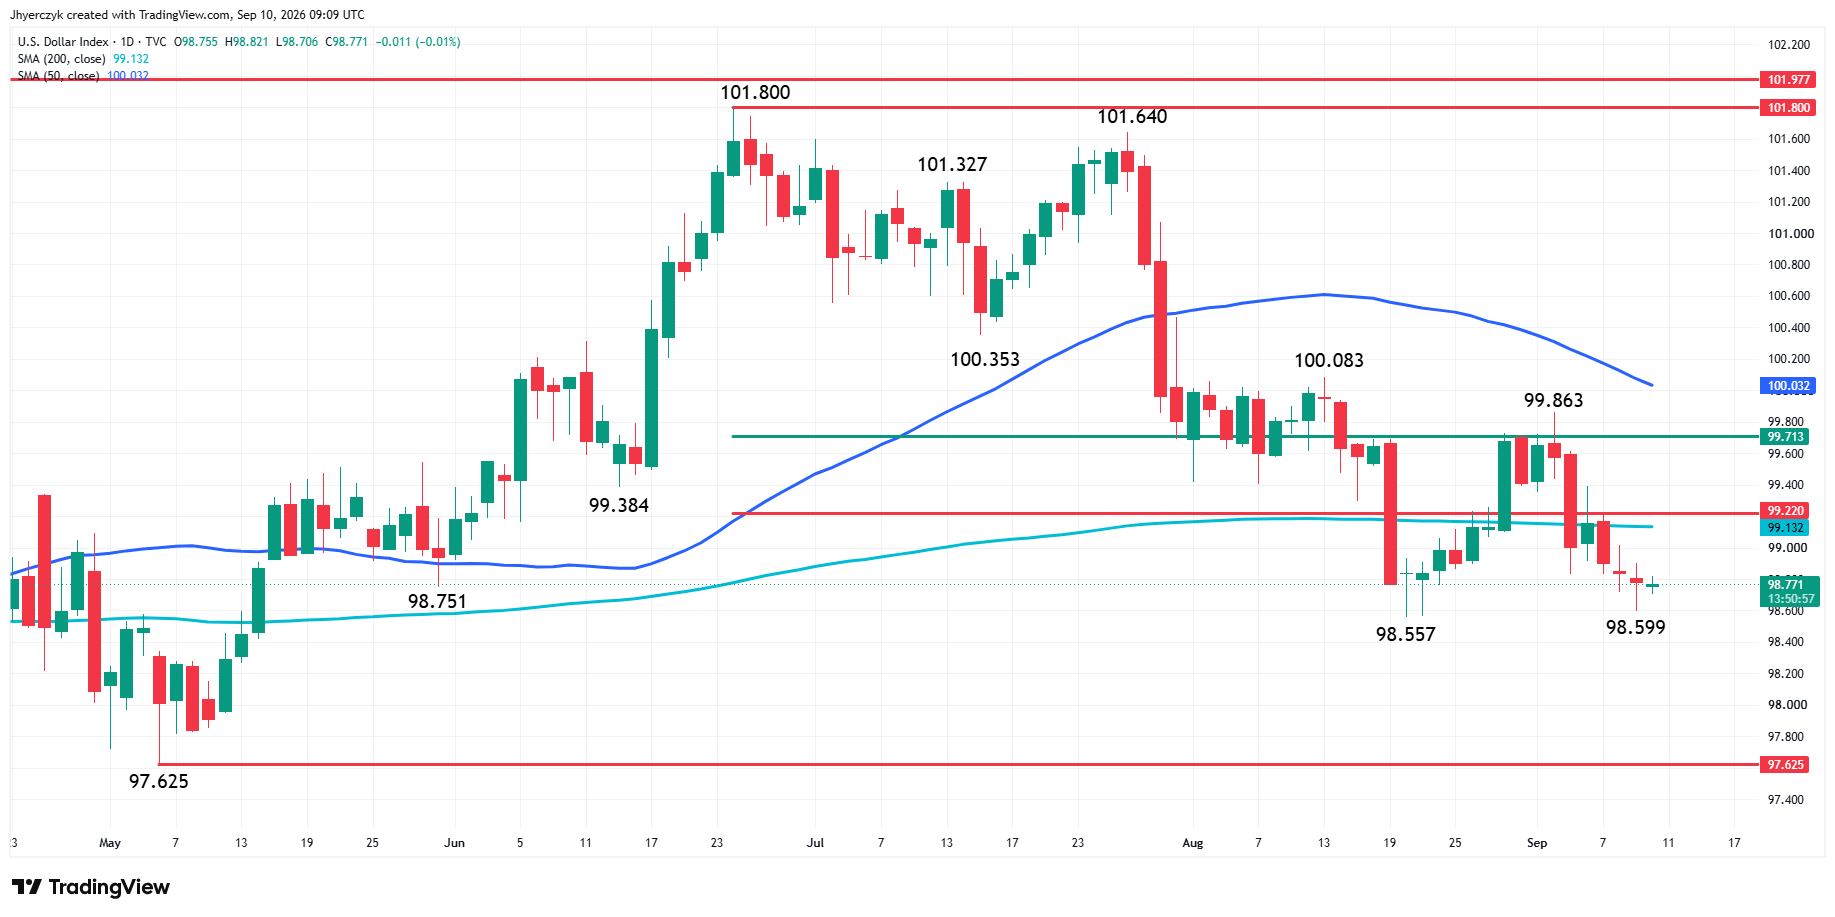
The dollar has stayed weak despite those elevated yields. That has been the cushion for silver. A hot PPI threatens both sides at the same time. If yields rise and the dollar catches a bid on the same print, silver buyers have a much harder job holding the recent gains.
A Soft Number Clears the Path
A softer-than-expected PPI reading eases rate-hike expectations, pulls yields lower, and could extend the dollar weakness that has been supporting the metal. That removes two obstacles at the same time and gives silver buyers room to press higher through the retracement zone overhead.
An in-line report may settle very little. Traders could hold positions and wait for Friday’s Consumer Price Index less than 24 hours later. Nobody has the complete inflation picture until the CPI prints Friday morning.
The Consumer Price Index Friday Still Has the Final Word
The PPI can move silver today. It is unlikely to settle the September rate decision by itself. Friday’s Consumer Price Index is the bigger report. Core CPI is expected to rise 0.2% in August.
That creates a two-session window. The PPI could push yields and the dollar one direction today and the CPI could reverse it Friday. Silver traders who position hard on one print are exposed to the next one less than 24 hours later.
Daily Spot Silver (XAGUSD) Technical Analysis
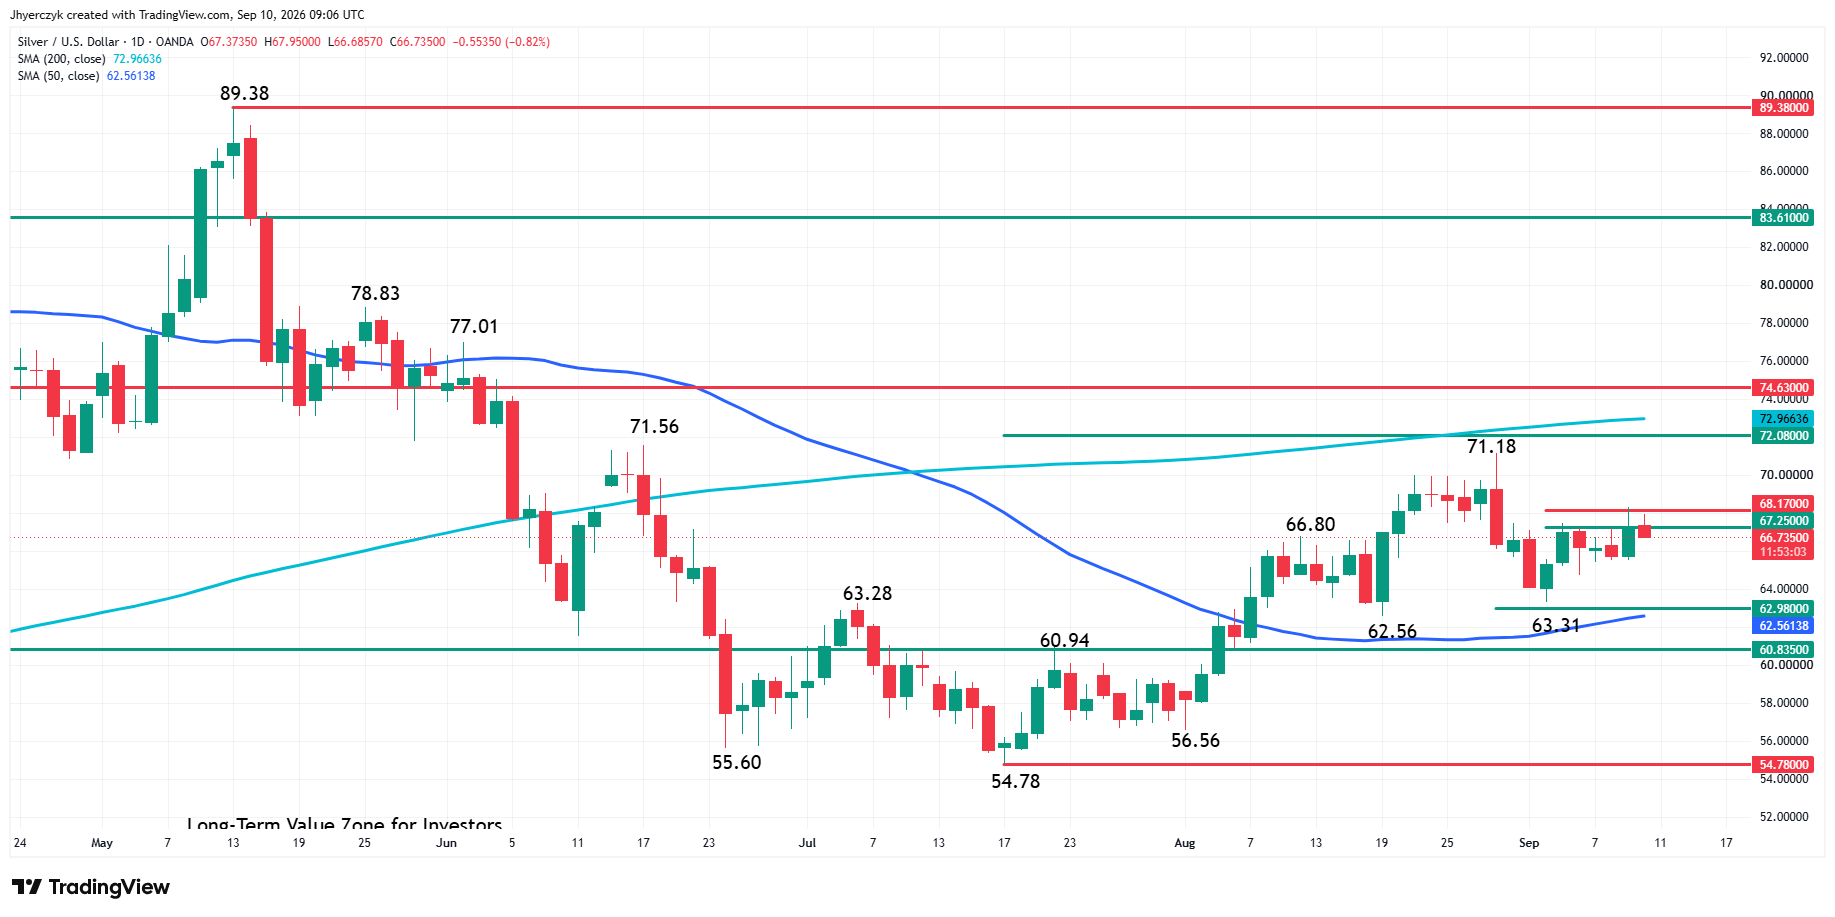
Spot silver is nearly flat early Thursday. Nonetheless, the market is still in an uptrend according to the daily swing chart, while battling a short-term retracement zone for direction, just like yesterday’s late session trade. Meanwhile, the market remains surrounded by 50-day moving average support at $62.57 and 200-day moving average resistance at $72.97.
According to the main swing chart, a trade through $63.31 will change the trend to down. Taking out the next swing bottom at $62.56 will reaffirm the downtrend.
On the upside, a trade through the August 28 main top at $71.18 will reaffirm the uptrend. Taking out the June 17 main top at $71.56 will be a sign that the uptrend is strengthening. Furthermore, swing chart analysis indicates the next area to watch will be $77.01 and $78.83 from June 2 and May 25, respectively.
The short-term range is $71.18 to $63.31. Spot silver is currently trading inside its retracement zone at $67.25 to $68.17. Trader reaction to this zone is likely to determine the direction of the market today.
A sustained move over the 61.8% level at $68.17 could indicate the presence of buyers. If this move creates enough near-term momentum, the market could test $71.18 to $72.97, which is the main top and the 200-day MA, respectively.
On the downside, a sustained move under the 50% price could be a sign of near-term weakness. This could lead to a test of a minor 50% level at $65.60, followed by the two main bottoms at $63.31 and $62.56. The 50-day MA at $62.57 could also be put in play.
What to Watch
The Producer Price Index at 12:30 GMT gets the first shot at the Fed trade. Treasury yields and the dollar are the two markets to watch after the number prints. The 10-year has been running at its highest since October 2023. The dollar has not followed it higher. The PPI decides whether that gap closes or stays open heading into Friday’s Consumer Price Index.
The bias ahead of the number is bullish and gets stronger if $68.17 is taken out with conviction. The retracement zone at $67.25 to $68.17 is the near-term battleground. A sustained move through $68.17 builds the momentum for a run at $71.18 and the 200-day moving average at $72.97. The trend weakens if buyers cannot hold $67.25. A failure of $63.31 changes the main trend to down and takes the bullish call off the table.
More Information in our Economic Calendar.