20-Day Average Becomes Near-Term Pivot
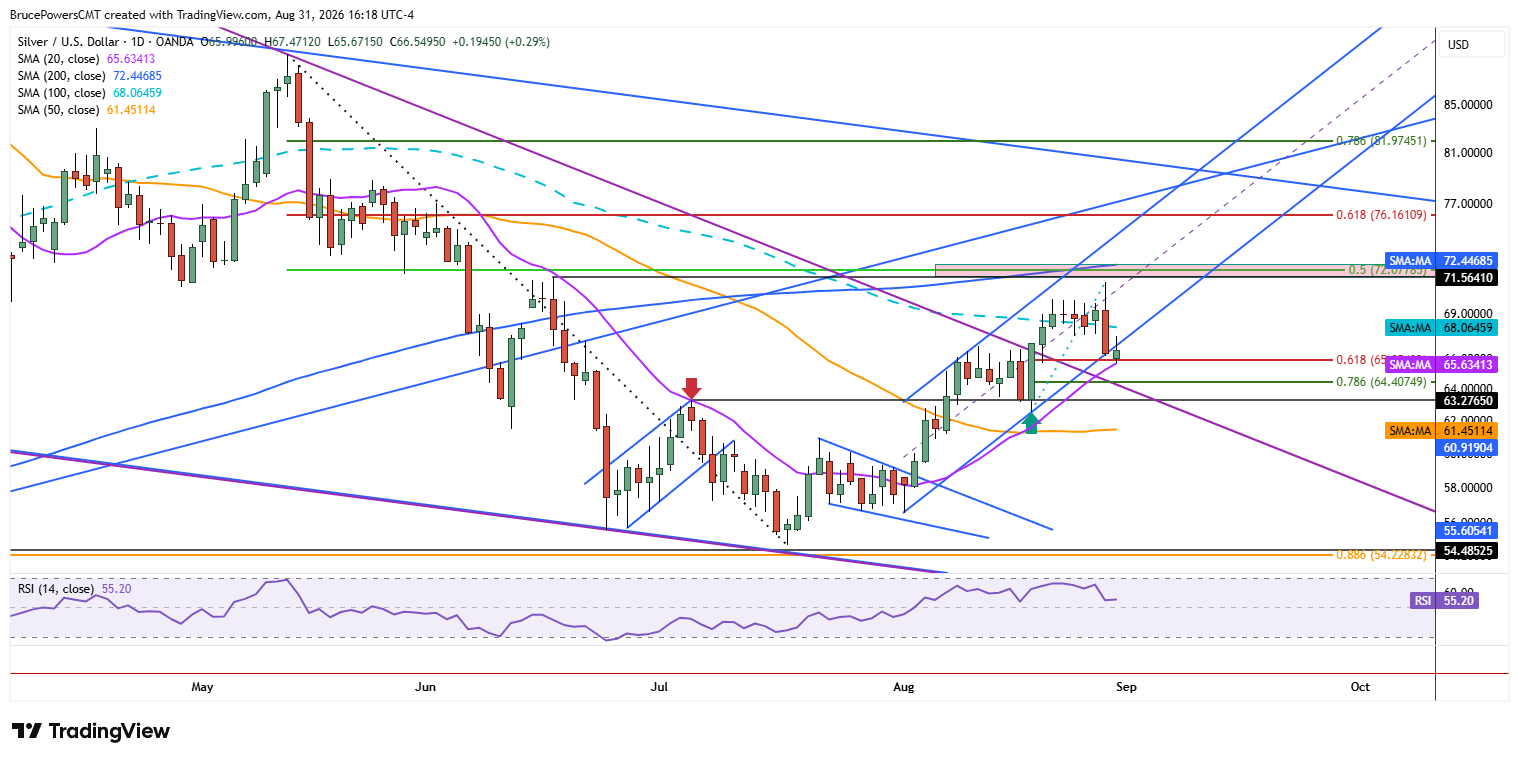
Silver declined to a lower daily low of $65.67 on Monday, as it tested support near the 20-day moving average for the first time since that average was reclaimed in early August. The decline completed a 61.8% Fibonacci retracement of the prior upswing at $65.85, reinforcing the support zone. The confluence of those two support levels is further reinforced by a small former resistance range from earlier in August that now occupies the same area.
Those overlapping levels create a well-defined zone that bulls will want to defend if the mid-July reversal is to remain valid. Whether a recovery follows Monday’s low or not, silver has reached a key near-term pivot. A sustained decline below the 20-day moving average would suggest further downside pressure, while staying above it would continue to support the integrity of the developing uptrend.

Two Scenarios After 29% Rebound
Although a break below the 20-day moving average would be a sign of weakening, it could lead to further downside or to a relatively quick recovery. That is why multiple levels are watched and why signals need additional confirmation. Two basic scenarios may unfold from here, each with its own variations. On one hand, silver has been showing signs of a bullish reversal of the short-term downtrend since the second half of July.
As of the rally high of $71.18, it was up by as much as 29.5% from the $54.78 low reached in mid-July. Was there any significance to that resistance zone that would suggest it was only a temporary stop on the way to higher targets, or that it completed the current advance?
200-Day Cluster Still Overhead
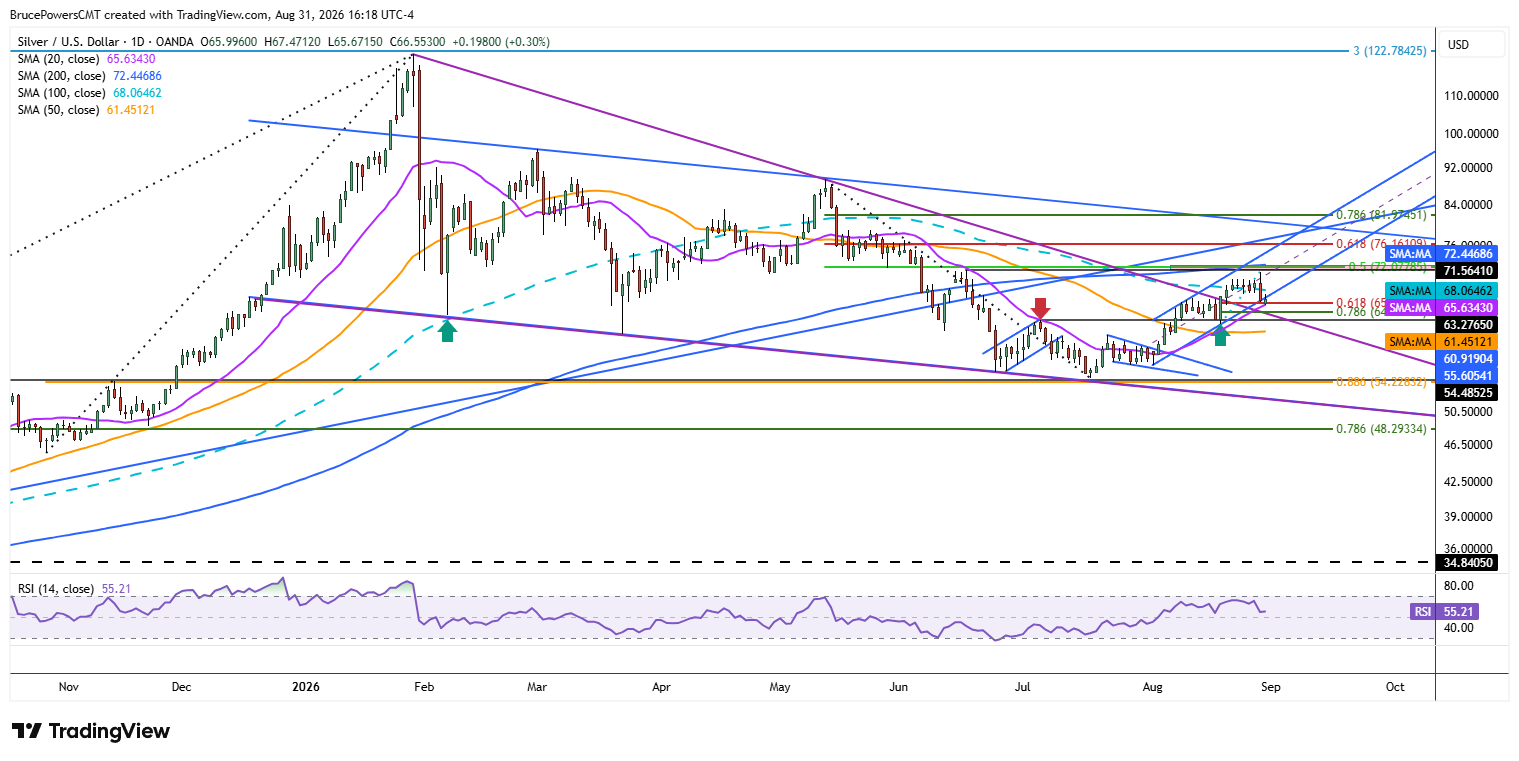
The answer to that question is that the resistance zone may be significant, since it is highlighted by three indicators. There is a prior lower swing high at $71.56, a 50% retracement of a prior downswing at $72.08, and the 200-day moving average near $72.44 and rising. Either the area around the 200-day moving average can be further tested before support at the 20-day moving average fails, or further signs of strength may follow Monday’s low, generating a higher swing low and another leg up in the uptrend.
Traders will watch price action around Monday’s low and the 20-day moving average for confirmation of the next swing. In that way, the test of the 20-day moving average that opened this week also closes the near-term question: whether the advance that began from the mid-July low remains intact.