Silver Sellers Ran Hard but Buyers Showed Up at $65.67
Silver gave back Friday’s damage and then some before catching a bid in the New York afternoon. Spot silver is trading at $66.11 at 18:42 GMT, down $0.25 or 0.38%. The metal opened near $66.45 Monday, pushed to $67.47 in early trade, then sold off to $65.67 before the selling exhausted itself near the lows. Friday’s 4% drop carried into Monday morning but the follow-through ran out.
Silver had climbed above $70 earlier in August before Friday’s reversal wiped out more than 4% in a single session. The metal is still up more than 14% for the month and more than 60% from a year ago. Traders who bought the August rally have not all left. Some of them showed up at the lows Monday and stopped the slide.
Warsh and Oil Hit Silver on the Same Day
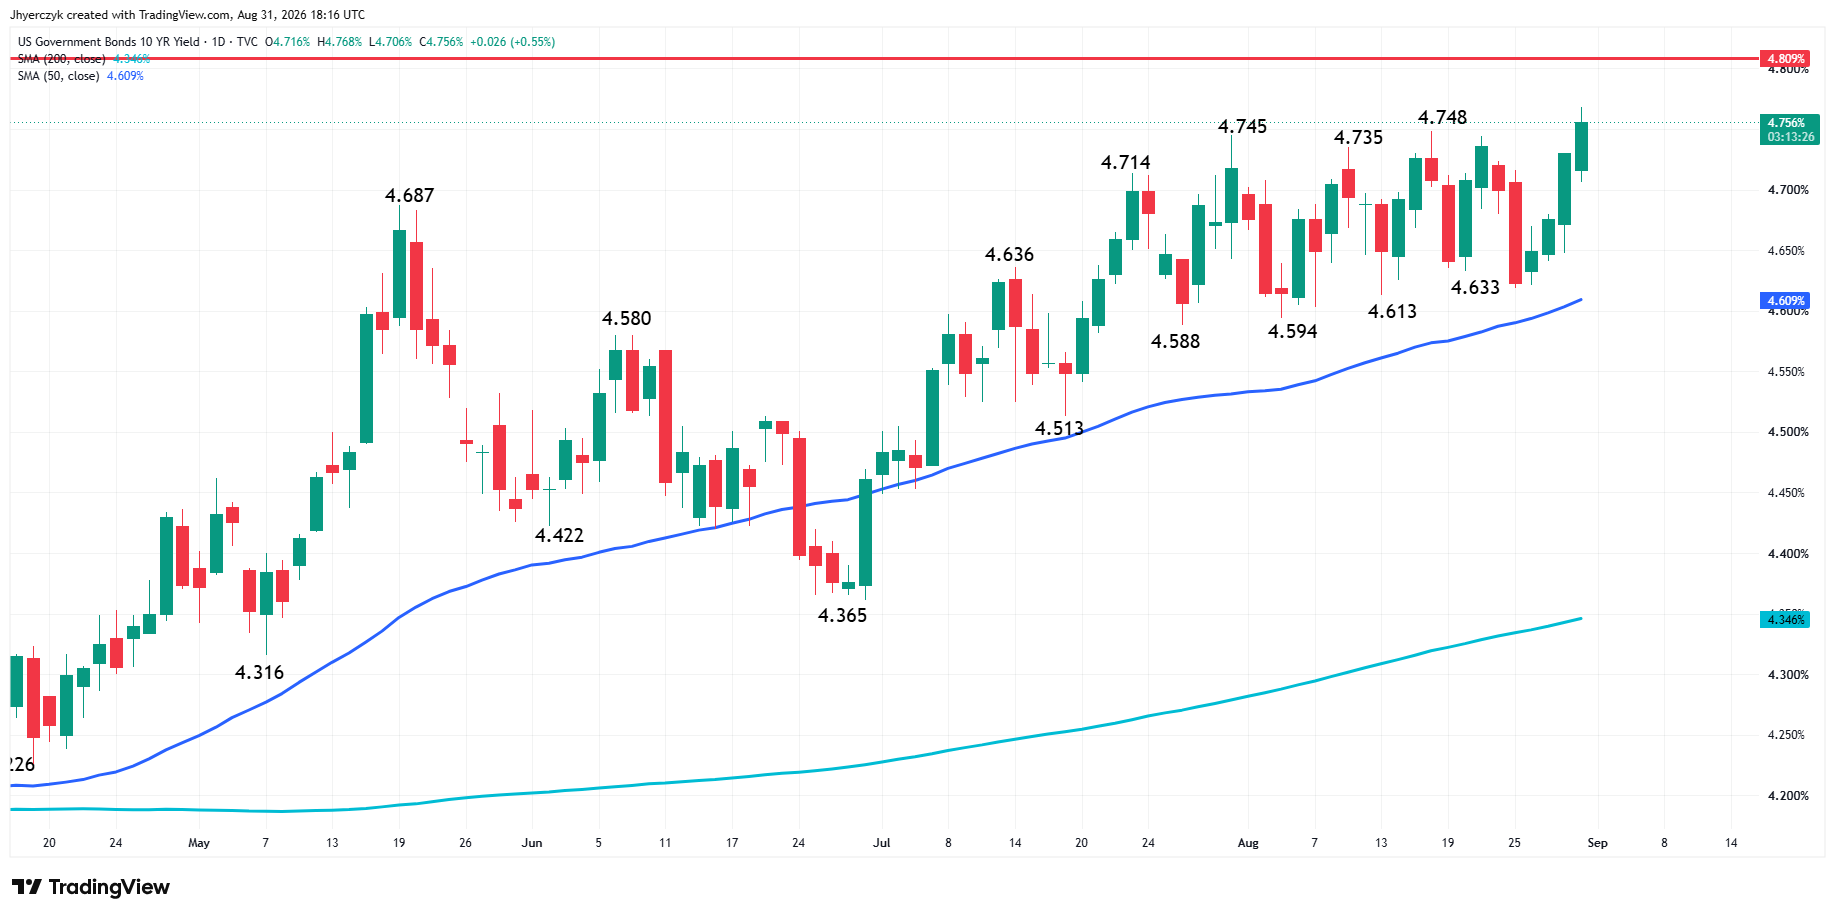
Warsh’s Jackson Hole speech is still in the price. He said Friday the central bank has more work to do on inflation and left a September rate increase on the table. The dollar firmed Monday. Treasury yields climbed. Silver was already under pressure from Friday’s reversal and Warsh gave sellers another reason to lean on the market.
Oil jumped Monday after reports of fresh U.S. military strikes near the Strait of Hormuz. Silver traders already know what higher crude does to the inflation outlook. That is not a headline the metal can ignore when the Fed is already watching prices. The combination kept silver on the defensive for most of the session. Prices ran from $67.47 to $65.67 in a few hours as the rate story and the oil story both worked against the metal at the same time.
The late bounce off the lows took the worst of the damage out but the daily close is still red. Silver went from $65.67 back to $66.11 by late afternoon. That stopped the bleeding from Friday. It did not reverse it.
Factory Demand Held the Floor
Physical demand from factories and solar-panel makers did not disappear because Warsh gave a speech. That bid is the reason silver found buyers near $65.67 instead of breaking through. Dealers noted that inventories have not flooded the market. When the first wave of selling exhausted itself Monday afternoon, there was enough demand underneath to catch the metal.
Silver Price Forecast
Every new Silver analysis as it publishes, today's technical signal and key levels, live price — on one page.
See all Silver forecastsThe recovery was not aggressive. A move from $65.67 to $66.11 is stabilization, not a reversal. But after a 4% Friday and a full day of selling pressure Monday, holding that low was the minimum the demand side needed to deliver. The month is still up 14%. The year is still up more than 60%. Nobody ran for the exits at $65.67 and that tells you something about how the physical market is reading this pullback.
Daily Spot Silver (XAGUSD) Technical Analysis
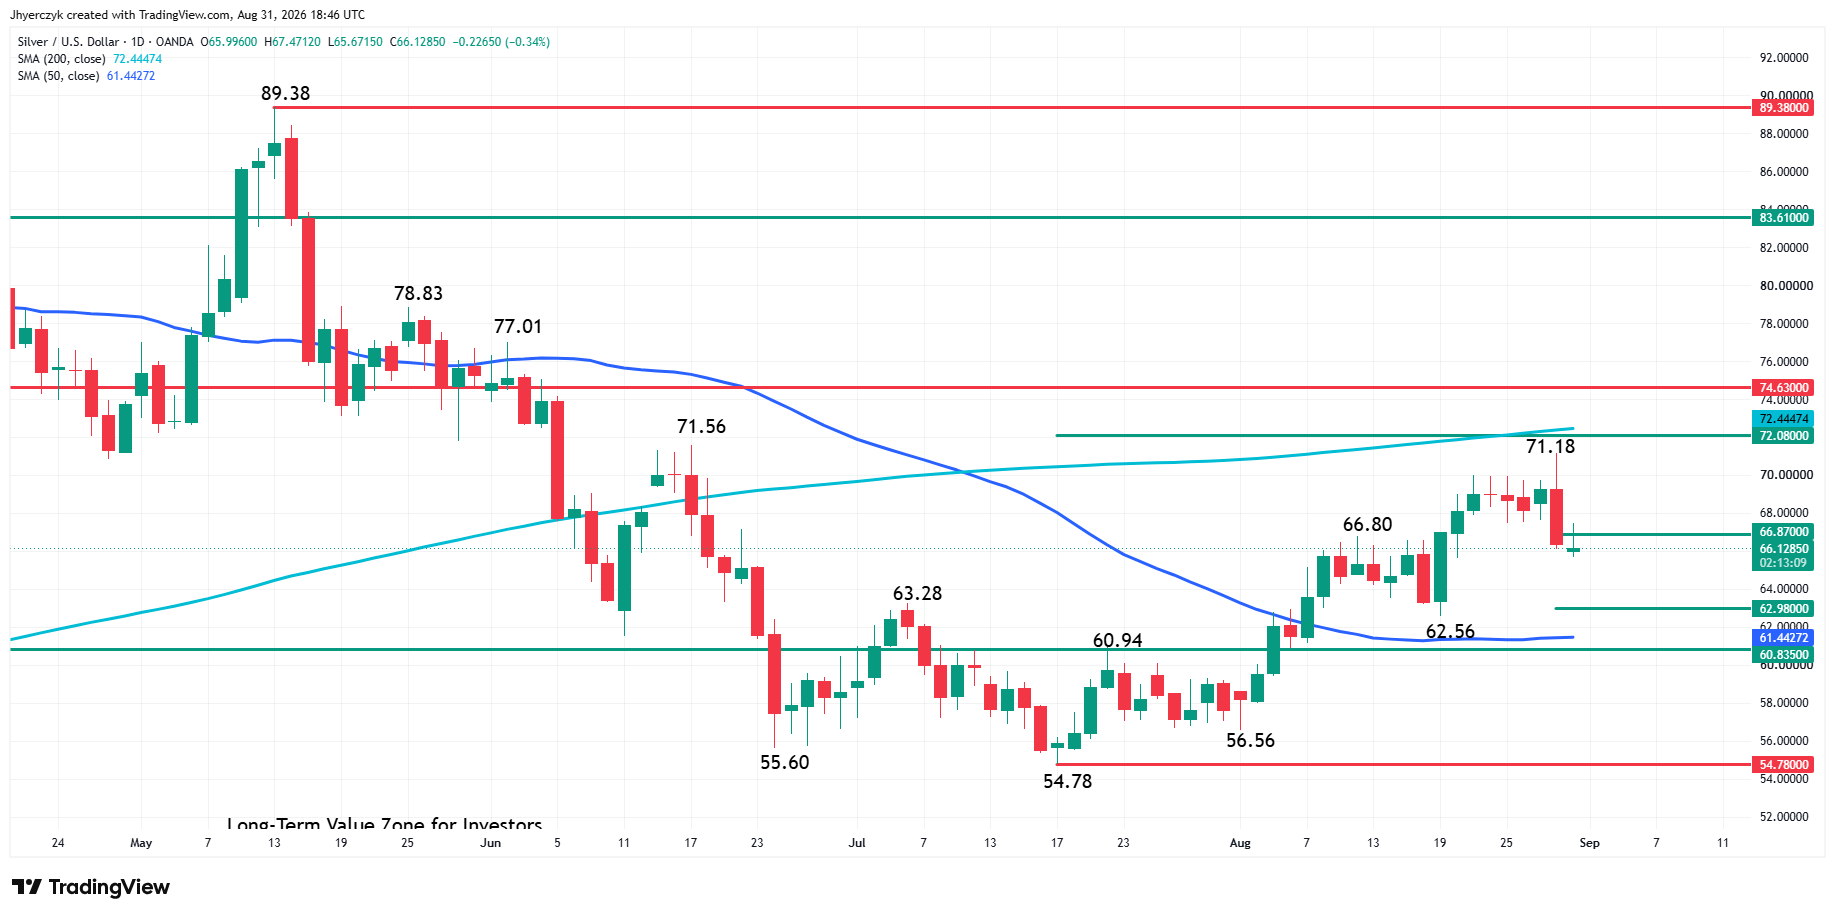
Spot silver is edging lower late in the session on Monday as it follows through to the downside following Friday’s steep sell-off.
The main trend is up according to the daily swing chart, but the confirmation of Friday’s closing price reversal top at $71.18 has shifted momentum to the downside. A trade through $71.18 will negate the closing price reversal top and signal a resumption of the uptrend. The next goal for buyers will likely be to overtake the 200-day moving average at $72.45.
The short-term range is $62.56 to $71.18. Spot silver is currently trading on the weak side of its 50% level at $66.87. If the selling pressure persists then the move could extend into the intermediate 50% level at $62.98.
The next target under the intermediate 50% level is the swing bottom at $62.45 and the 50-day moving average at $61.44. The major support zone is the long-term retracement area at $60.835 to $54.78.
What to Watch
Warsh and oil are both pointing the same direction going into the rest of the week. The jobs report decides whether the September rate story gets stronger. Silver held $65.67 Monday on physical demand but that was buyers catching falling prices, not taking control. The selling side has the momentum after two sessions of losses and crude is not helping.
Momentum shifted to the downside after Friday’s closing price reversal top at $71.18. Silver is trading below the 50% level at $66.87 and the next support that matters is the intermediate level at $62.98. The larger uptrend is intact but the demand side needs to hold above there to keep it that way.
More Information in our Economic Calendar.