NVDA Technical Analysis
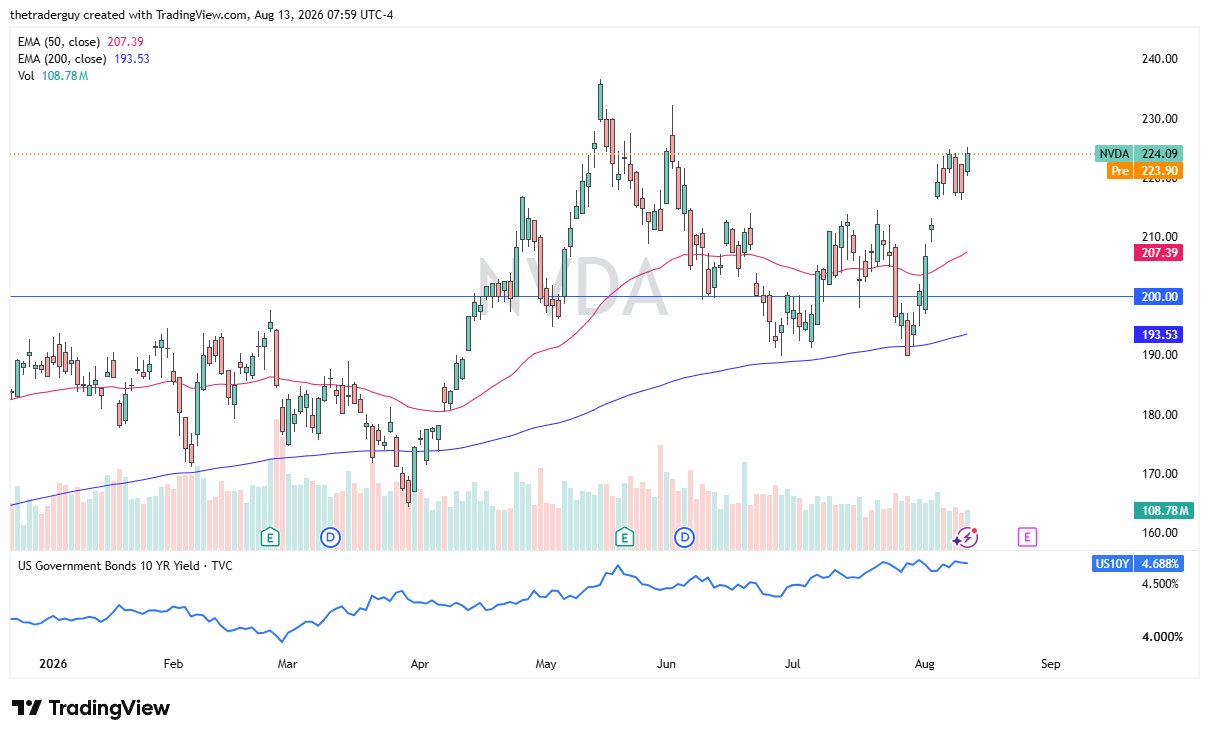
The pre-market trading of Nvidia is at the top of the range it’s been in for a couple of days now, showing signs of bullish pressure as we head towards the earnings call that comes out on the 26th. All things being equal, this is a market that gapped and has been consolidating since.
That’s a fairly strong sign, as we have not felt the need to give back that gap. And of course, the market always seems to have at least one eye on Nvidia. It’s been the darling of Wall Street for a couple of years now. Certainly, if the AI trade comes back, Nvidia is a big component of that.

AMD Technical Analysis
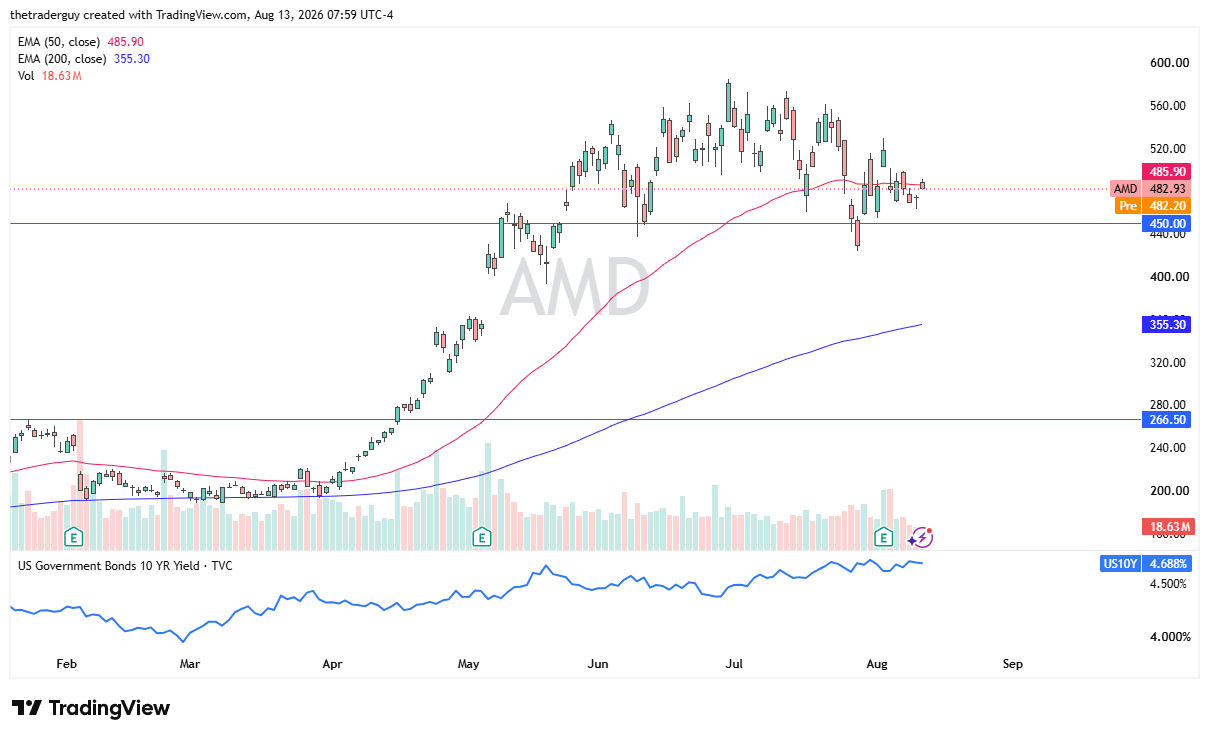
AMD looks as if it’s going to be ever so slightly lower at the open as we continue to round the top. The $450 level has been seen as support recently. We are right around the 50-day EMA, so I’m watching to see if there is some type of bounce.
This is a market that’s been very strong this year, more than doubling since April. It does make sense that maybe gravity comes back into the picture. We’ll have to wait and see.
The question now is going to be: do we get a pullback, or do we just go sideways for a while? I think that is what the market’s trying to sort out at the moment.
ORCL Technical Analysis
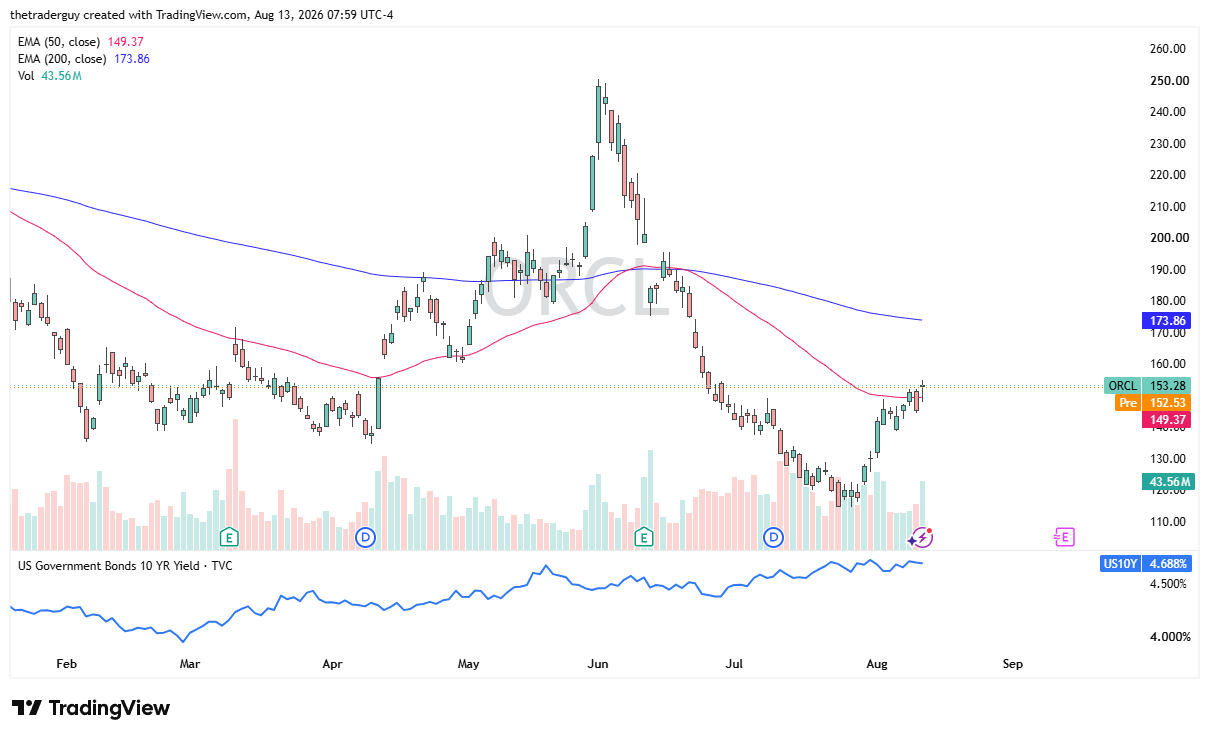
Oracle looks fairly elevated over the last couple of weeks. The open could be just a touch lower, but during the previous session here, we had seen the market for Oracle dip back below the 50-day EMA and then bounce after a gap higher.
Ultimately, the candlestick is fairly supported from the 50-day EMA, the previous price action, and the shape of the candlestick being a hammer is something that people will be watching as well. All things being equal, we did have a significant amount of volume on Wednesday, so that’s a good sign as well.
We’ll just have to see if momentum can pick up. If it does, the next major technical area would be the $160 level based on psychology, and then the 200-day EMA.
If you’d like to know more about technical analysis and how traders use it, please visit our educational area.