
U.S. Dollar Gains Ground As Traders Buy The Dip
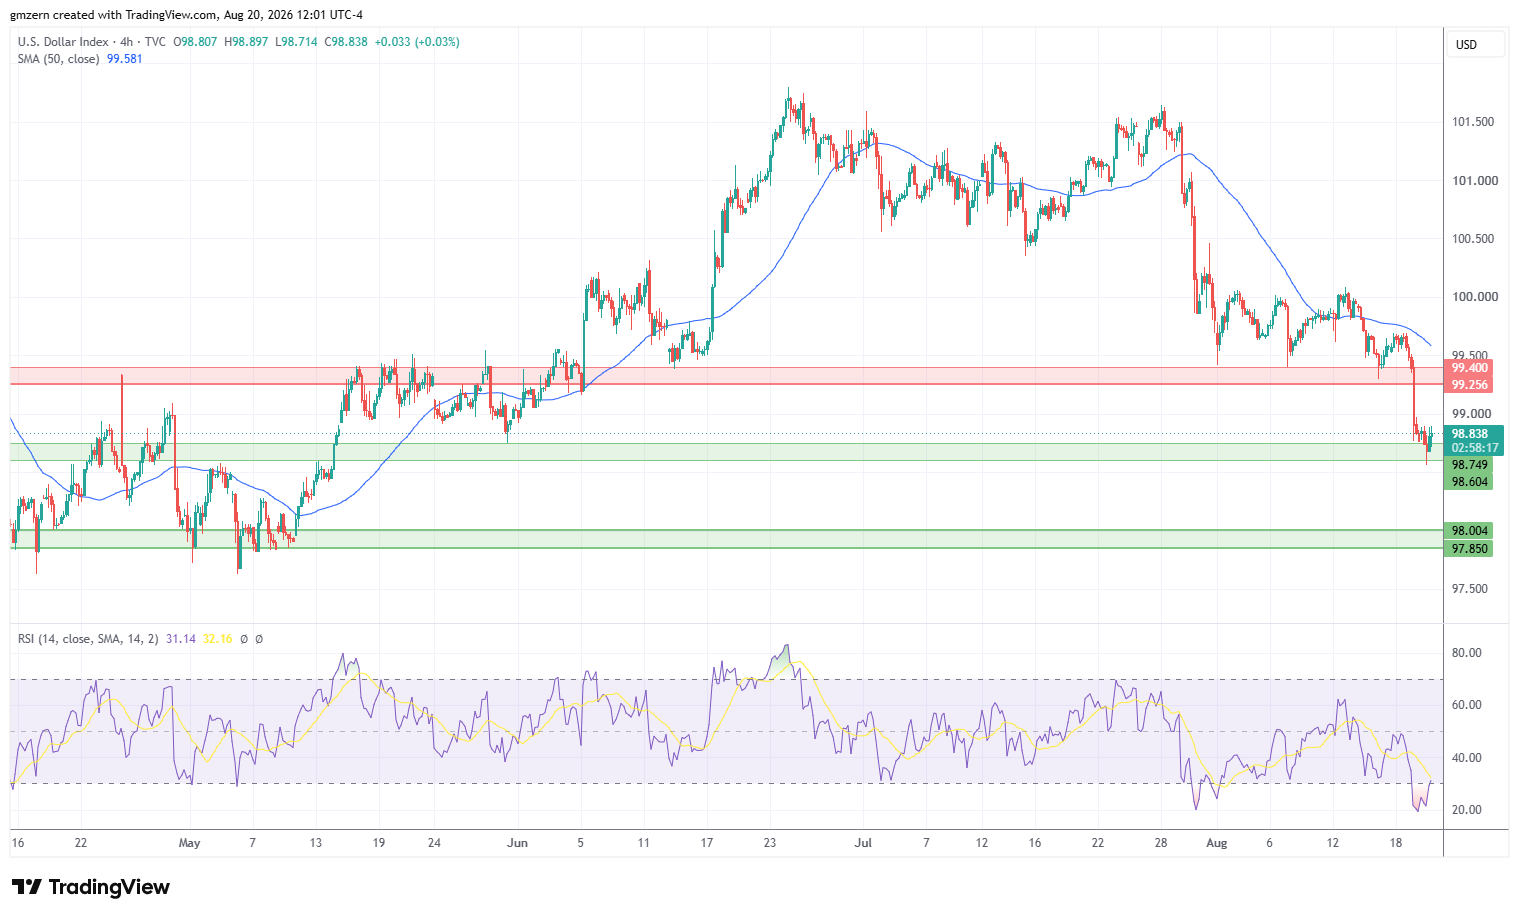
U.S. Dollar Index attempts to rebound after the strong sell-off, which was triggered by Treasury’s decision to boost buybacks of long-dated bonds.
Today, U.S. Treasury Secretary Scott Bessent indicated that Treasury could increase buybacks to more than $4 billion per issue.
Traders also focused on the Initial Jobless Claims report. The report indicated that 206,000 Americans filed for unemployment benefits in a week, compared to analyst forecast of 210,000.
U.S. Dollar Index failed to settle below the support level at 98.60 – 98.75 and is moving towards the 99.00 level. In case U.S. Dollar Index climbs above 99.00, it will head towards the nearest resistance at 99.25 – 99.40. A move above 99.40 will push U.S. Dollar Index towards the 50 MA at 99.58.

EUR/USD Is Mostly Flat Amid Profit-Taking
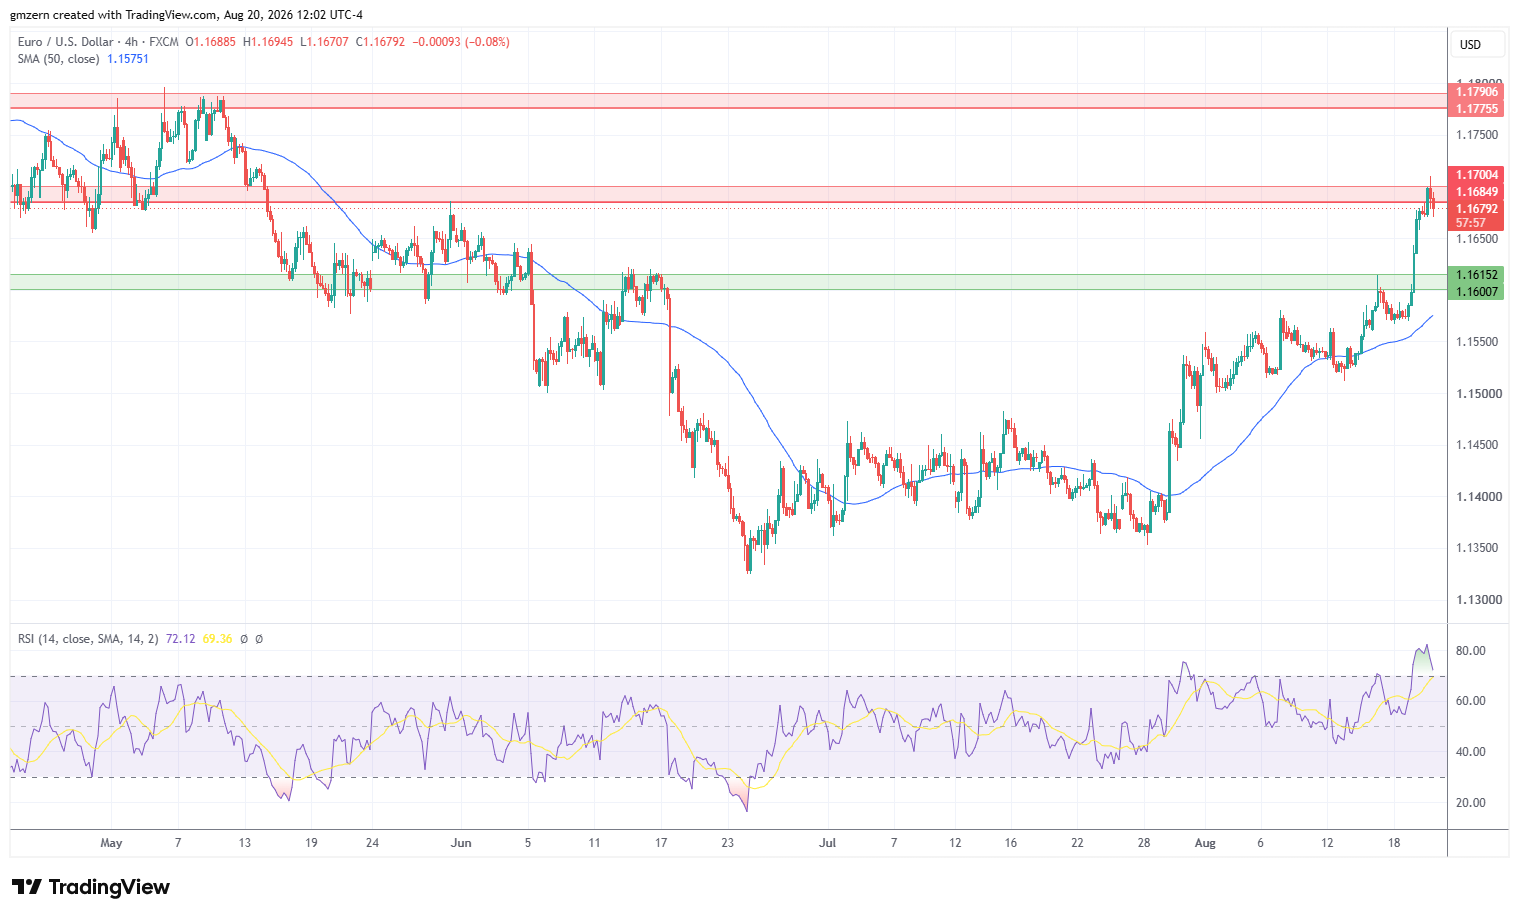
EUR/USD is mostly flat as traders take some profits off the table and react to Germany’s PPI report. The report indicated that PPI increased by +3% year-over-year, compared to analyst forecast of +2.7%.
From the technical point of view, EUR/USD attempts to settle above the resistance level at 1.1685 – 1.1700. If EUR/USD moves above the 1.1700 level, it will head towards the next resistance at 1.1775 – 1.1790.
EUR/USD Price Forecast
Every new EUR/USD analysis as it publishes, today's technical signal and key levels, live price — on one page.
See all EUR/USD forecastsGBP/USD Tests Resistance At 1.3635 – 1.3650
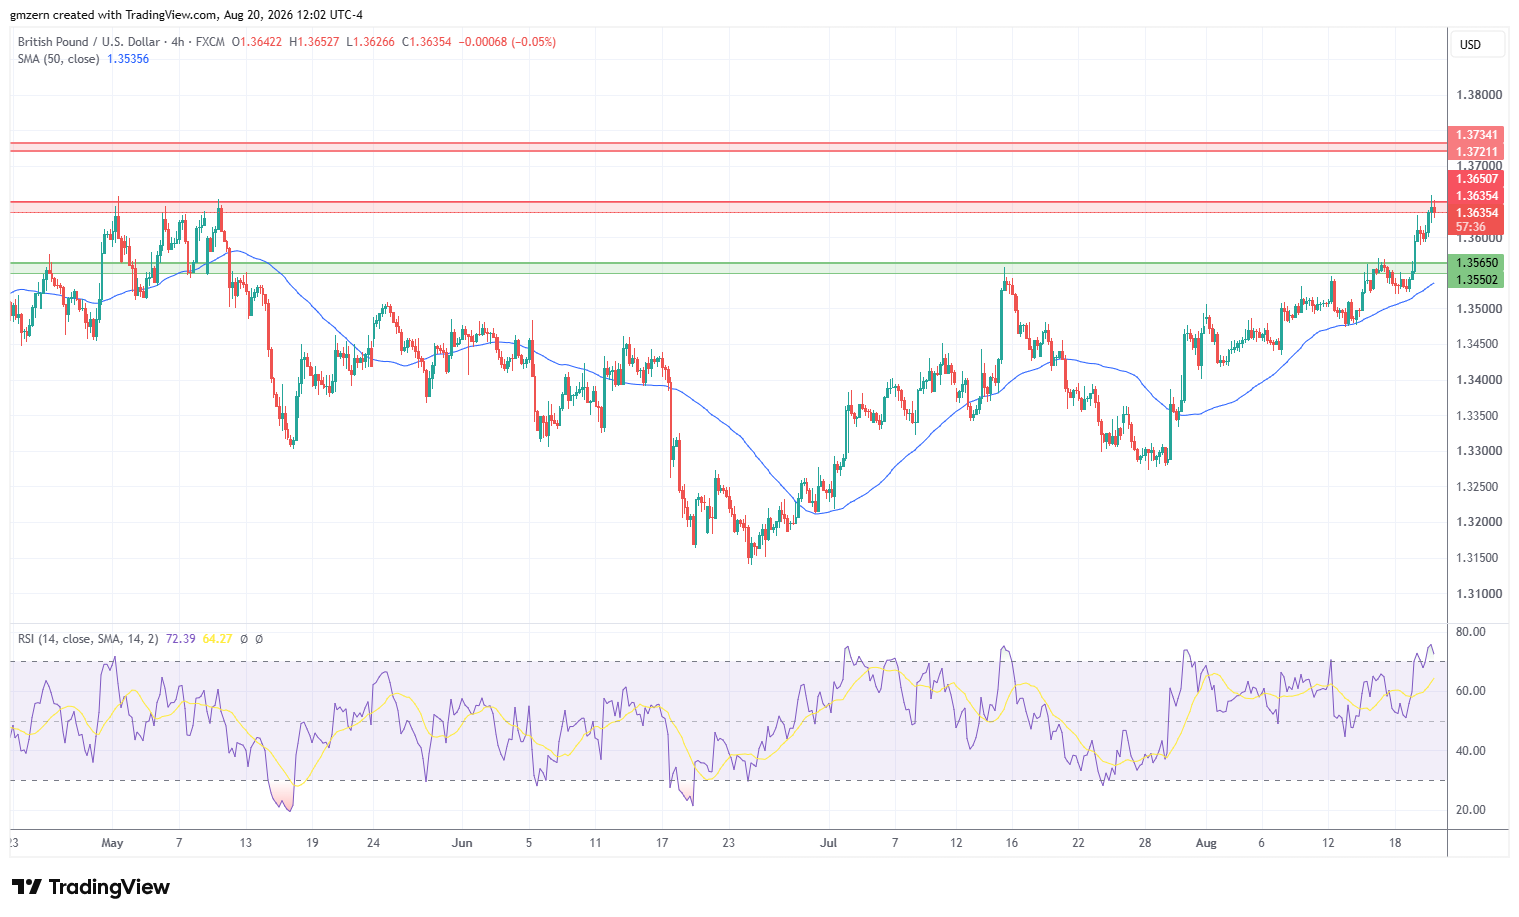
GBP/USD tested new highs as rally continued. Traders bet that Treasury’s bond buybacks will put additional pressure on the American currency.
Currently, GBP/USD is trying to settle above the resistance level at 1.3635 – 1.3650. In case this attempt is successful, GBP/USD will move towards the next resistance, which is located in the 1.3720 – 1.3735 range.
USD/CAD Tests New Lows

USD/CAD remains under pressure as traders focus on rising oil prices. Other commodity-related currencies are mixed in today’s trading session.
In Canada, traders focus on the New Housing Price Index report. The report showed that new housing prices decreased by -0.1% month-over-month in July, compared to analsyt forecast of 0%.
The nearest support level for USD/CAD is located in the 1.3735 – 1.3750. A successful test of this level will push USD/CAD towards the support level at 1.3635 – 1.3650.
On the upside, a move above the 1.3800 level will open the way to the test of the resistance level at 1.3825 – 1.3840. RSI has recently moved out of the oversold territory, so there is plenty of room to gain momentum in case the right catalysts emerge.
USD/JPY Gains Ground As Treasury Yields Rise
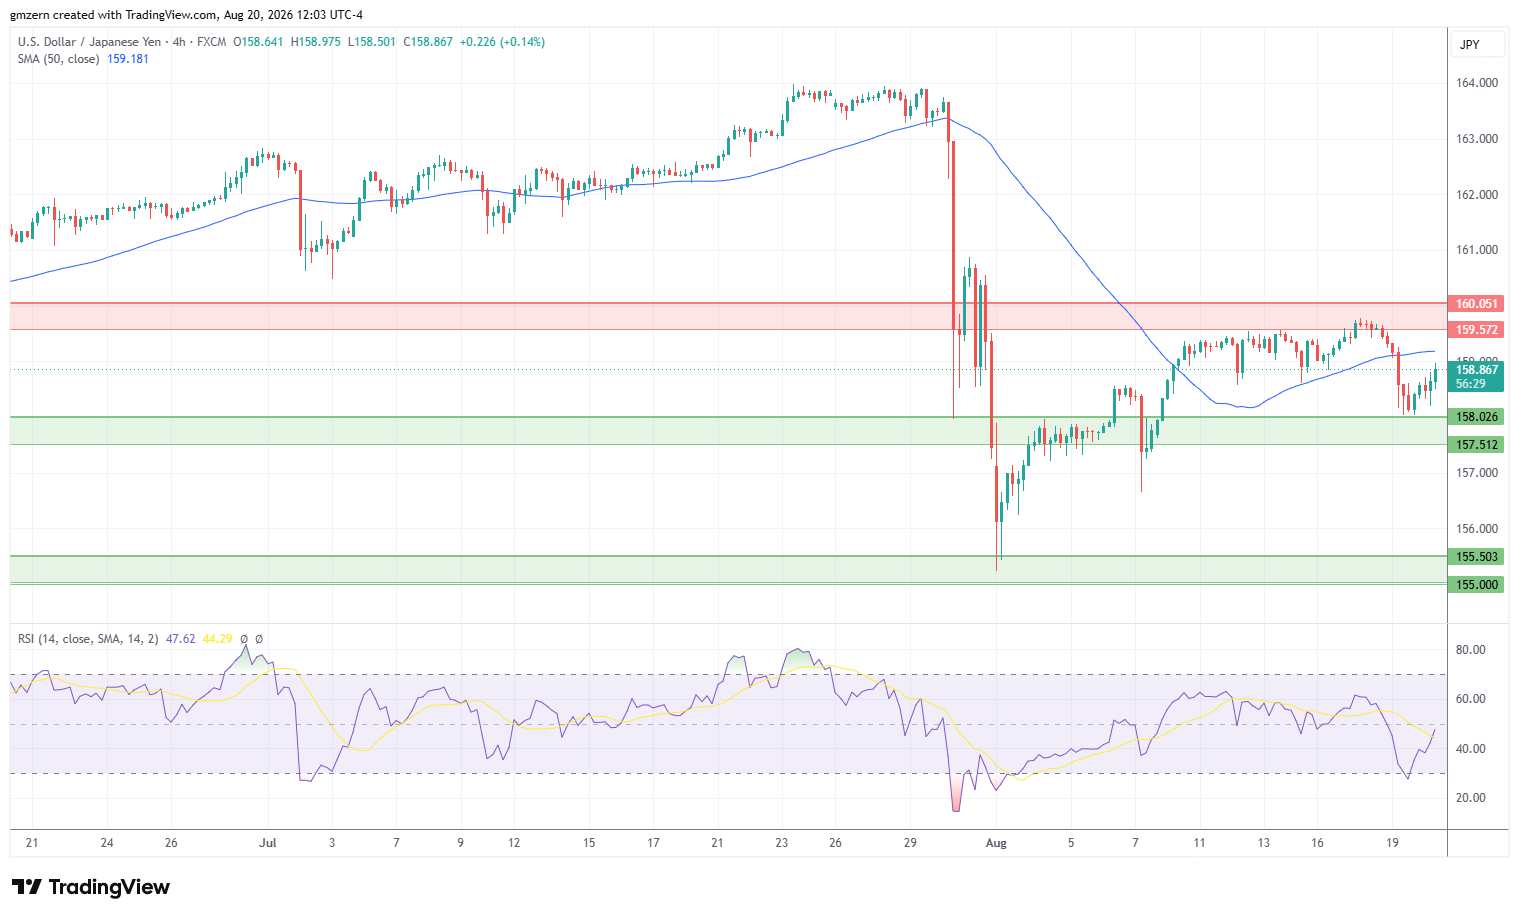
USD/JPY rebounds as traders focus on rising Treasury yields. The yield of 2-year Treasuries climbed towards the 4.20% level, while the yield of 10-year Treasrueis settled above 4.70%. Treasury yields are moving higher despite Bessent’s efforts to push them lower as bond traders remain worried about long-term rate outlook.
If USD/JPY climbs above the 50 MA at 159.18, it will move towards the nearest resistance level at 159.50 – 160.00. A move above 160.00 will push USD/JPY towards the 162.00 level. It remains to be seen whether BoJ is ready to intervene in case USD/JPY climbs above the psychologically important 160.00 level.
If you’d like to know more about how to trade forex, please visit our educational area.