
US Dollar News: Warsh Hike Bets Meet Fresh Jobs Risk
With Kevin Warsh’s hawkish Jackson Hole speech, US dollar markets head into the first trading day of September with an anticipation of a hardening policy backdrop. This has moved the markets up to around a 65% chance of a rate hike this month. Increased fighting between the US and Iran has pushed oil prices up, sparking a renewed fear of longer elevated inflation due to rising prices of energy. This week’s data will test the labor market, with the JOLTS job openings and ADP employment reports being released before Friday’s nonfarm payrolls reporting, which shows meager expectations for the payroll reporting after July’s contraction.
The euro forecasts a harder ECB policy in the upcoming week, while the negative cross- currency carries are working in the euro’s favor. The impact of the sanctions on Iran will likely sustain euro area inflation and push it upward. European bond yields are rising and the markets expect the next inflation data to support the case for another policy tightening by the ECB.
The pound’s outlook is more cautious. The Bank of England still has to deal with inflation being above target but softer wage and job growth means the Bank won’t be forced to act to address the issue. This means the pound is more sensitive to global events, dollar moves, and changes in risk sentiments rather than having to deal with an inflation focused ev ev hawk policy.
Dominant FX themes for September 1. Geopolitical tensions and diverging policies. The dollar is looking stronger due to renewed expectations of hikes by the Fed, the euro is expectations of ECB tightening and persistance in inflation, and the pound is expected to weaken based on softening labor data. Newly released US jobs data can either support Warsh’s hawkish outlook or cause markets to reevaluate.

U.S. Dollar Index Technical Analysis: DXY Holds 99.41 Support but Recovery Still Needs 99.58 Break
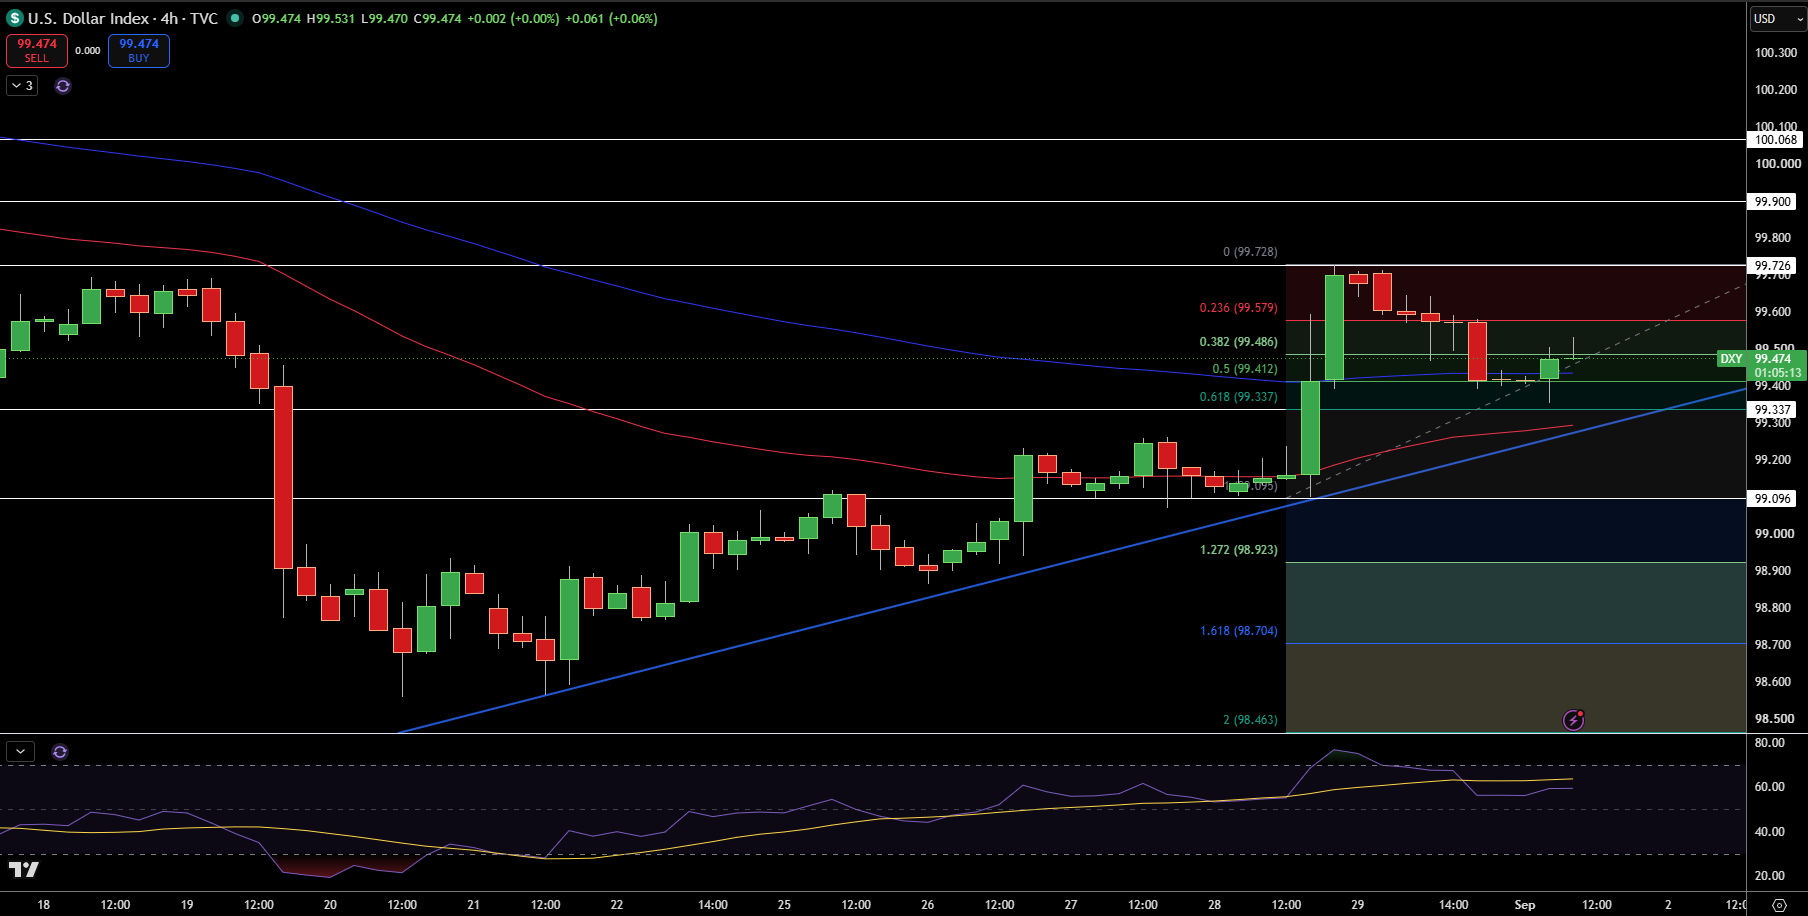
The U.S. Dollar Index is currently trading at 99.47 on the 4 hour chart after pulling back from the 99.73 region. Currently, price is holding the 38.2% Fibonacci level at 99.49 with the 50% retracement at 99.41, and the 61.8% level at 99.34 below. For now, the broader recovery structure is intact, but DXY must clear the resistance band before we can expect the upside to accelerate.
Immediate resistance sits at 99.58, 99.73, 99.90, and 100.07. On the contrary, support remains at 99.41 to 99.34 and then at 99.10 and 98.92. Above all, the rising trendline from the recent lows preserves the overall recovery structure.
RSI is currently at the mid 50s, showing neutral to positive momentum. DXY, for now, stays in the bullish territory, and a move above 99.58 would be constructive to the bullish case targeting 99.73 to 99.90 levels. However, breaking the 99.34 level would affect the recovery structure and call for a move towards 99.10.
EUR/USD Price Forecast
Every new EUR/USD analysis as it publishes, today's technical signal and key levels, live price — on one page.
See all EUR/USD forecastsGBP/USD Technical Analysis: Pound Stabilizes Near 1.3548 but Broken Channel Keeps Pressure on Bulls
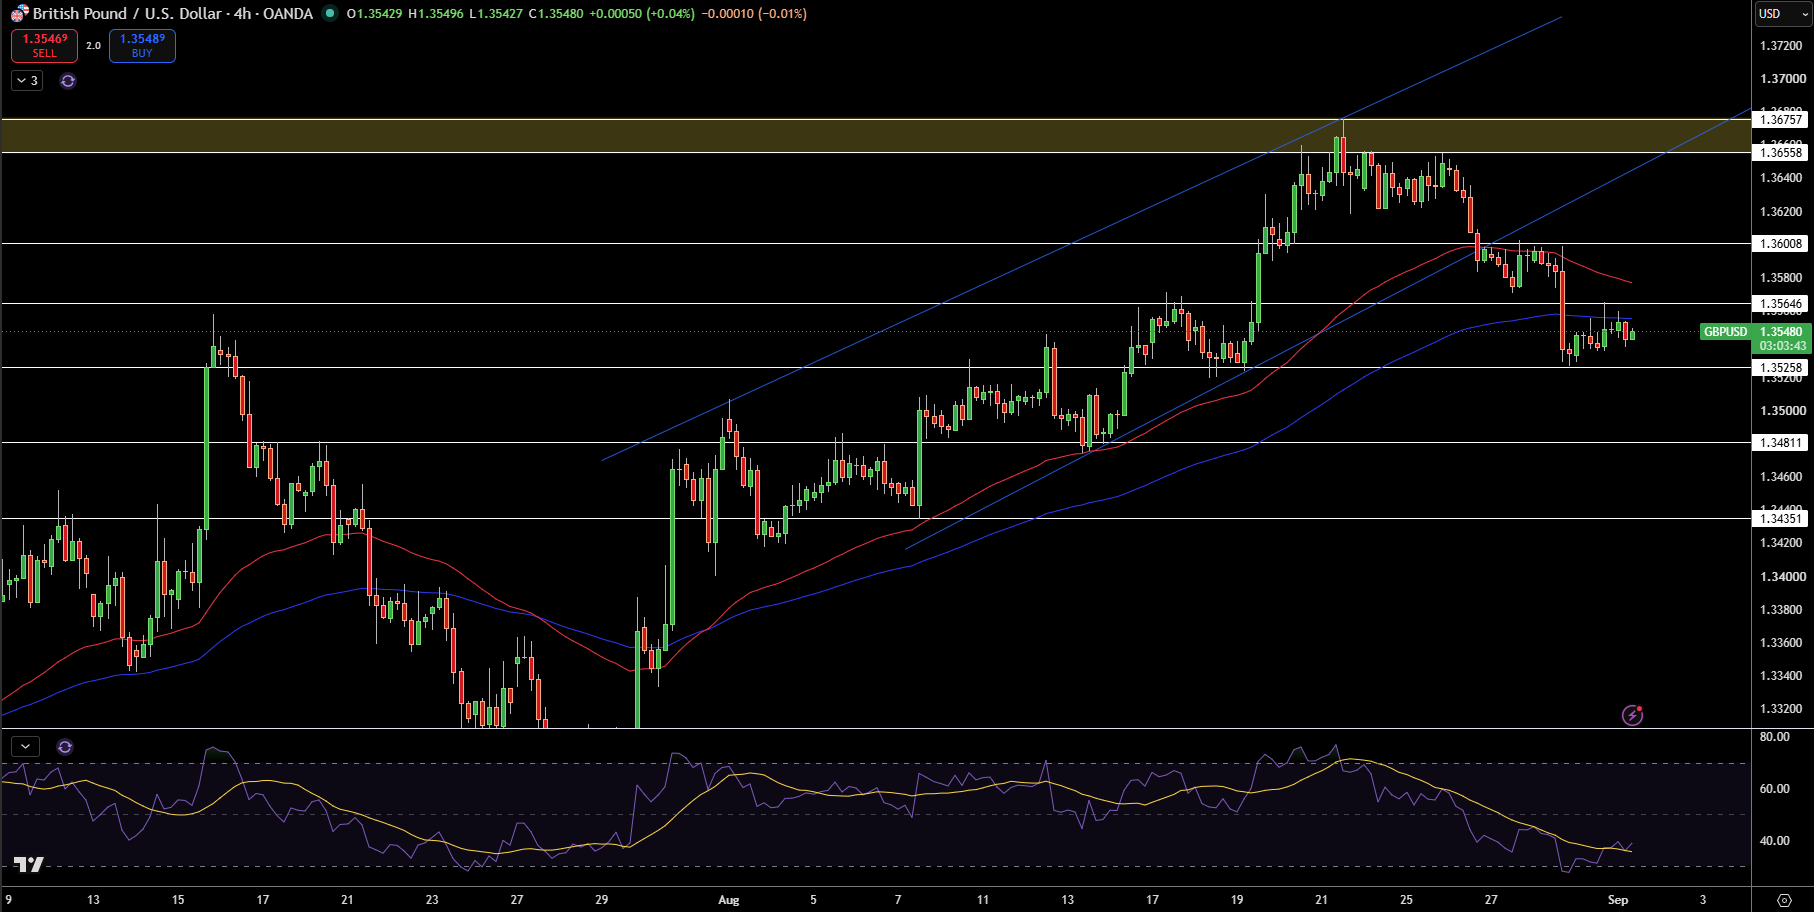
GBP/USD is currently at 1.3548 on the 4 hour chart, having broken below the channel’s lower boundary. Price has found some stability at 1.3526, but is still below the 50 EMA, and just above the 100 EMA, so the section is still weak.
Current resistance is at 1.3565, 1.3601. Beyond that, significant supply is at 1.3656, 1.3676. Support is at 1.3526, 1.3481, 1.3451, 1.3435.
Momentum is weak in the 30-40 range for RSI, which reflects a small decline. GBP/USD is still corrective below 1.3565-1.3601. A break beneath 1.3526 exposes 1.3481. To improve the short term structure, price must move above 1.3601.
EUR/USD Technical Analysis: Euro Rebounds From Trendline but 1.1625 Caps Recovery
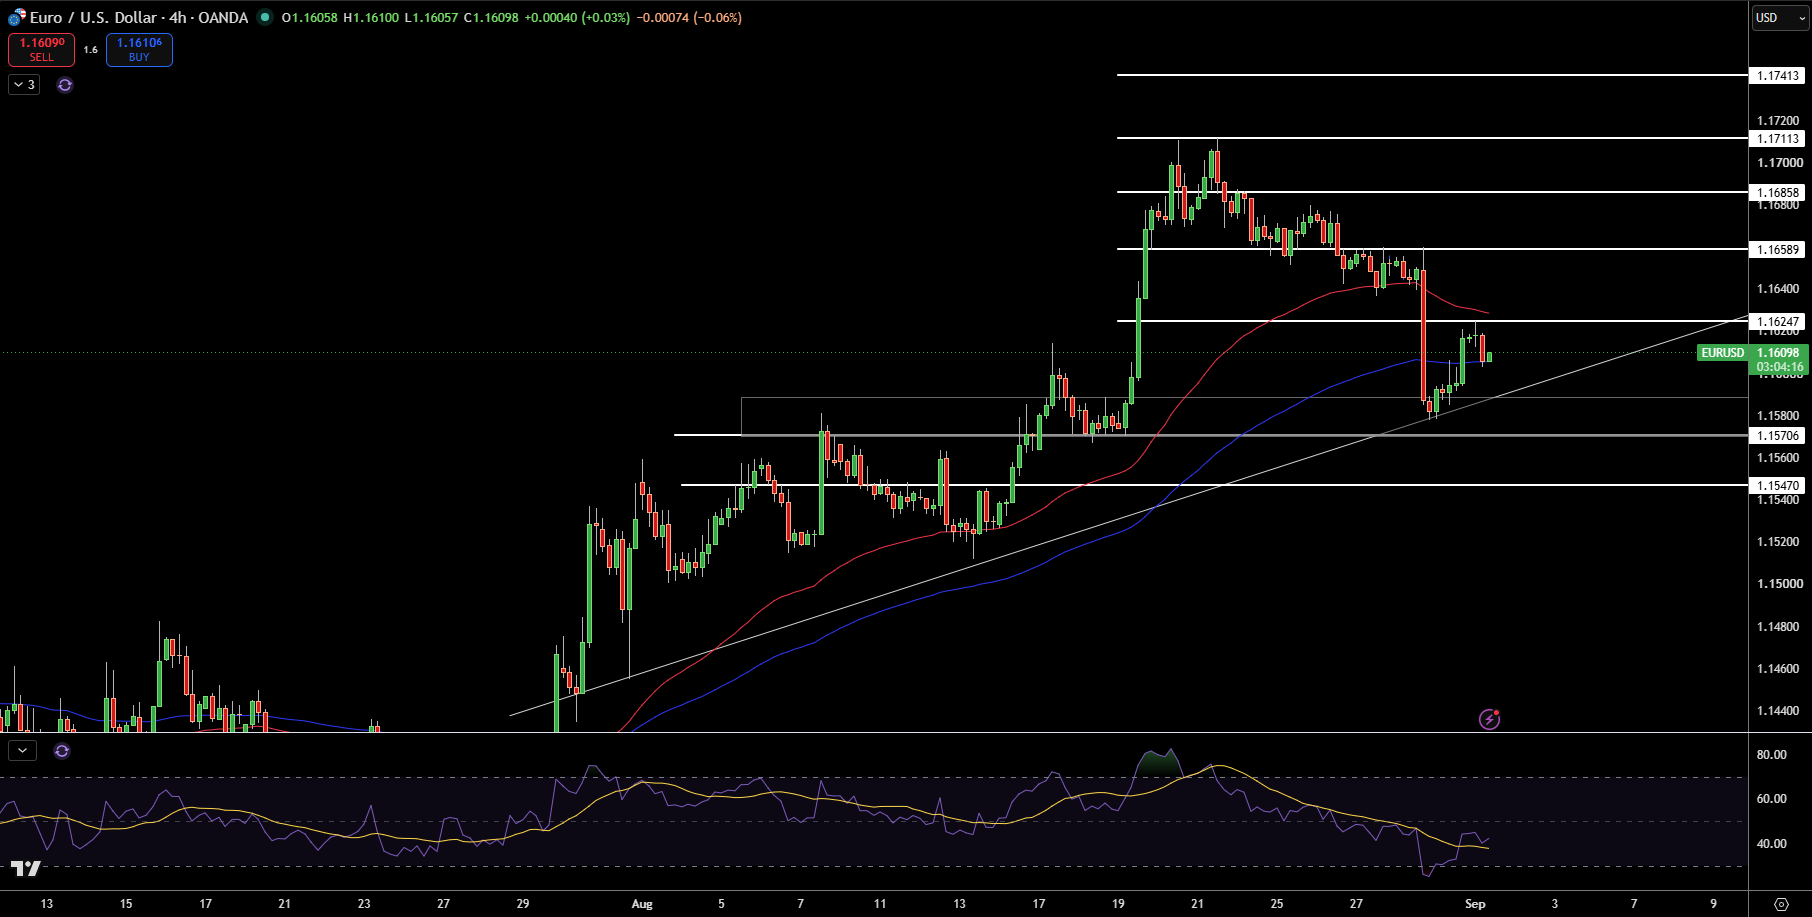
EUR/USD is trading at 1.1610 on the 4 hour chart after rebounding from the rising trendline and the 1.1571 support level. The recovery has been constructive after the recent sharp selloff, but the pair is still trading below the 50 EMA and the 1.1625 resistance level, making the short-term structure cautious.
Immediate resistances are at 1.1625, 1.1659, 1.1686, 1.1711, and 1.1741. However, support remains at 1.1571 then at 1.1547. Below, both a rising trendline and the 100-EMA help to provide support during the pullback.
RSI is recovering from oversold territory. However, it still remains below neutral. So, I do see some limited upside momentum. From my perspective, EUR/USD needs to reclaim 1.1625 in order to provide some sort of positive short-term outlook. Breaking below 1.1625 provides an outlook of continuing to test support at 1.1571. On the other hand, a break above 1.1657 would provide an outlook for a positive recovery.