
US Dollar News: Fed Outlook and Global Data Keep FX Markets on Edge
The U.S. dollar starts the day as traders focus on a series of major U.S. economic announcements that may influence expectations on the Federal Reserve’s future policy. Following the Federal Reserve’s recent announcement to leave their benchmark rate at 3.50% – 3.75%, traders will analyze today’s JOLTS job openings, factory orders, and the ISM Services PMI, followed by the ADP private payrolls and the highly anticipated U.S. Nonfarm Payrolls report.
These upcoming economic releases will provide the first substantial evidence of if the U.S. economic calendar is starting to fade after recent indications of moderation within the U.S. labor market. Kevin Warsh, formerly of the Federal Reserve, said during the week that decisions from the Fed would remain data-dependent. While this has been the case, market participants have discussed if unemployment numbers that do not meet expectations may help alter the Fed’s policy for this year. Reuters also noted the sensitivity of Treasury yields and the dollar to what the Fed calls “macro data.”
The euro has support after last week’s announcement from the European Central Bank. They stated that they would leave their deposit rate at 2.25%, and that they would continue their cautious, meeting-by-meeting approach. Traders have their eyes on euro zone retail sales and Germany’s factory orders to signal the first signs of stabilization of domestic demand, all while ECB policymakers still insist that inflation is close to their 2% target.
Sterling still reflects last week’s Bank of England decision to leave the coin at 3.75%. This week’s UK services PMI, labor market, and activity data will show market participants what the British economy looks like as policymakers decide how to balance economic growth that is slowing with the danger of inflation continuing.

US Dollar Index (DXY) Technical Analysis: Trendline Holds as Bulls Fight to Reclaim 100.45
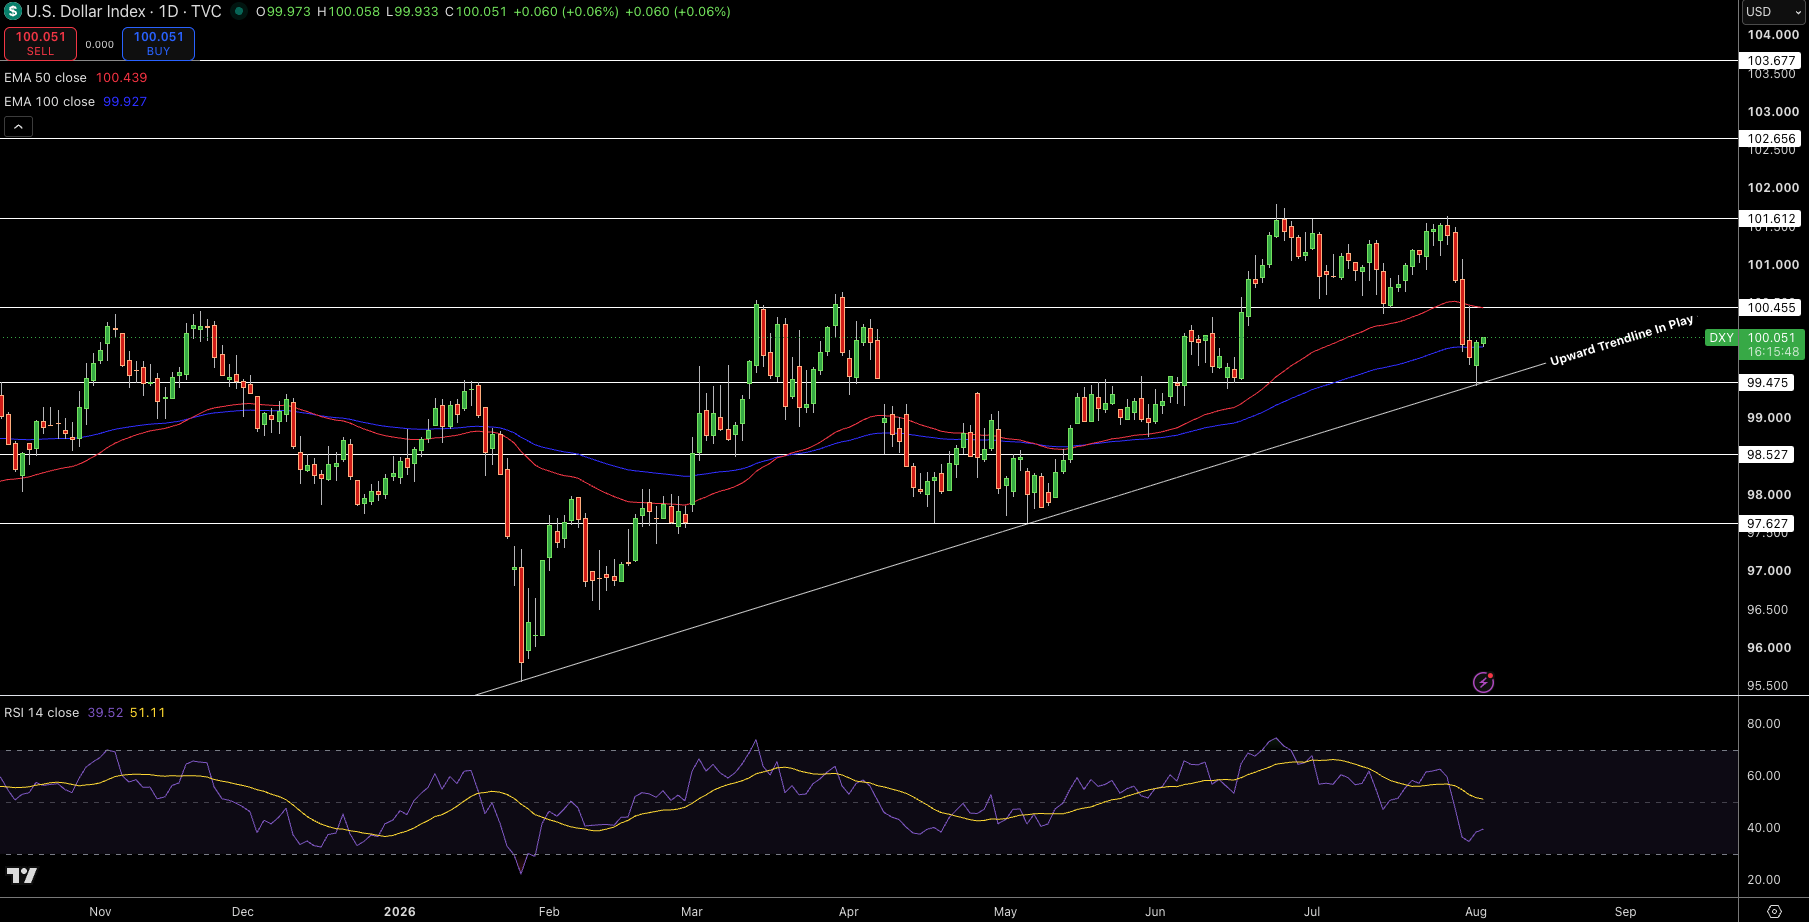
The US Dollar Index (DXY) is trading at 100.05. After last week’s steep drop, this confirms efforts to reestablish a trading range. From the daily chart, the DXY has found support from a long-term ascending trendline that has guided price action since February. DXY buyers have defended the 99.48 horizontal support and prevented price action from weakening even further.
Current price action balances the 100 day EMA at 99.93 with the 50 day EMA at 100.44. A sustained upside break from the current trading range at 100.45 supports a bullish trend and targets 101.61, subsequently 102.66. Outside of the 50 day EMA, price action has not confirmed the trend resurgence. The support of the trendline would guide price action to defend 99.48 and subsequently 98.53.
Momentum indicators have yet to confirm the strength of the bullish trend. The RSI has recovered from oversold levels, but remains below the neutral 50 level confirming the bullish reversal has not yet been confirmed. The strength of the bullish trend will be confirmed with a daily close above 100.45. Until then major resistance levels reside around 100.45 to support 101.61, 102.66, and 99.48 to 98.53.
Current bias remains neutral, but is leaning bullish as long as price action holds above 99.48. Confirmation of the bullish trend will be confirmed with a move above.
EUR/USD Price Forecast
Every new EUR/USD analysis as it publishes, today's technical signal and key levels, live price — on one page.
See all EUR/USD forecastsGBP/USD Technical Analysis: Pound Consolidates Below Trendline Resistance
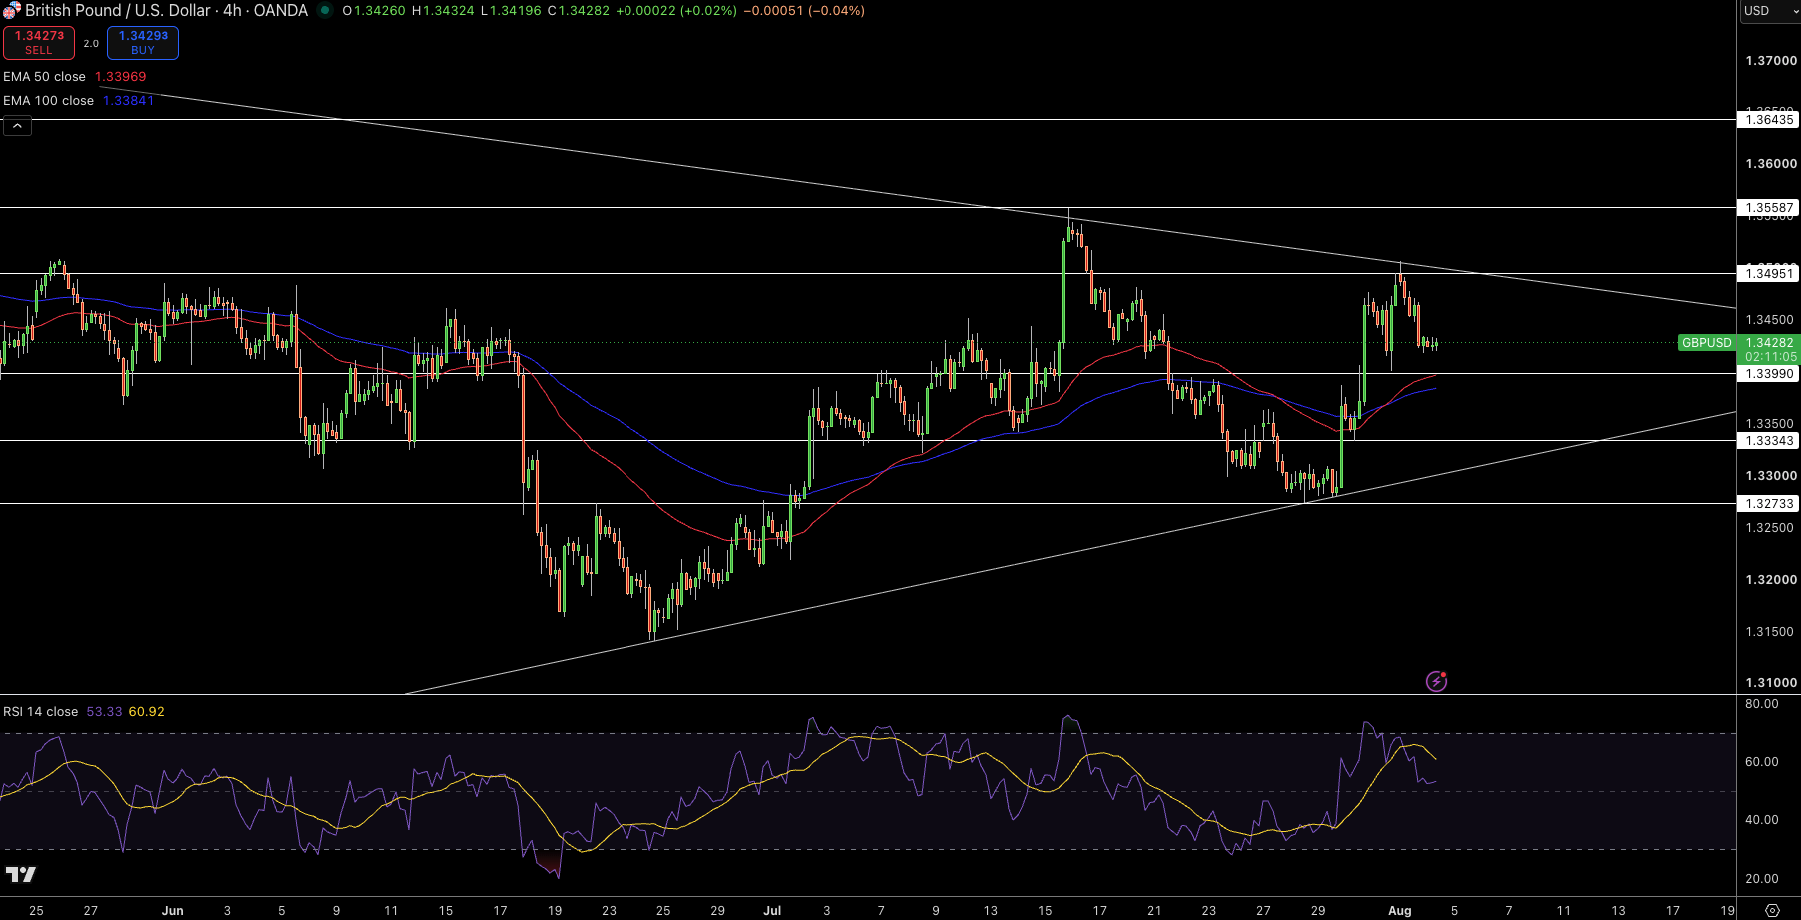
GBP/USD is currently 1.3428. It consolidated following a strong rally from the 1.3273 trendline support. As of now, the pair is above both the 50-EMA (1.3397) and 100-EMA (1.3384) which has been the case recently, which has
The current challenge is at 1.3495. At that level, the long-term descending trendline meets equivalent horizontal resistance. If the price can settle and close above this level, the bullish outlook will improve and confirm a target of 1.3559. Possible price declines if this level fails to hold will have a stop at 1.3399 with the next major goal at 1.3334. The upward trendline at 1.3273 is the most significant downside support as the upward trend is still valid in the larger time frame.
Rising from oversold conditions, the RSI has moved down to the 53 level and has not signaled a bearish condition, as some might expect. While the moving averages keep the practices friendly, a break above the 1.3495 level is needed to identify the next bullish target.
EUR/USD Technical Analysis: Bullish Breakout Faces Trendline Test Near 1.1550
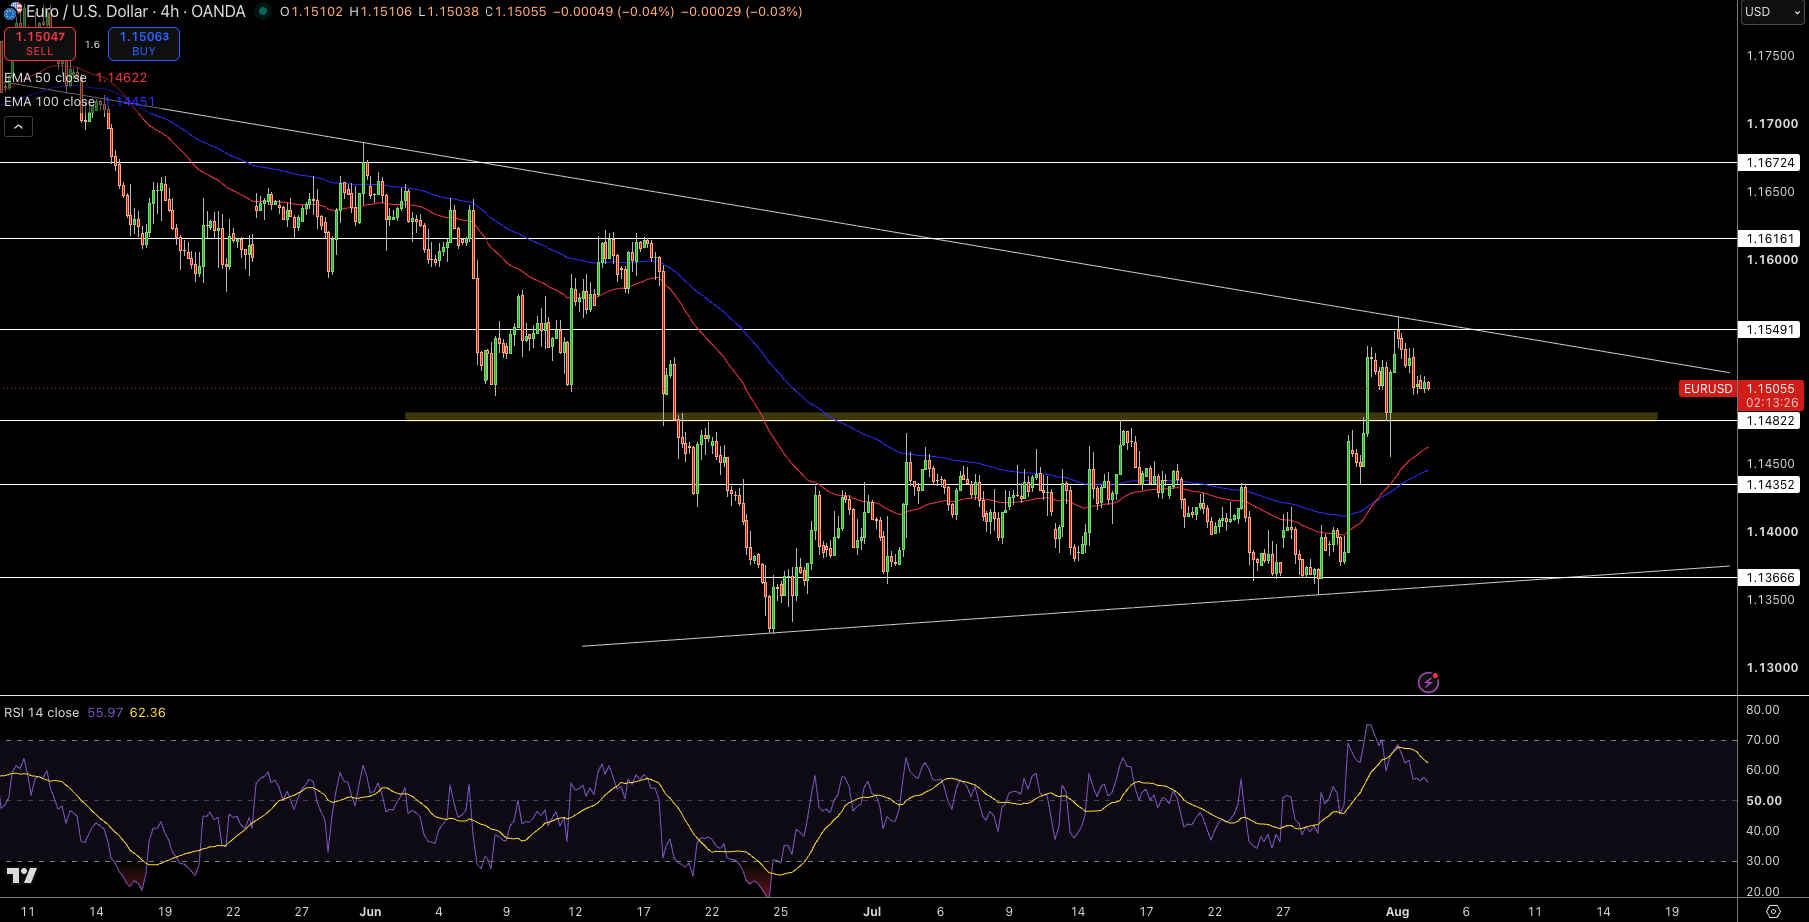
EUR/USD is currently about 1.1505. It has maintained above the breakout zone at 1.1482 which also acted as a strong support during the recent rally from the July lows. The pair has been comfortably above the 50-EMA (1.1462) and 100-EMA (1.1445) for some time now, and as such, the momentum has favored buyers.
The pair has now reached the descending trendline from May which has acted as resistance for the recent rallies, with the immediate resistance currently at 1.1549 and where the trendline meets the resistance. A break above would show a larger bullish reversal, and 1.1616 and 1.1672 would come into play. If 1.1482 is breached however, we see strong support, and we should then expect a fall to 1.1435.
RSI has cooled to 56 from 100, which indicates that while bullish momentum is still present, it is not as strong. So long as EUR/USD stays above 1.1482, bullish momentum remains, with traders focused on the potential for a break of the long term descending trendline.