
US Dollar News: Warsh Takes Center Stage as ECB Stays Hawkish
With investors waiting for Kevin Warsh’s first speech at the Jackson Hole symposium on August 28, the US dollar is approaching a one-week high. Despite the sticky July PCE inflation at 3.7% and 3.3%, respectively, the markets are concerned with the Fed’s potential for continued tightening. Futures show that there is a 35% chance that the Fed will act by September with that number going up toward 75% when focusing on December. Warsh’s lack of traditional forward guidance has added uncertainty.
The euro has a firmer policy backdrop. The minutes of the July meeting for the ECB showed that the policymakers believed that another interest rate increase was likely, with a potential move from 2.25% to 2.50% in September, failing to show material progress on inflation. The inflation number remains around the 3% mark, while growth in corporate lending for the month of July was at 4.4%, and the economy is projected to be resilient enough for policymakers to further tighten monetary policy.
Sterling faces a less hawkish domestic policy. With only a 15% chance of a Bank of England rate increase in September, and a full quarter-point increase not expected until around February 2027, a less hawkish view has been taken in the market. Further tightening of monetary policy is unlikely, considering rising inflation in July, which was at 2.9%, combined with softness in the labor market.
For August 28, the central FX theme is clear: The dollar awaits Warsh’s inflation speech, while the EUR foresees credible September ECB tightening. GBP is held down by weaker BoE expectations despite elevated CPI.

U.S. Dollar Index Technical Analysis: DXY Tests 99.25 Pivot as Descending Trendline Caps Recovery
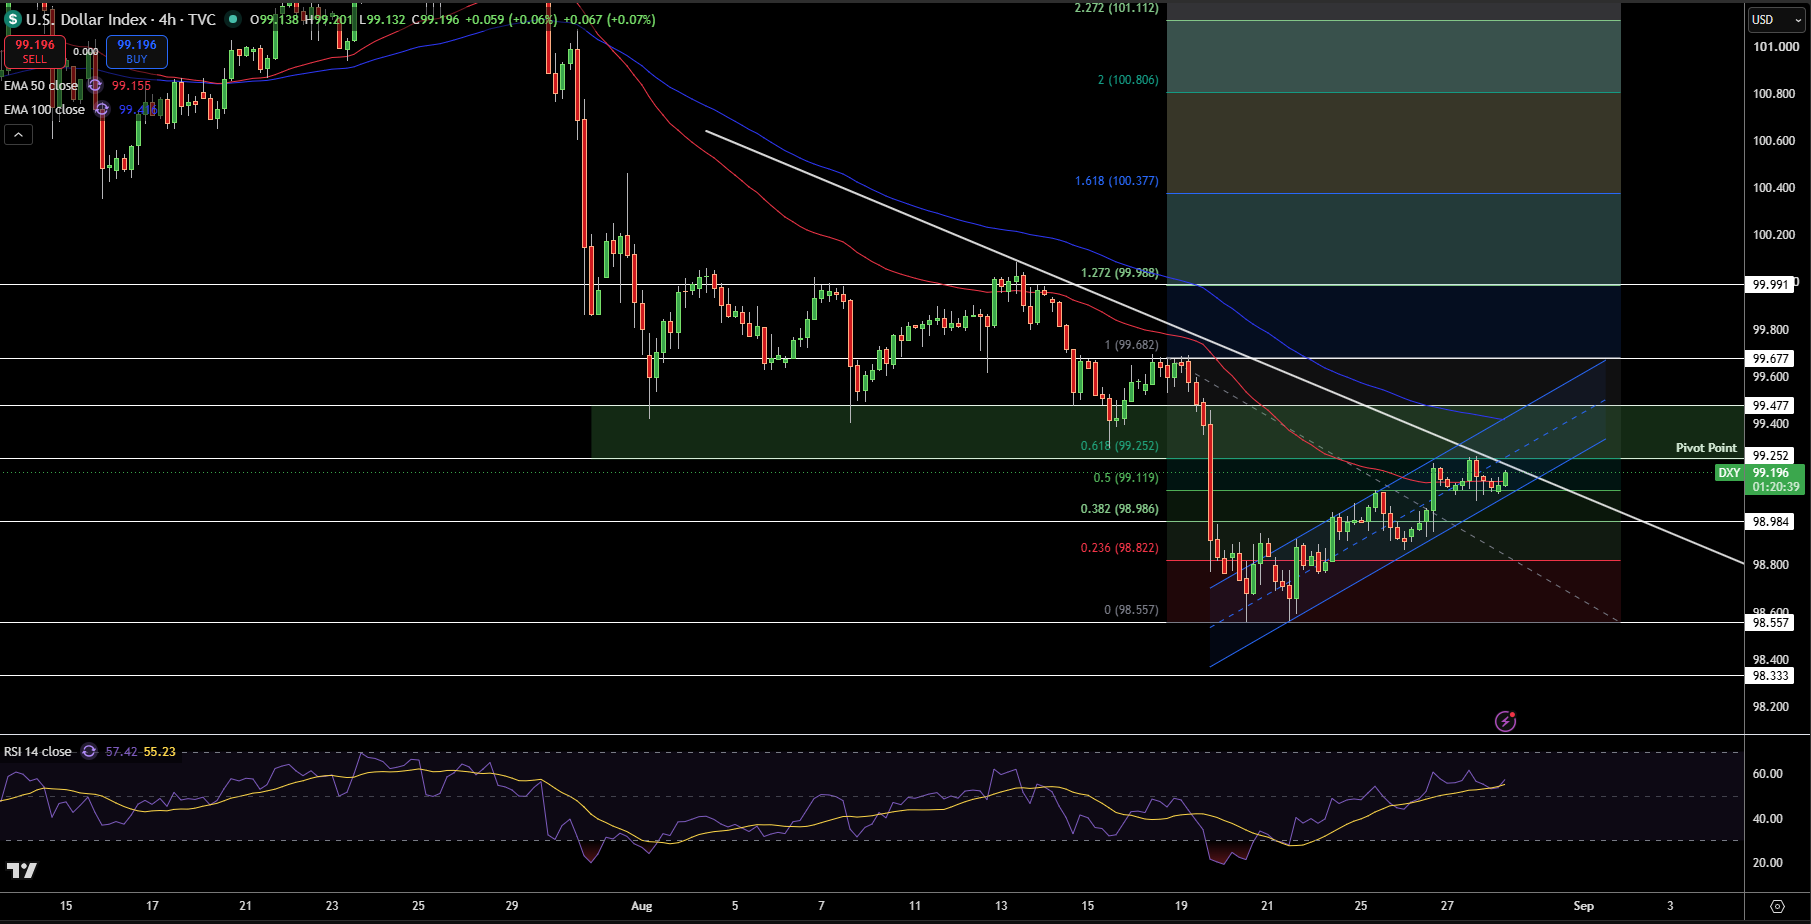
The U.S. Dollar Index has almost reached 99.20 on the 4-hour chart as it has recovered from the 98.56 low and gone back above the 50-EMA, which is at 99.16, although the price is still below the 100-EMA and is still below the descending trendline, so the bullish structure on a short-term basis is still not fully in play.
The 99.25 pivot level is an important zone. This is close to the 61.8% Fibonacci level and is at 99.25. If this level is broken and successfully held above it, then the extension of the bullish structure would bring the price to at least 99.48, where it would then extend to 99.68 and 99.99. The next significant level would be 100.38, beyond which there is a clear price extension. If the price is not able to hold above this level, then 99.12 and 98.99, 98.82 and 98.56 would be the next support levels.
The RSI at this point is at 57 and is showing a bullish bias for the recovery and price structure. In my opinion, this is a critical level for the U.S. Dollar Index from a price structure point of view. A confirmed break above 99.25 and the descending trendline would suggest that a bullish structure is more likely, and a move back toward 98.99 to 98.82, with price extending below the trendline is likely.
EUR/USD Price Forecast
Every new EUR/USD analysis as it publishes, today's technical signal and key levels, live price — on one page.
See all EUR/USD forecastsGBP/USD Technical Analysis: Pound Breaks Channel Support as 1.3565 Becomes Critical
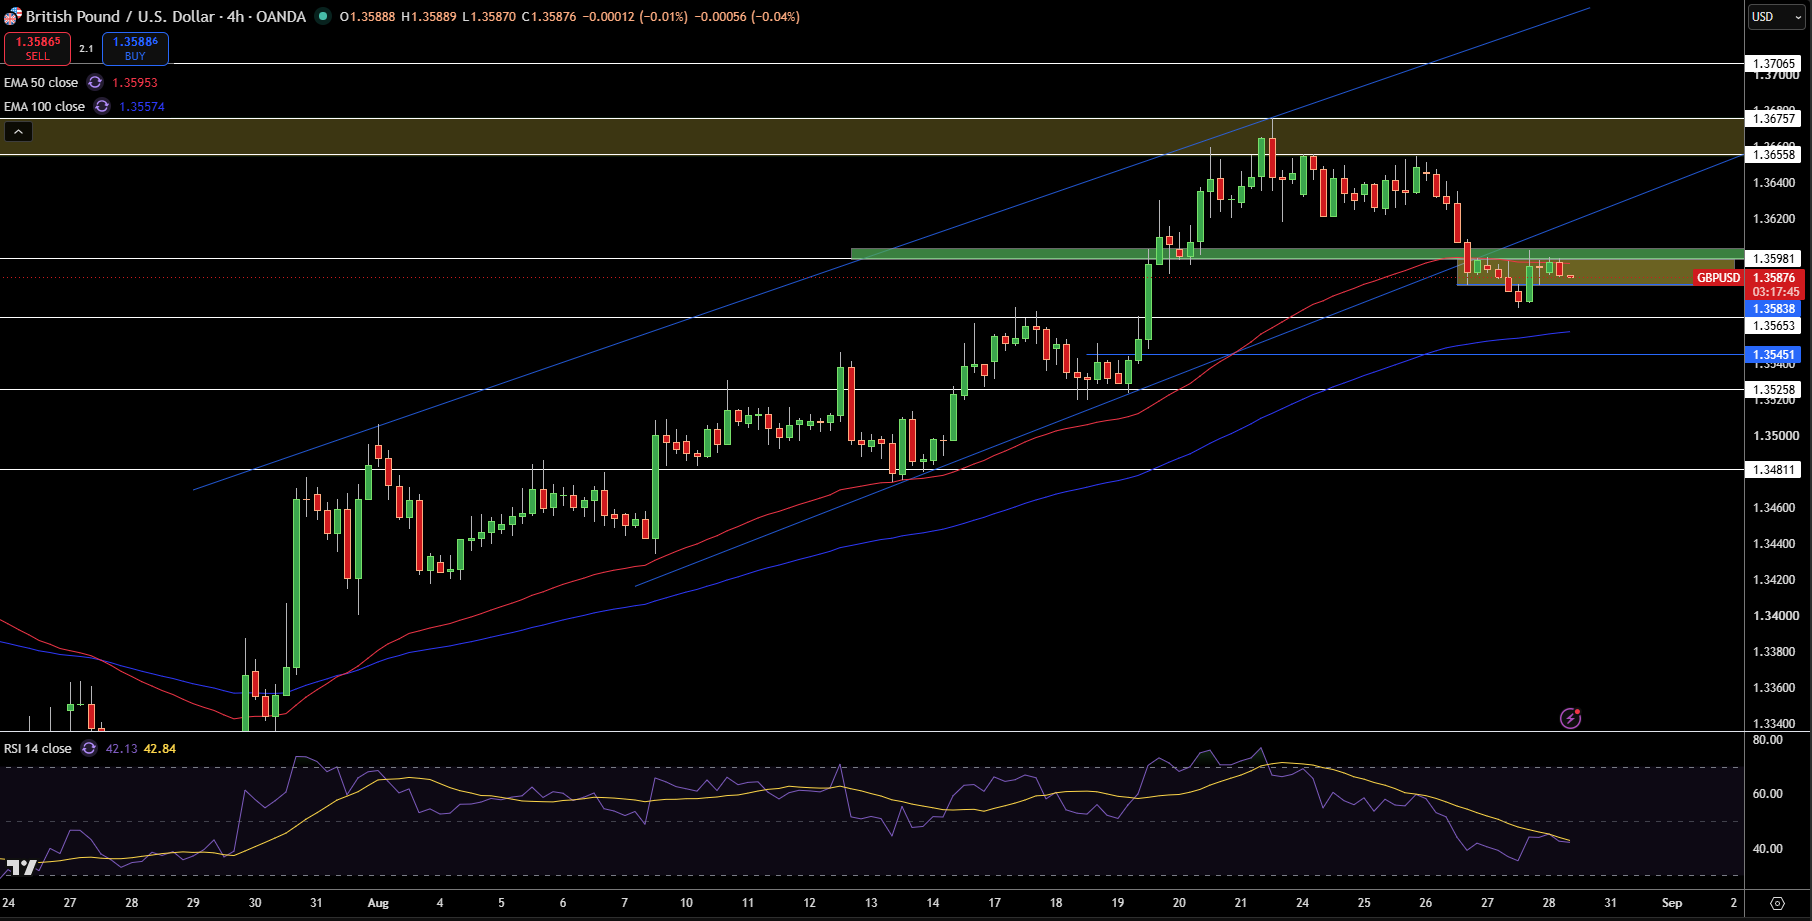
Currently, GBP/USD is trading at 1.3588 on the 4 hour chart, with a break of the lower trend line of a recently formed channel. GBP/USD is also trading below the 50 EMA at 1.3595 and the 100 EMA at 1.3557 which is currently providing support.
Resistance is first at 1.3598-1.3600, and was previously support. Beyond that, we have 1.3656 – 1.3676 as our next major zone of resistance. On the downside, we have support at 1.3565, and below that at 1.3545, 1.3526 and 1.3481.
RSI is moving above 40 which shows some weak momentum, but not oversold. I believe the channel break has forced a corrective phase in GBP/USD. Should price move above 1.3598-1.3600, this would be a positive update. Failing to move above this level should continue the pressure on 1.3565.A break of 1.3565 would target the next levels of 1.3545-1.3526.
EUR/USD Technical Analysis: Euro Slips Below 1.1658 as 50% Fib Support Comes Under Pressure
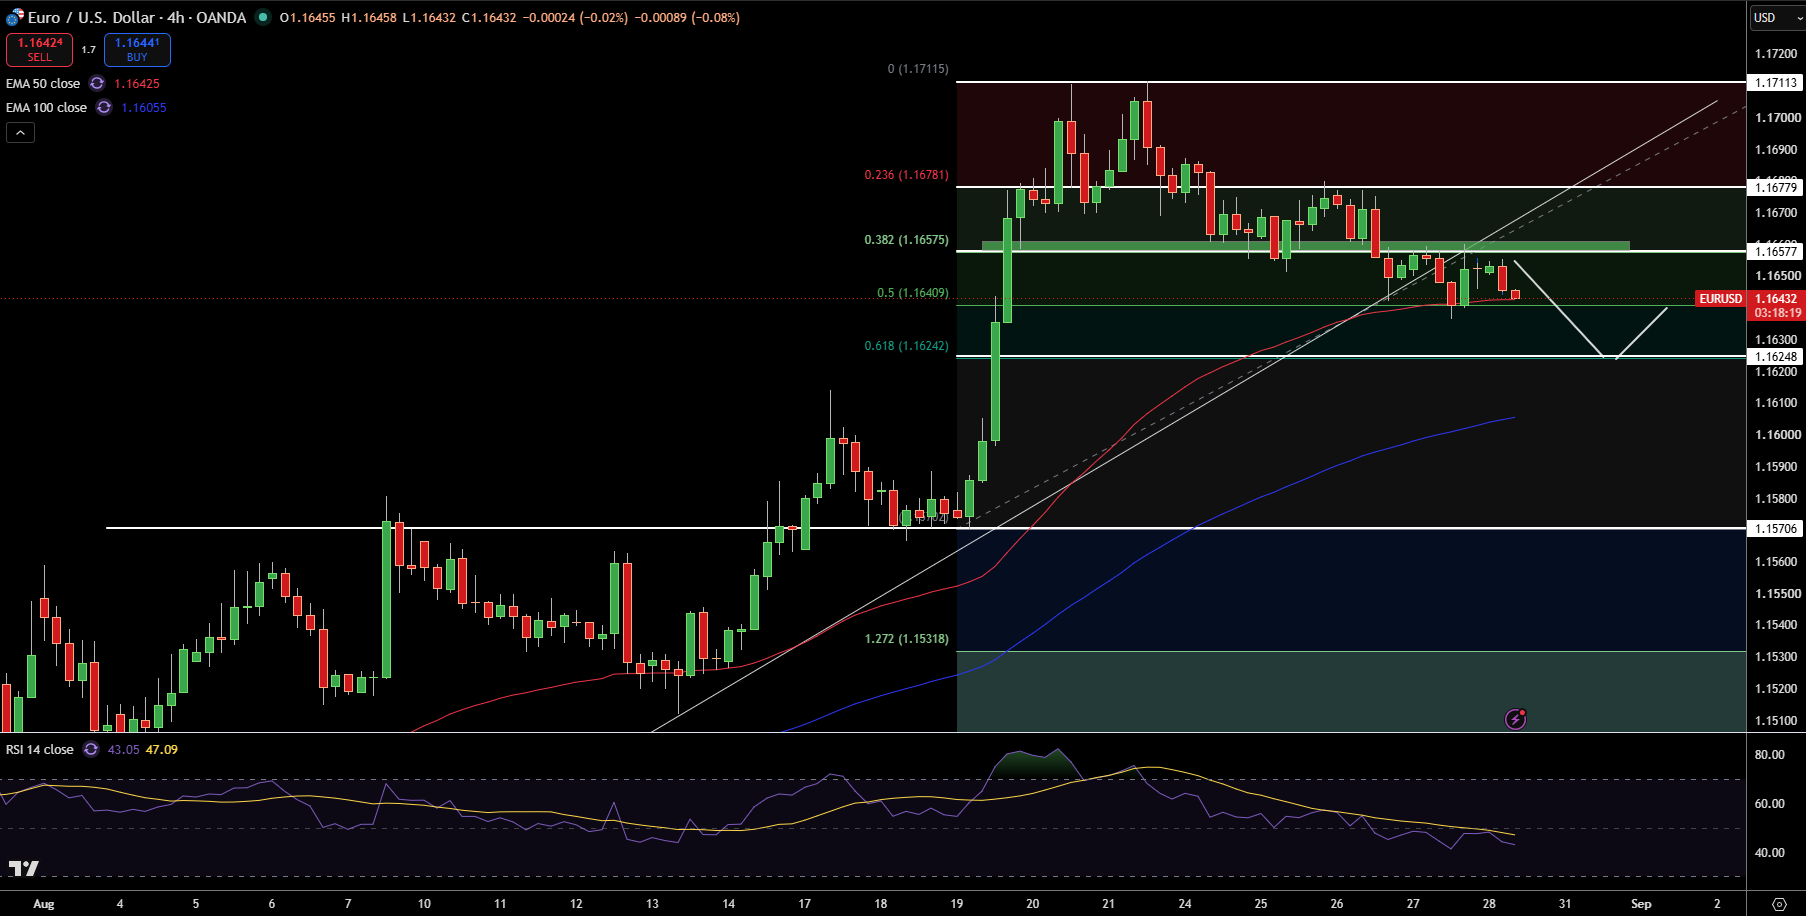
The EUR/USD pair is at 1.1643 on a 4 hour chart after correcting from 1.1711. Price has fallen below the 38.2% Fibonacci level at 1.1658 and is approaching the 50% fib at 1.1641, as well as the 50-EMA at 1.1643. The 100 EMA is at 1.1606, so there isn’t a big downward trend just yet.
Price action is also showing a Reversal Selling Indicator (RSI) at 43, showing that price has lost momentum and sellers have the upper hand. Potential support levels are found at 1.1641, 1.1624, and the rising trendline. A break of 1.1624 would represent a good opportunity to sell and a fall toward 1.1606 and 1.1571 would be possible. Resistance levels would, of course, shift to the upside.
From my point of view, EUR/USD is in a potentially dangerous corrective phase. 1.1624 and 1.1641 would be safe support levels for more bullish traders, but a move below 1.1624 would be a clear sell signal for me.