
US Dollar News: Warsh and PCE Take Center Stage as Euro Holds Firm
With Fed Chair Kevin Warsh’s first Jackson Hole speech and the release of the PCE inflation report later this week, the U.S. dollar commences trading on August 25. Stronger U.S. sanctions against Iran provided the dollar with minor support as foreign companies, making a deal with Iran, could lose access to the U.S. financial system, thus increasing the demand for the dollar. Conversely an aggressive plan of the Treasury to buy back long-maturity bonds to control long-term borrowing costs has increased concern about the fiscal credibility of the U.S. dollar. The 10-year Treasury yields around 4.7% and investors are still struggling to reconcile how concerns around stress in bonds could limit further rate hikes by the Fed.
The euro has a firm monetary policy setting. The composite PMI in the Eurozone grew to 52.1 in August, the highest level since November. The manufacturing PMI also hit a 54-month high and orders, both new and incoming, grew at the fastest pace in more than three years. Unemployment also hit a positive level for the year. Most investors still expect the ECB to raise the deposit rate from 2.25%, however, slowing inflation may keep rate hikes less aggressive this cycle.
Since at least one more Bank of England increase is expected this year, Sterling is expected to remain firm, UK inflation reaching 2.9% in July. While the case for more aggressive tightening may be limited by softer data in the labor market and spending in retail, recent strength in the pound reflects dollar weakness.
For August 25, the dominant theme in currency markets is expected to be policy uncertainty in Washington compared with more clearly defined rate expectations in Europe and Britain. After Jackson Hole, the next major influence on currency markets will be the release of the PCE inflation data.

U.S. Dollar Index Technical Analysis: DXY Rebounds From $98.55 but Remains Below Key Trend Resistance
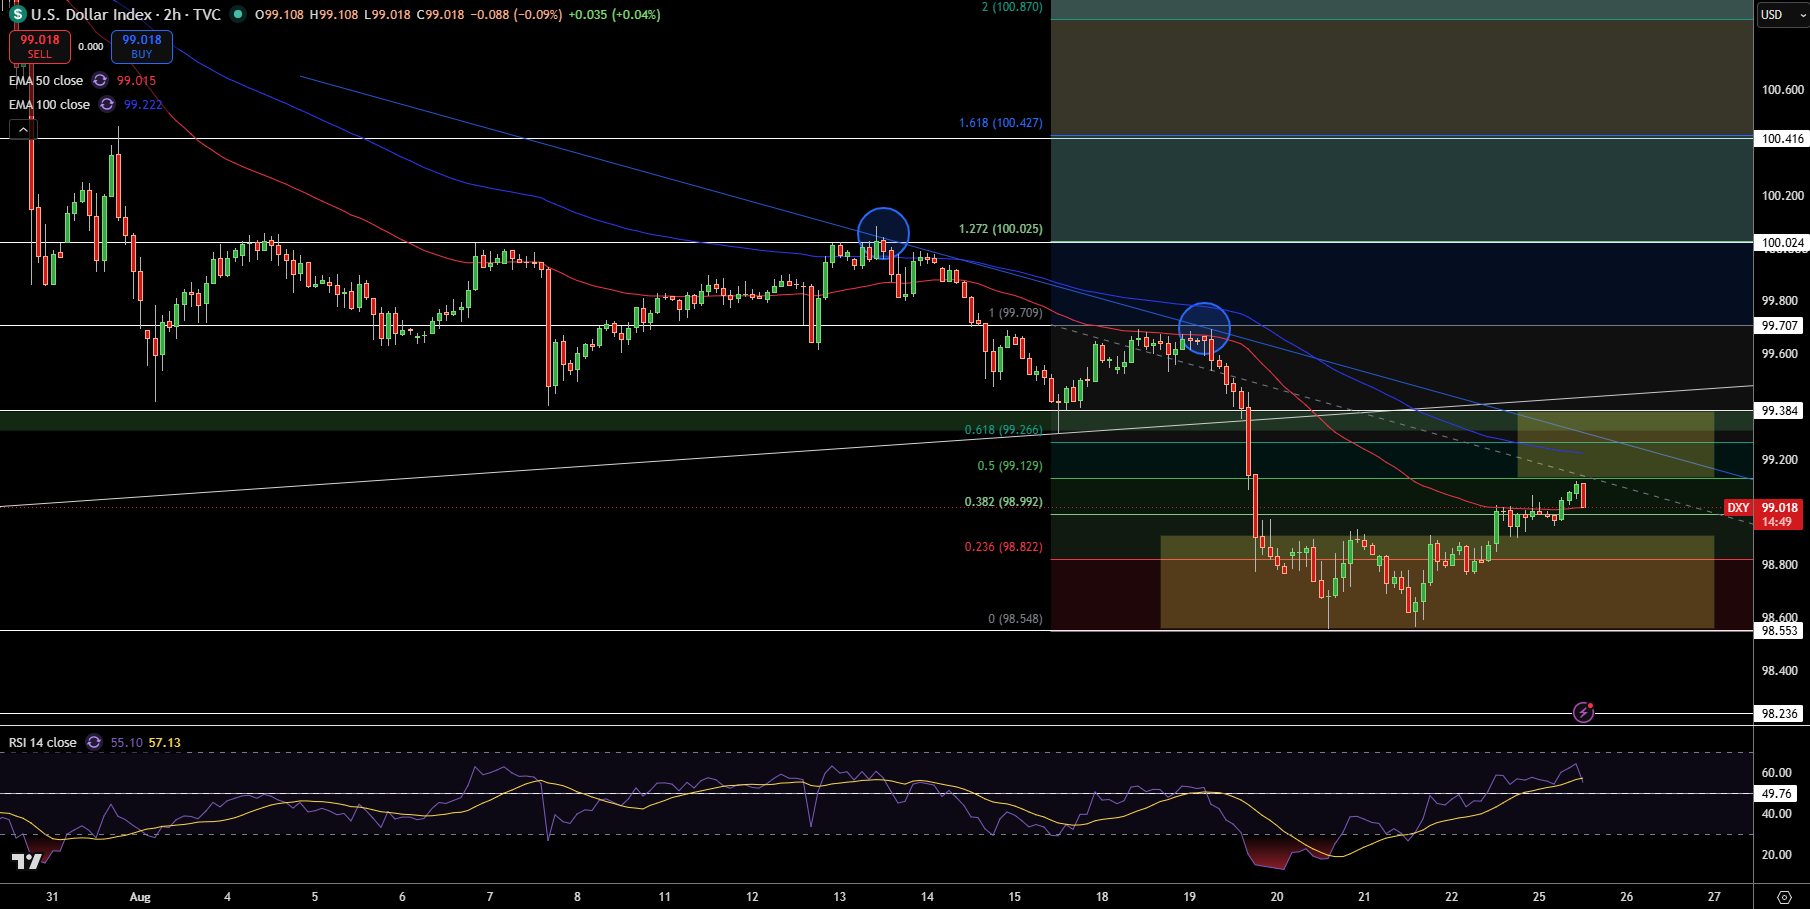
Currently, the U.S. Dollar Index is at $99.02, up slightly from $98.55 on the 2-hour chart. While the rebound gives some short-term momentum to the DXY, it still sits below both the 100-EMA at $99.22 and the 50-EMA at $99.02, with an overall downtrend remaining intact. Until this changes, the structure will continue to be bearish.
RSI also shows the short term rebound and is currently at 55, which shows a recovery from oversold conditions and a move back above the neutral 50 level. There is resistance at $99.13 and $99.27, and even further at $99.38 and $99.71. If buying pressure pushes the price above these, $100.03 and $100.42 will be the next targets. In the event downward pressure remains at $98.99, $98.82, and $98.55, there is still downside.
In my opinion, the DXY is still under pressure unless a break of the $99.38 level is made. A break of this resistance zone could be the catalyst to push to $98.82, $98.55. In the event an upward break is made from the $99.13 – $99.38 resistance zone, it would be very bullish.
EUR/USD Price Forecast
Every new EUR/USD analysis as it publishes, today's technical signal and key levels, live price — on one page.
See all EUR/USD forecastsGBP/USD Technical Analysis: Pound Consolidates Above $1.3618 With $1.3656 Resistance in Focus
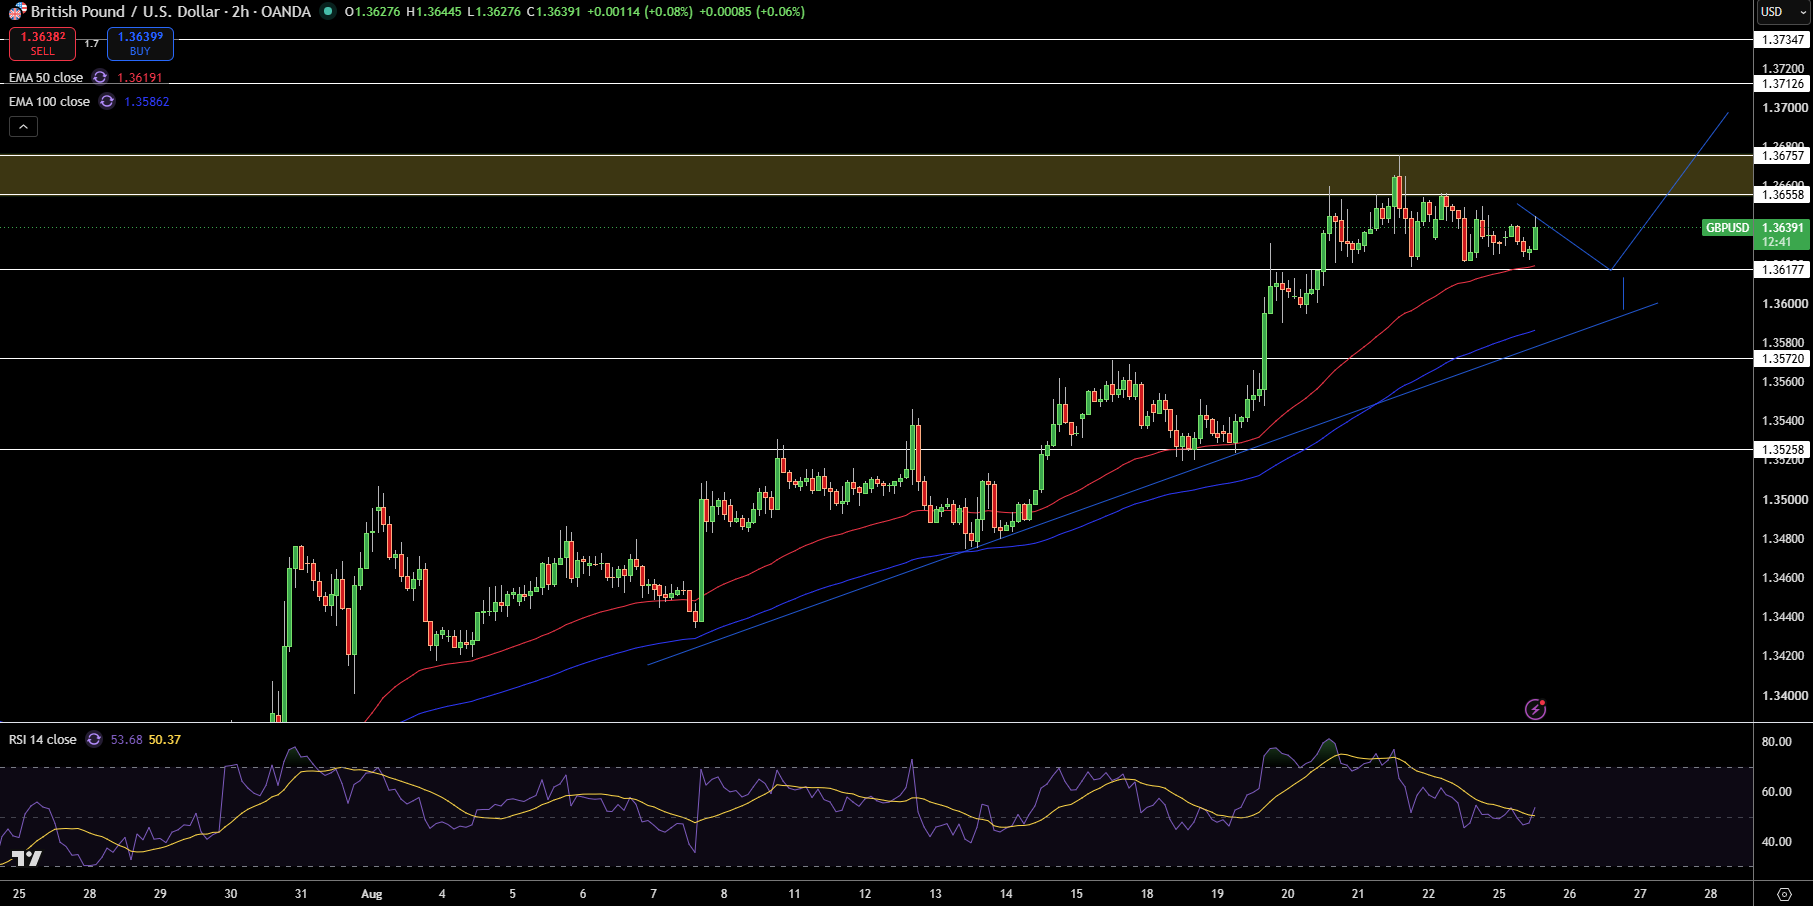
GBP/USD is currently trading around $1.3639 and consolidated within the resistance zone of $1.3656 to $1.3676 on the 2-hour chart. Price is above the 50-EMA at $1.3619 and is above the 100-EMA at $1.3586, suggesting a bullish trend for the short term. The price action is odely a shallow descending consolidation after a strong rally, which suggests the consolidation may continue to the upside as long as the near support remains.
RSI is around 54 which suggests neutral to positive momentum and suggests that price may continue to increase. Resistance can be found at $1.3656 and can be followed by $1.3676, $1.3713, and $1.3735. Support can be found at $1.3618, and can be followed by $1.3572 and $1.3526.
In my opinion, GBP/USD is bullish as long as price is above $1.3618. A break above the resistance zone of $1.3656 to $1.3676 can lead to a move toward $1.3713. A break below $1.3618 can lead to a move toward $1.3572.
EUR/USD Technical Analysis: Euro Holds $1.1658 Support After Double-Top Rejection
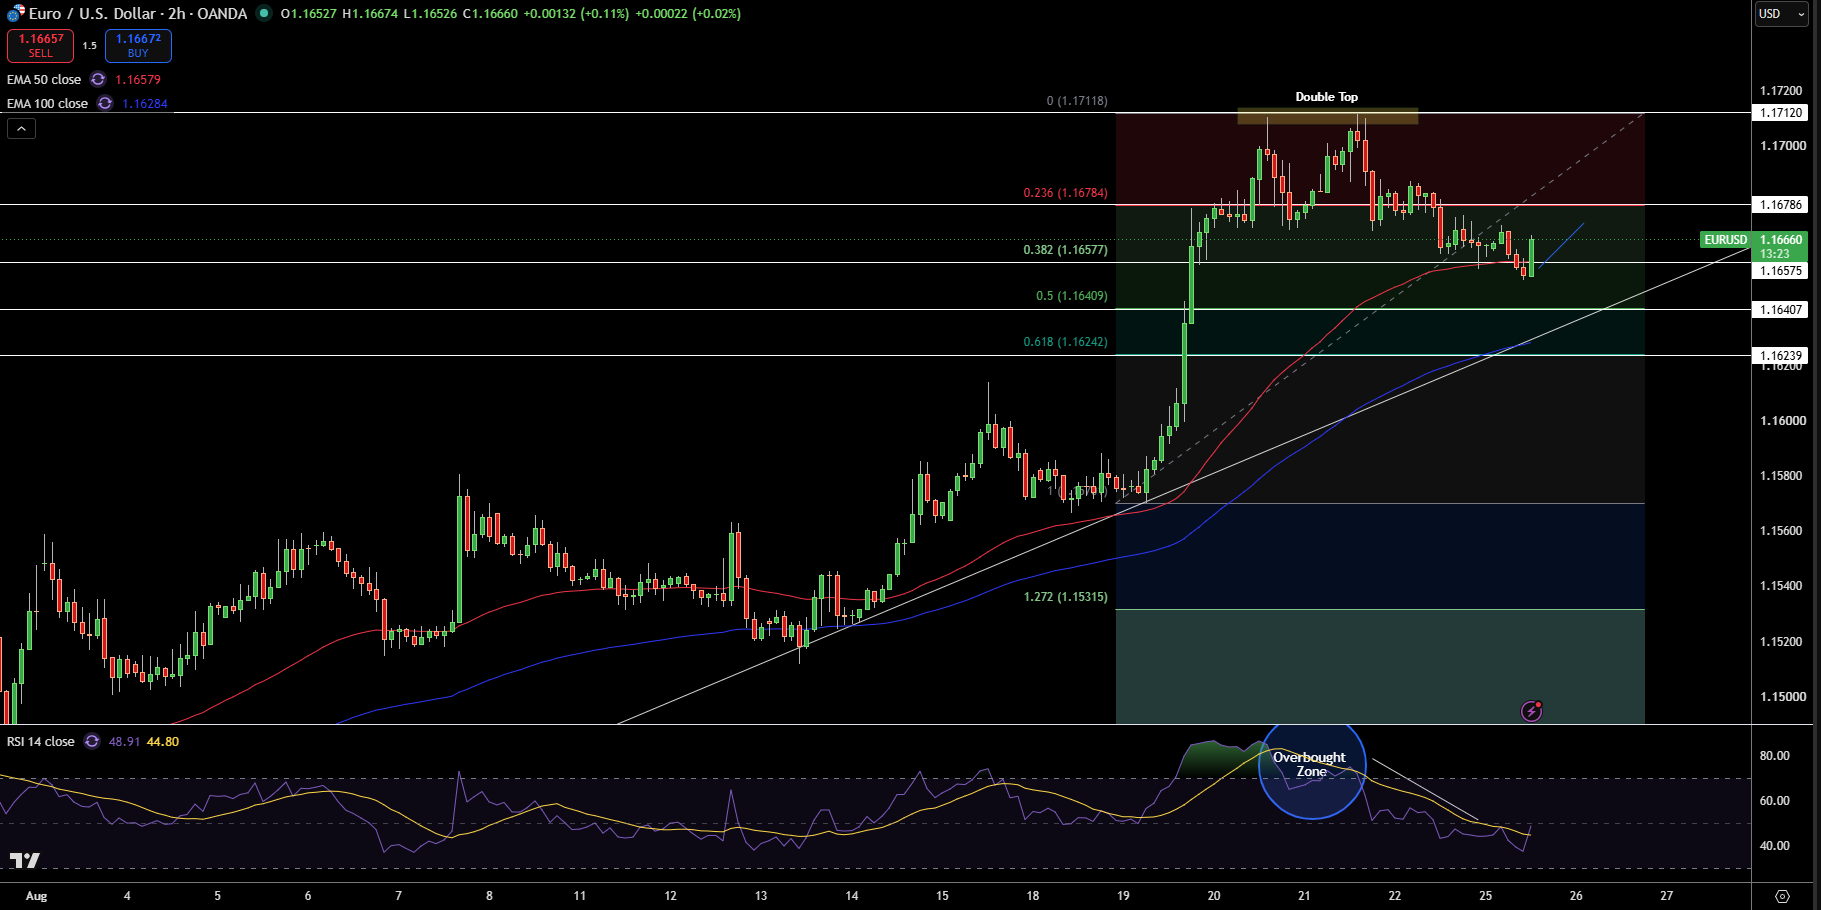
EUR/USD currently resides at $1.1666 on the 2-hour chart after correcting from the double top at $1.1712. Price is now testing an important support area around the 38.2% Fibonacci retracement at $1.1658, and $1.1658 also the 50-EMA. The 100-EMA at $1.1628 is below price, and thus still in an overall uptrend.
RSI has eased to around the 49 level. This shows that the earlier overbought conditions have been completely unwound. Immediate resistance is located at $1.1678 followed by $1.1712 and $1.1737. On the downside, support is located at $1.1658, $1.1641, $1.1624 and the rising trend line.
Considering the currently existing price action and trends, I believe that EUR/USD is still bullish as long as the price action stays above $1.1641 and $1.1658. Breaking through $1.1678 would result in $1.1712 coming back into play while dropping below $1.1641 could lead to a deeper correction toward $1.1624.