NASDAQ 100
The NASDAQ 100 has shown itself to be somewhat choppy, but at this point in time, it looks like it is stabilizing. That’s a good sign. Rates are starting to drop a little bit in the early part of pre-market trading, so we’ll see whether or not there’s a bounce here.

The 50-Day EMA
Despite the fact that there was a pretty ugly candlestick during the previous session, I still look at this as a bullish market, and sooner or later, one will expect to see technical traders pay close attention to the 50-day EMA. It has historically been important in this market multiple times. The 30,000 level above being resistant is not a huge surprise; that’s been a problem for a while now.
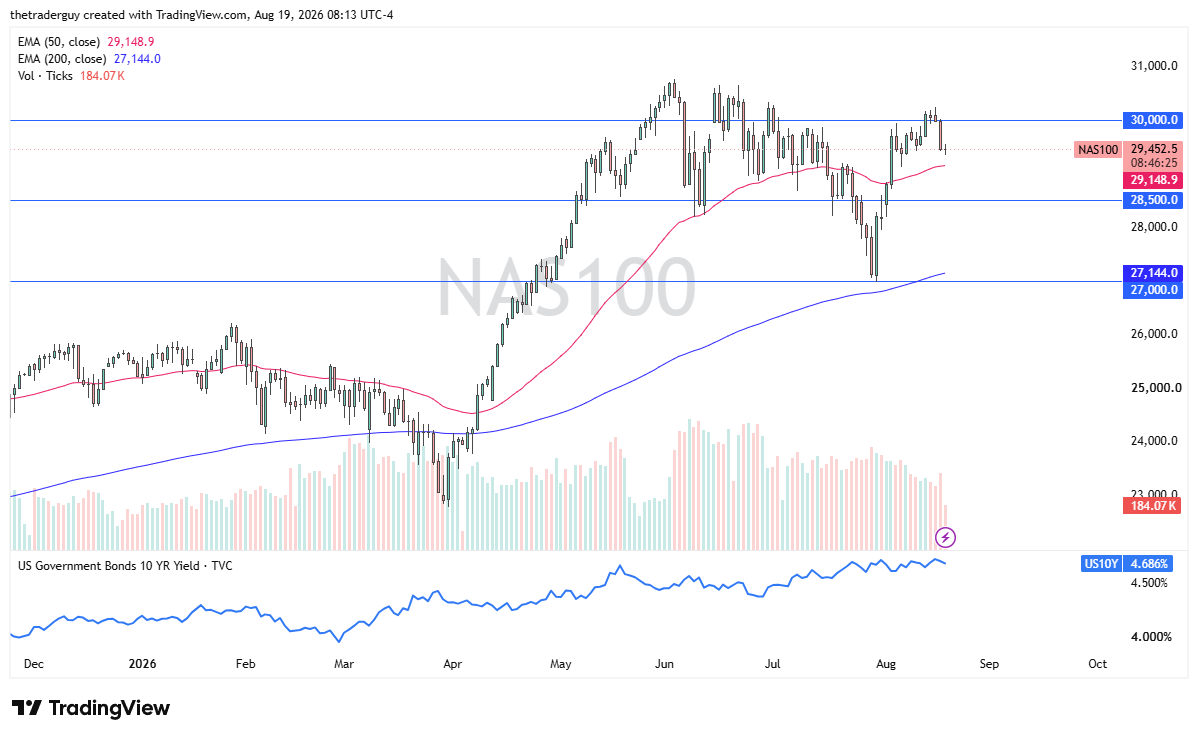
NASDAQ 100 daily chart shows stabilization near moving-average support below 30,000 resistance. Source: TradingView.
Dow Jones 30
The Dow Jones 30 looks pretty quiet during pre-market trading. Perhaps the slow grind higher is starting to run out of steam; we’ll just have to wait and see. The 53,000 level just below is a previous point of resistance; perhaps market memory could open up the idea of support. Interest rates curling down a little bit early during the session could help as well. We’re still very much in an uptrend here.
NASDAQ 100 Price Forecast
Every new NASDAQ 100 analysis as it publishes, today's technical signal and key levels, live price — on one page.
See all NASDAQ 100 forecasts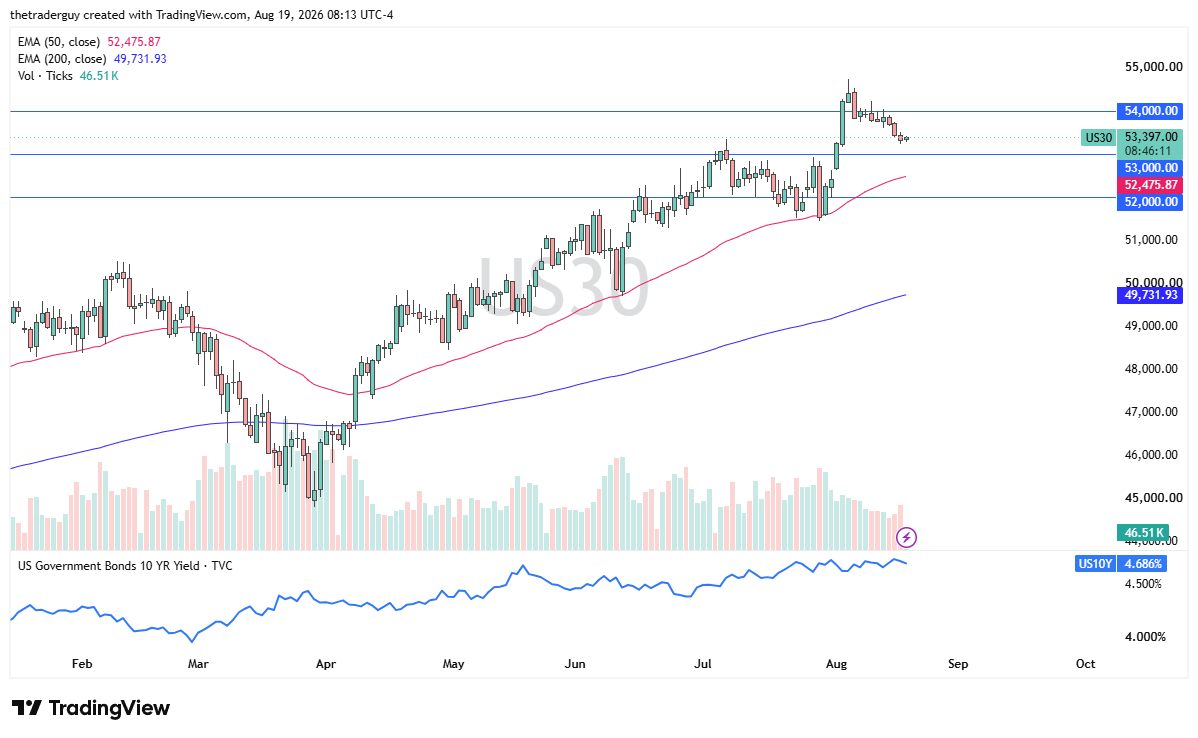
Dow Jones 30 daily chart shows the index holding near the 53,000 support area. Source: TradingView.
S&P 500
The S&P 500 is also flat, simply hovering around the 7,700 level. If the market were to fall from here, the 7,600 level is an area I’m paying attention to as it was a major breakout point. It could offer up a little bit of market memory-based support. The 50-day EMA is racing towards that area as well.
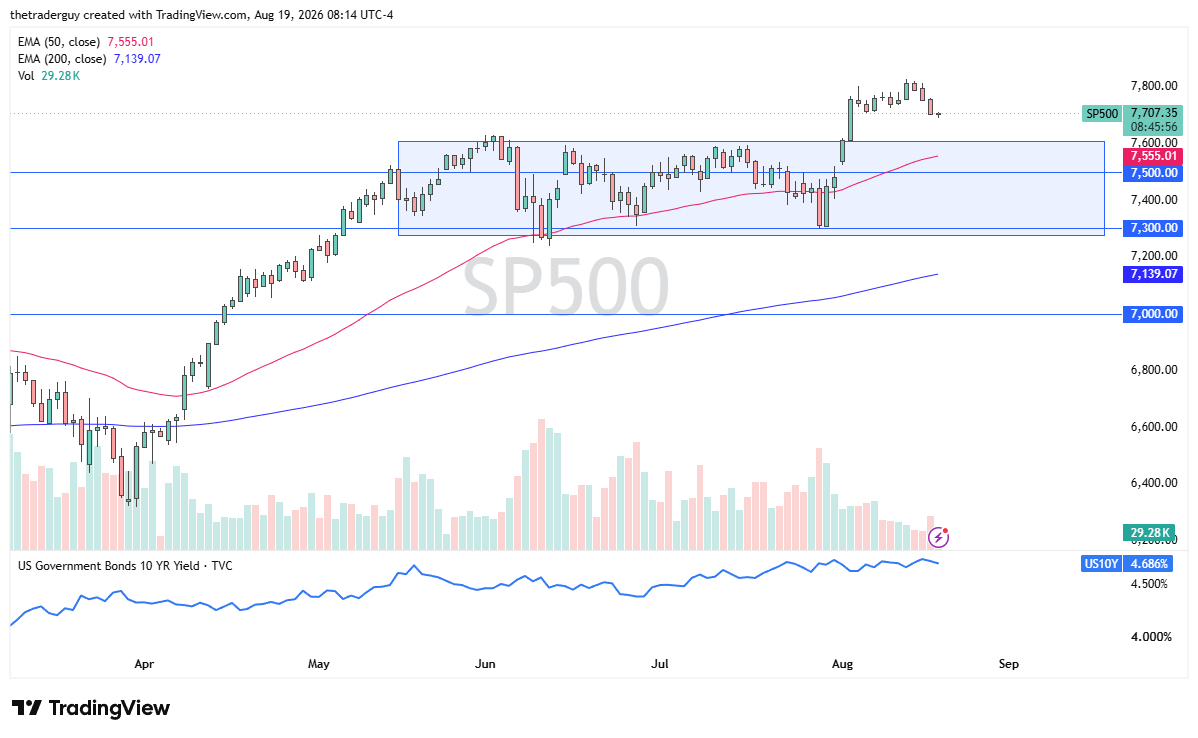
S&P 500 daily chart highlights the 7,600 breakout zone and rising 50-day EMA as support. Source: TradingView.
A Lot of Moving Pieces
So, with that being said, I remain bullish, but I also recognize that there are a lot of moving pieces out there: interest rates, the Middle East, earnings season. There’s a lot of different things going on at the same time. So, probably not overly surprising that we see a little bit of a wiggle here and there.