
History Doesn’t Repeat Itself, but It Rhymes; or Does It?
2025 was a bad year for Bitcoin, as it ended lower. However, despite limited data, BTC has never closed lower for two consecutive years. See Figure 1 below. Since 2024 was a green year, we should therefore expect 2026 through possibly 2028 to be green. So far, January has not disappointed, with crypto rallying every day, gaining 7.6% YTD.
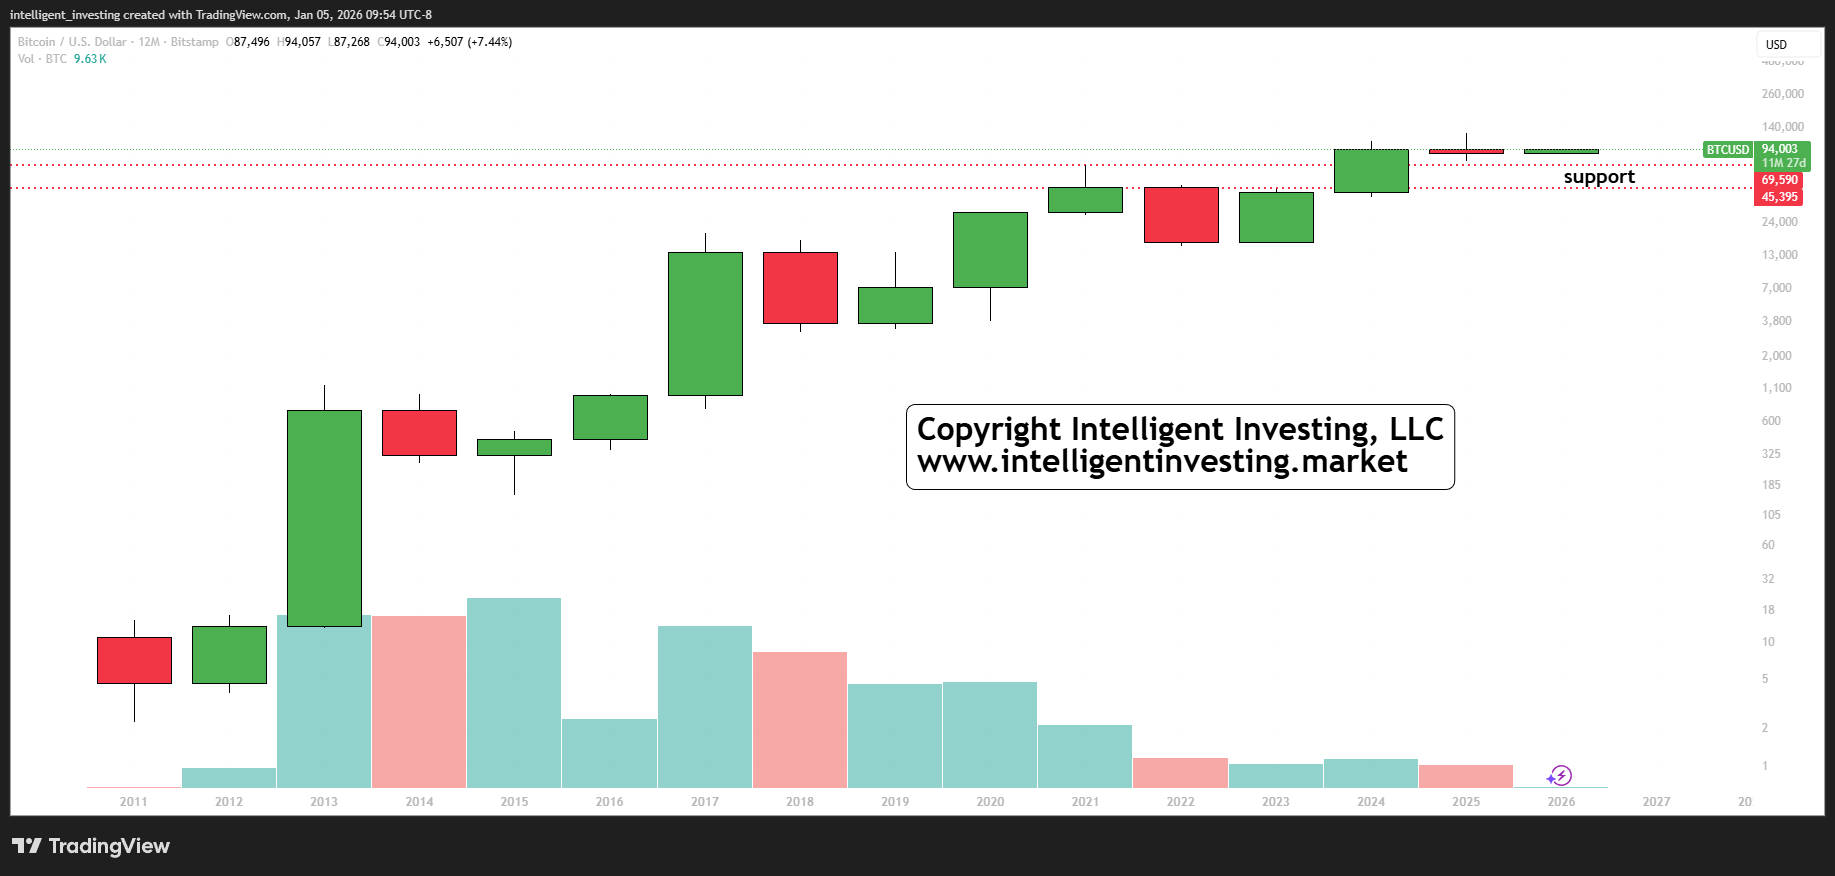
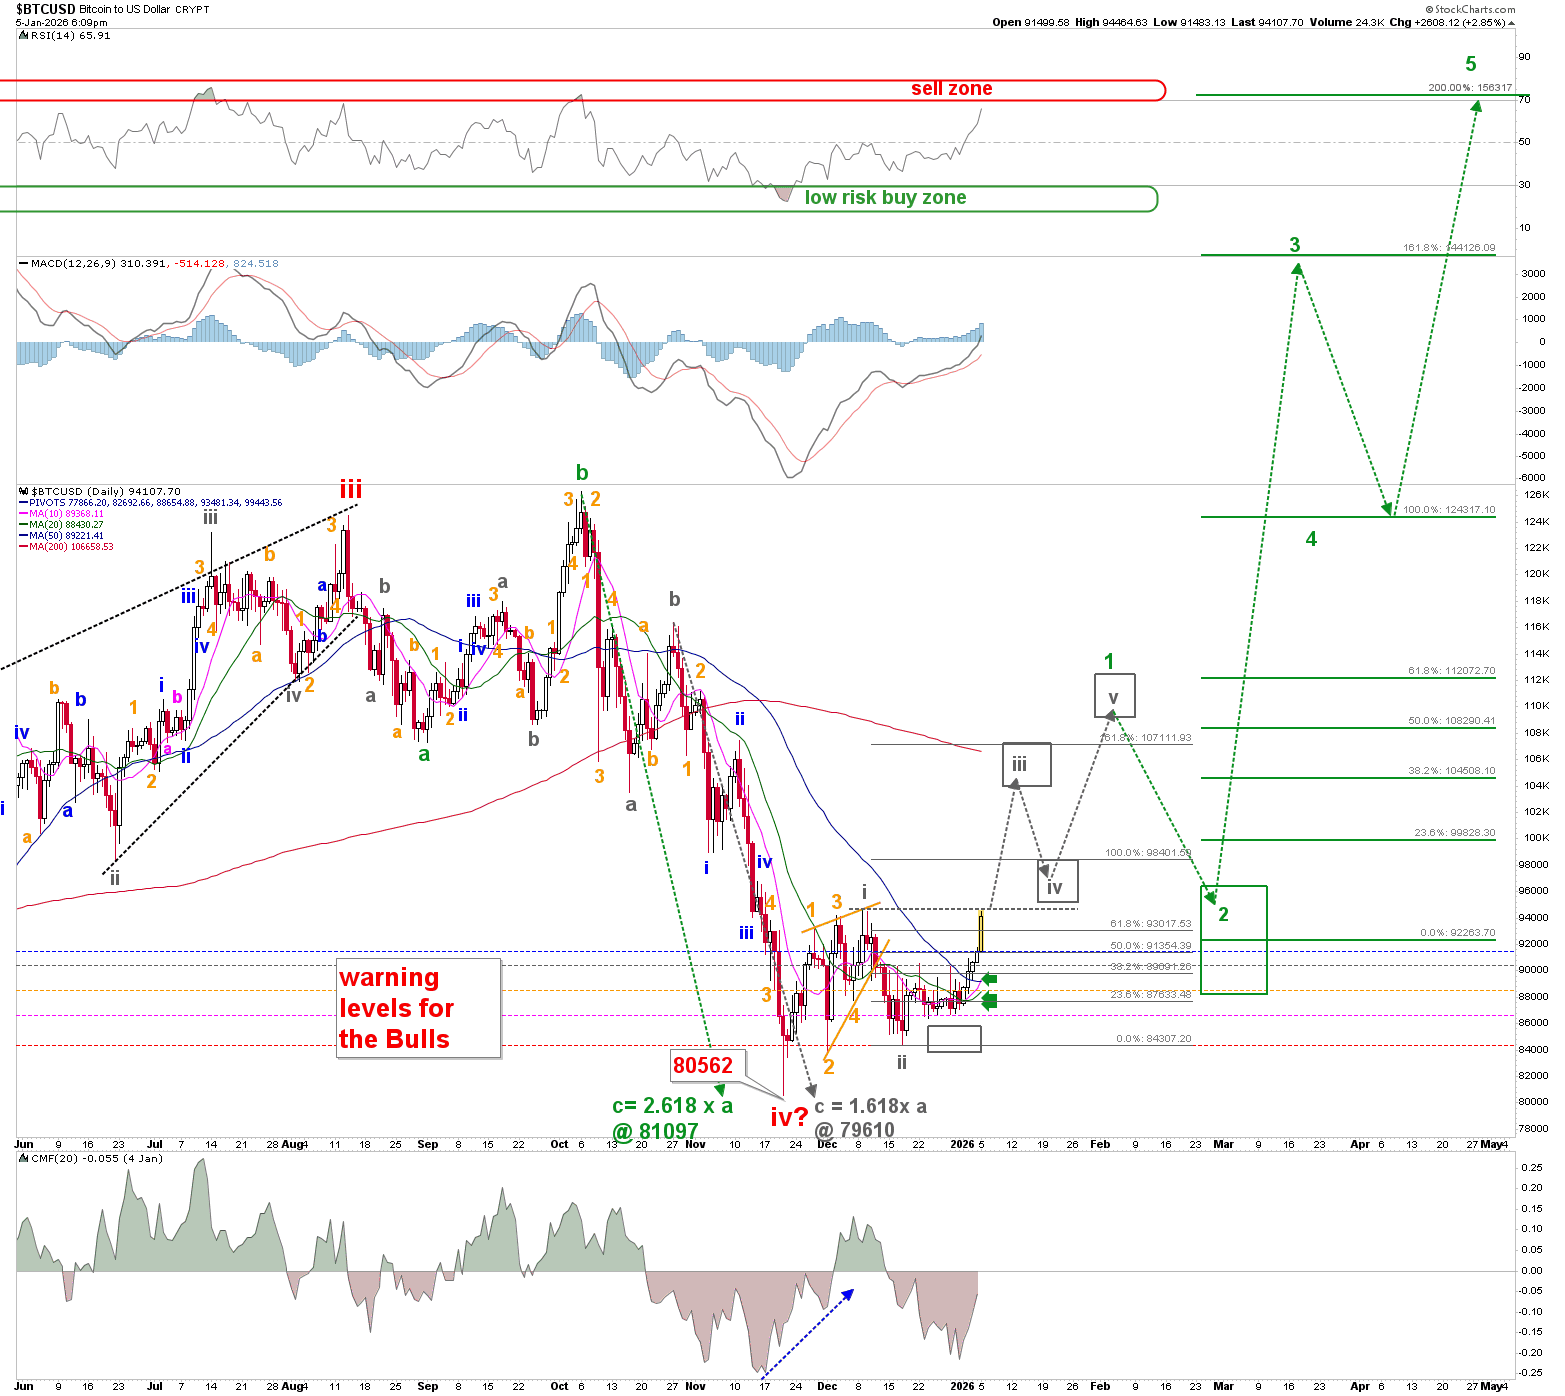
However, at this stage, as in 2015 and as discussed in our previous update, we can’t rule out a lower low near the upper end of long-term support ($69-73K) this year before Bitcoin really takes off. But for now, if Bitcoin can break above the December 9 high of $94617, we can allow it to complete a five-wave impulse move to ideally $110 ± 1K. See Figure 2 below.

A Bullish Price Pattern Is Potentially Forming
Namely, Bitcoin reclaimed its (blue) 50d SMA, a positive sign, after moving above its 10d and 20d SMA (green arrows). A first since October 9, 2025. However, it needs to break above the potential (gray) W-i high, as indicated by the leading diagonal formed on December 9 at $94617. We can then begin looking for the W-iii, as shown.
The Bulls’ warning levels are now adjusted to 91483, 90327, 88410, 86704, and 84424. Each successive break below these levels increases the probability by 20% that BTC will reach the low to mid $70Ks before attempting another rally.
Finally, financial markets tend to fluctuate—especially in the short term, which is typically more volatile than the long term. The yearly charts show a clear, consistent long-term uptrend, with higher highs and higher lows, whereas the daily-to-monthly charts exhibit more noise, i.e., more volatility. Trade and invest according to the time frame you can handle. Don’t manage long-term investments with daily charts, and vice versa.