


Tuesday Break Clears Correction Cap
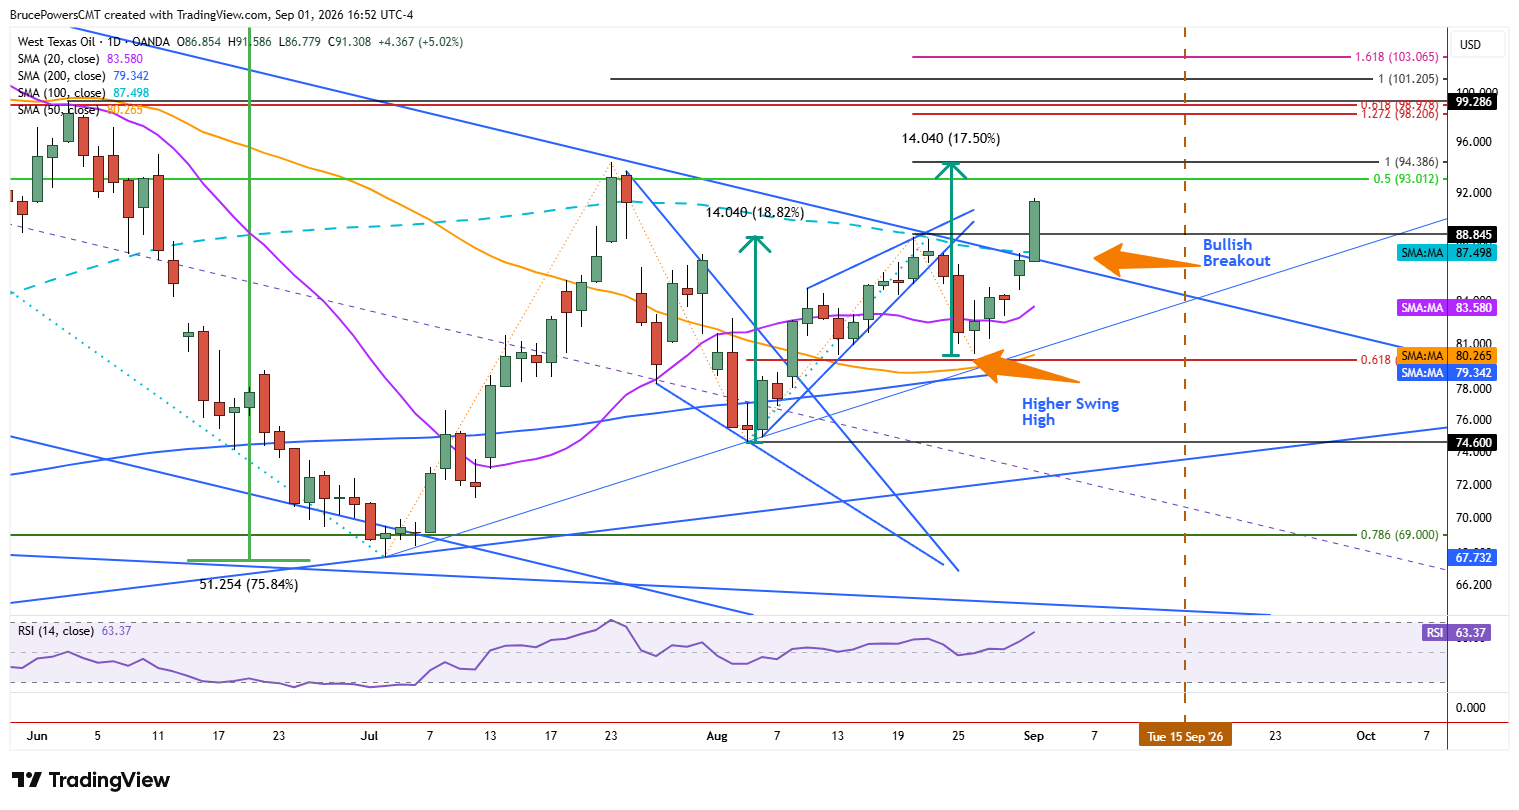
WTI crude oil broke above both the downtrend line and 100-day moving average on Tuesday, signaling an extension of its bullish character. That trendline had defined dynamic resistance for the bearish correction that followed the March peak of $91.54. The corrective trend was well formed, having confirmed the upper and lower boundaries with more than two touches each, while the 100-day moving average was confirmed as resistance during the prior advance in July. Together, this suggests that strong bullish momentum witnessed during Tuesday’s breakout may be the beginning of a new move higher in crude oil.

First Pause Near $93–$94
An initial upside target zone is defined by the lower swing high at $94.34 from July. But given the potential significance of Tuesday’s advance, it should act as only a resting area on the way to higher resistance zones. A simple measured move target for the current upswing is $94.39, adding to the price zone, along with the 50% retracement of the prior full decline at $93.01. Although that confluence presents a potentially strong barrier, the bullish trend signal should have greater impact.
Larger ABCD Aims at $101
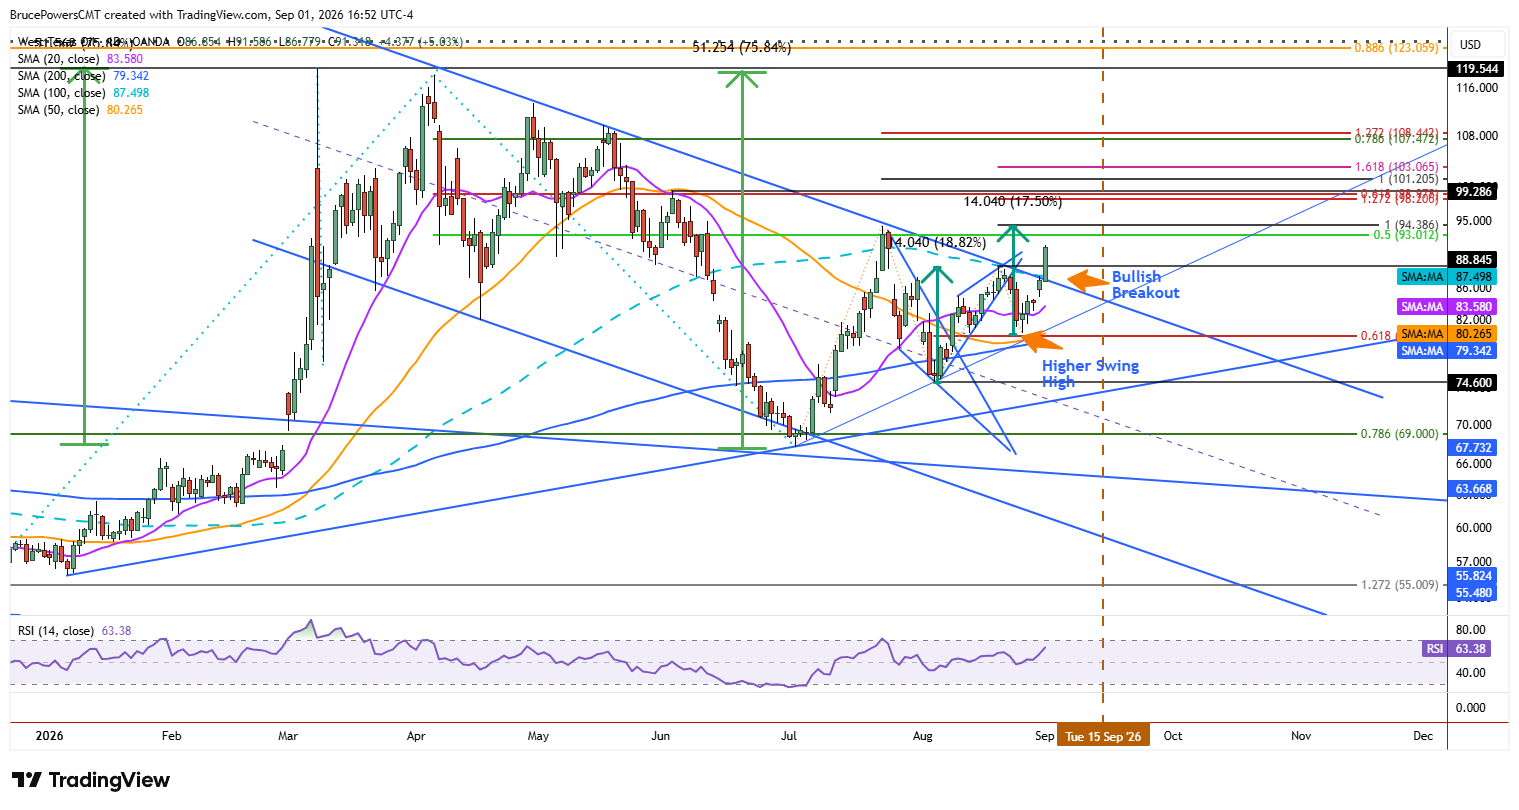
There are two rising ABCD patterns present in recent price action. Due to space constraints the smaller pattern is shown on the chart in green as measured moves. That smaller pattern is contained within a larger rising ABCD pattern that begins from the July low. It projects to an initial 100% target of $101.20. That level is near the top of a range that begins near $98.20 and includes the lower swing high from early June at $99.29.
$88.64 Must Hold the Break
Key short-term support is at Tuesday’s higher daily low of $86.78, which for now can also be used as a proxy for the downtrend line and 100-day moving average, as well. But the first indication of momentum changes will be on a test of support at the lower swing high of $88.64. If that area holds as support and is followed by strength, the bullish implications of Tuesday’s breakout will be further confirmed.



