Critical Support Comes Into Focus
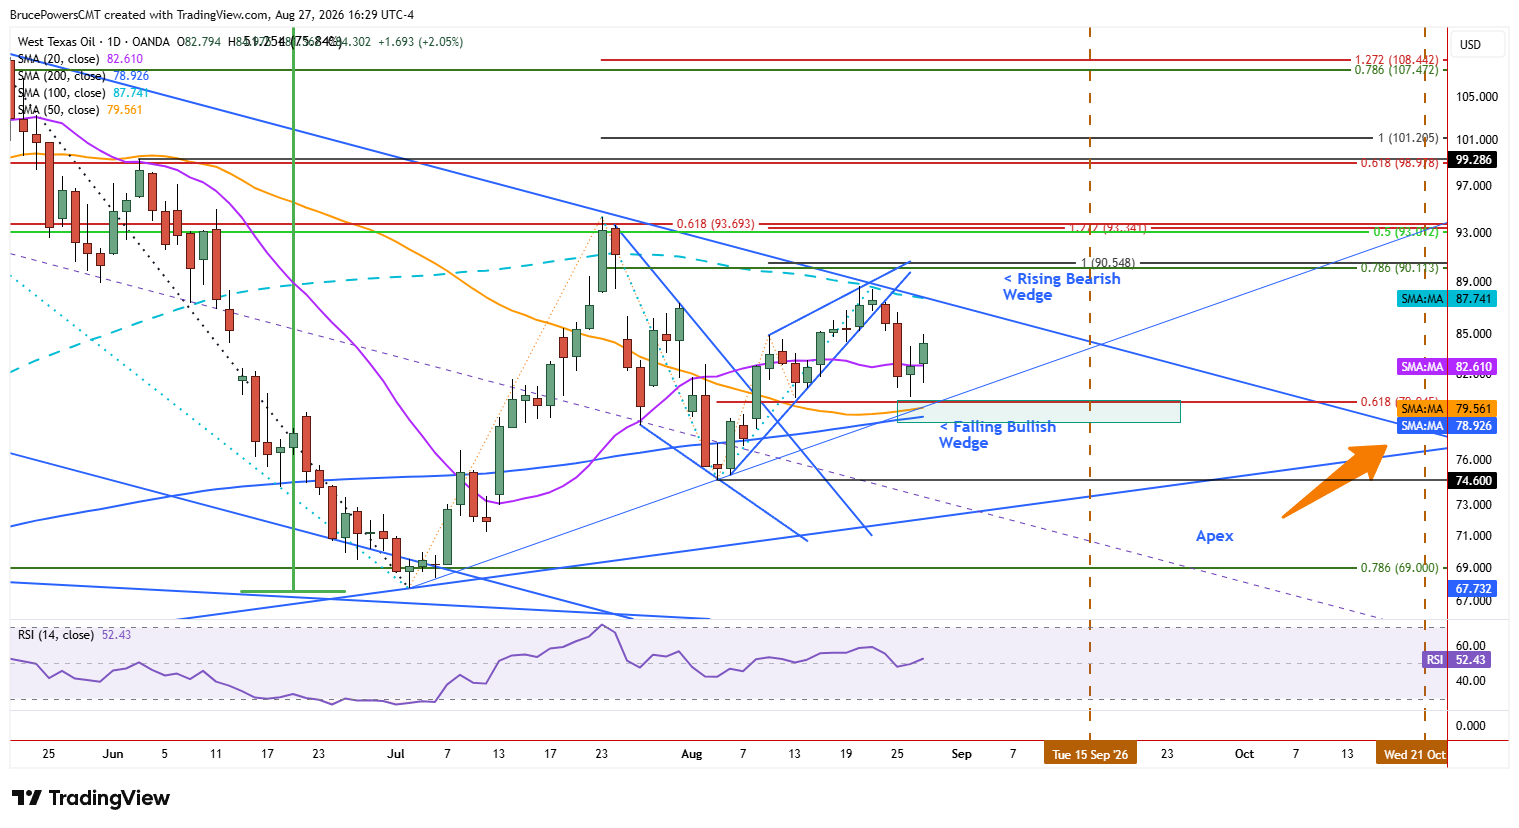
WTI crude oil continued to hold above support near $80.28 on Thursday, with the area marking the beginning of a potential support zone reached following Tuesday’s breakdown from a rising wedge pattern. That low, established on Wednesday, was near the prior higher swing low of $80.28 from the recent advance. Together, those levels mark the upper boundary of a potential support range extending down to the 200-day moving average near $78.95.
Bearish Momentum Faces an Inflection Point
Sellers could still push crude oil below the 200-day moving average given the bearish momentum unleased when the wedge pattern triggered. However, the long-term trend indicator represents a key inflection point. This would be the third test of support near the 200-day moving average since July, and the area is supported by other indicators.
The potential support range from $80.28 to $78.95 includes the 61.8% Fibonacci retracement near $79.95, the 50-day moving average at $79.55. An uptrend line defining dynamic resistance for the short-term advance also intersects the area. Given the confluence of support indicators, a successful defense of the zone could eventually lead to the establishment of another higher swing low.
Wedge Resistance Sets a Higher Bar
The recent lower swing high of $88.64 at the top of the wedge was generated near the confluence of the 100-day moving average and the upper boundary of a falling channel. That was a bearish development, later confirmed by the wedge breakdown, and suggests that lower support levels may be tested, including the recent higher swing low near $74.60.
Triangles Signal a Volatility Squeeze
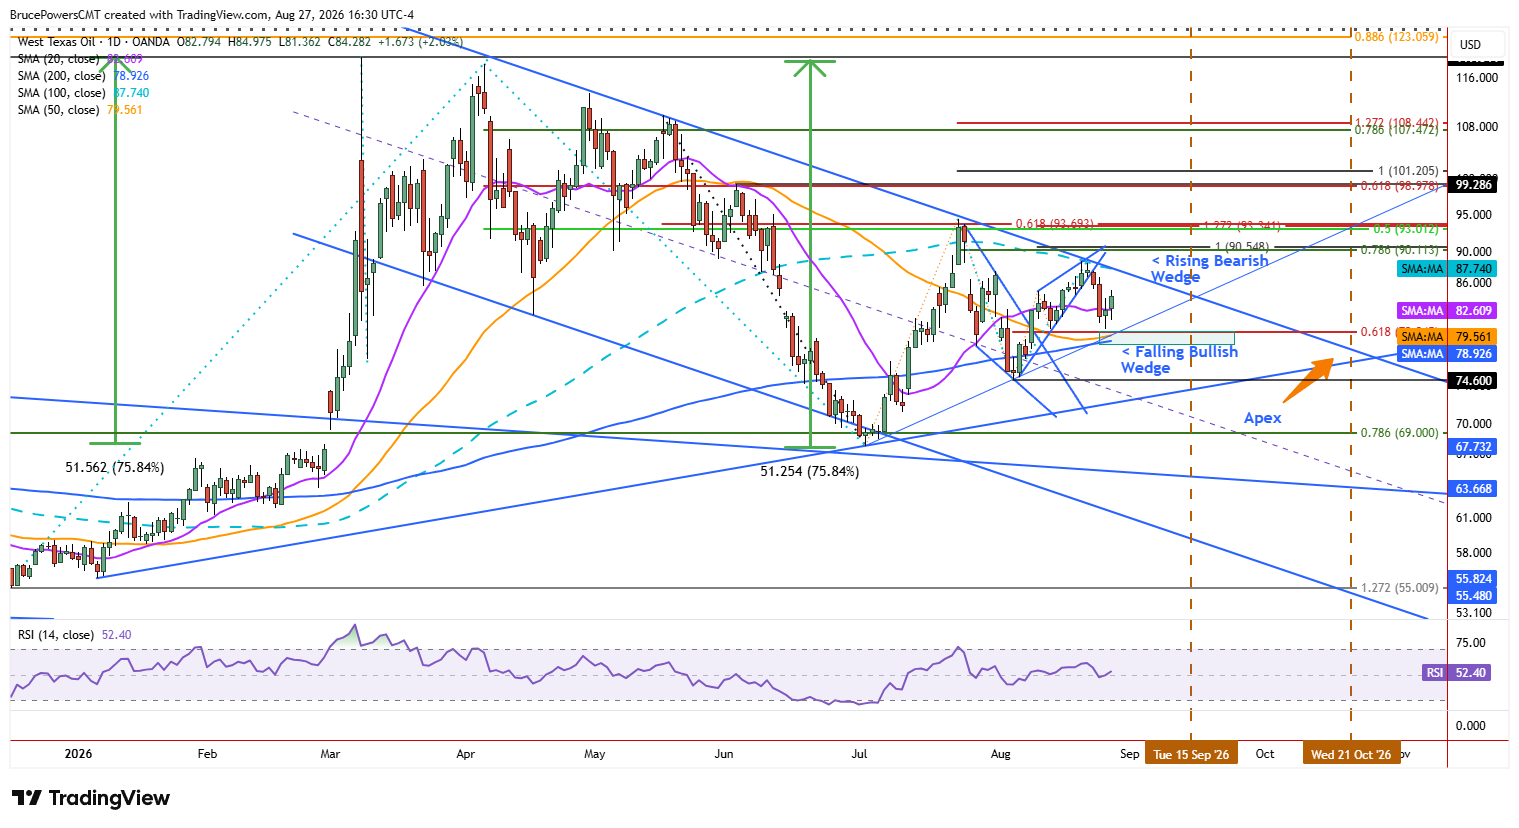
At the same time, two symmetrical triangle patterns are developing in crude oil, reflecting declining volatility and a narrowing price range. The short-term rising trendline converges with the downtrend line at the top of the falling channel around September 15. This means that one of the boundary lines of the triangle should break before then providing new information about the likely direction of the next move.
WTI Crude Oil Price Forecast
Every new WTI Crude Oil analysis as it publishes, today's technical signal and key levels, live price — on one page.
See all WTI Crude Oil forecastsNext Break Could Define Direction
If a break below the lower boundary line occurs, crude oil would transition into a larger triangle pattern with an apex around October 21, Key support for that pattern is the rising trendline connected to the July swing low. For now, however, the $80.28 to $78.95 support zone is the immediate area to watch as crude oil searches for support following the bearish wedge breakdown.
If you’d like to know more about how to trade crude oil, please visit our educational area.