


Uptrend Intact After $300 Low
The long-term bullish trend in Apple Inc. (AAPL) remains intact after the recent pullback completed, pointing to an eventual continuation into higher prices. A short-term correction followed the July record high of $344.57 and carved a higher swing low at an even $300.00 before the rebound started a couple of weeks ago.
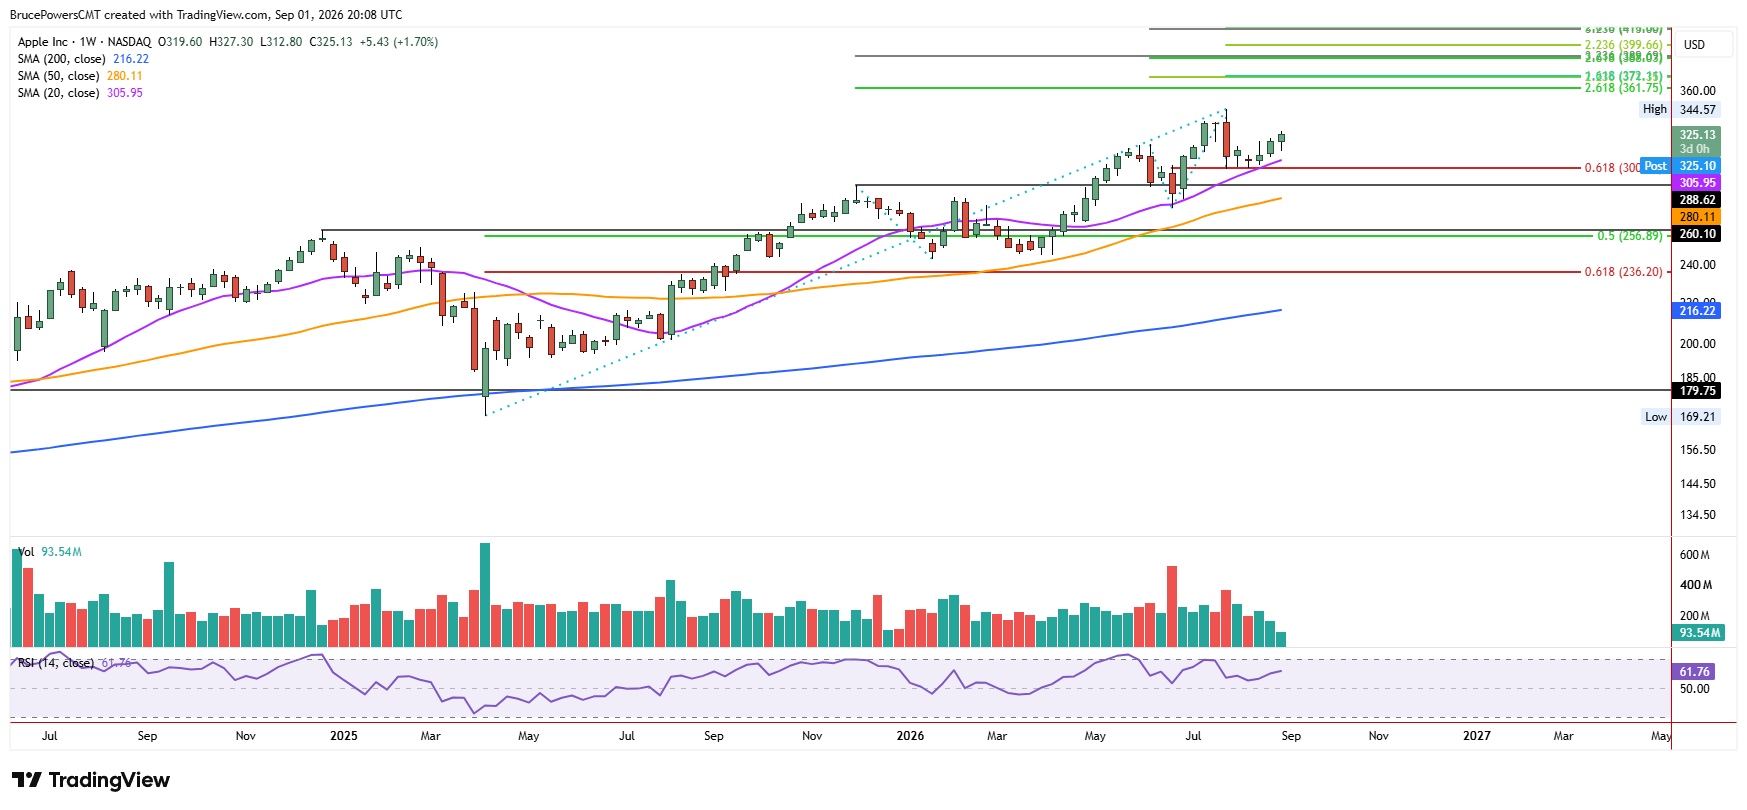
Support near that low was reinforced by the 61.8% Fibonacci retracement of the prior advance at $300.80 and a successful test of the 20-week moving average, now near $306.00 and rising. That cluster established an important support area and therefore a key structural floor for the larger uptrend. A break of that zone would make the near-term outlook less clear and put the post-earnings rebound at risk of becoming a deeper correction.
Daily Strength from Earnings Low
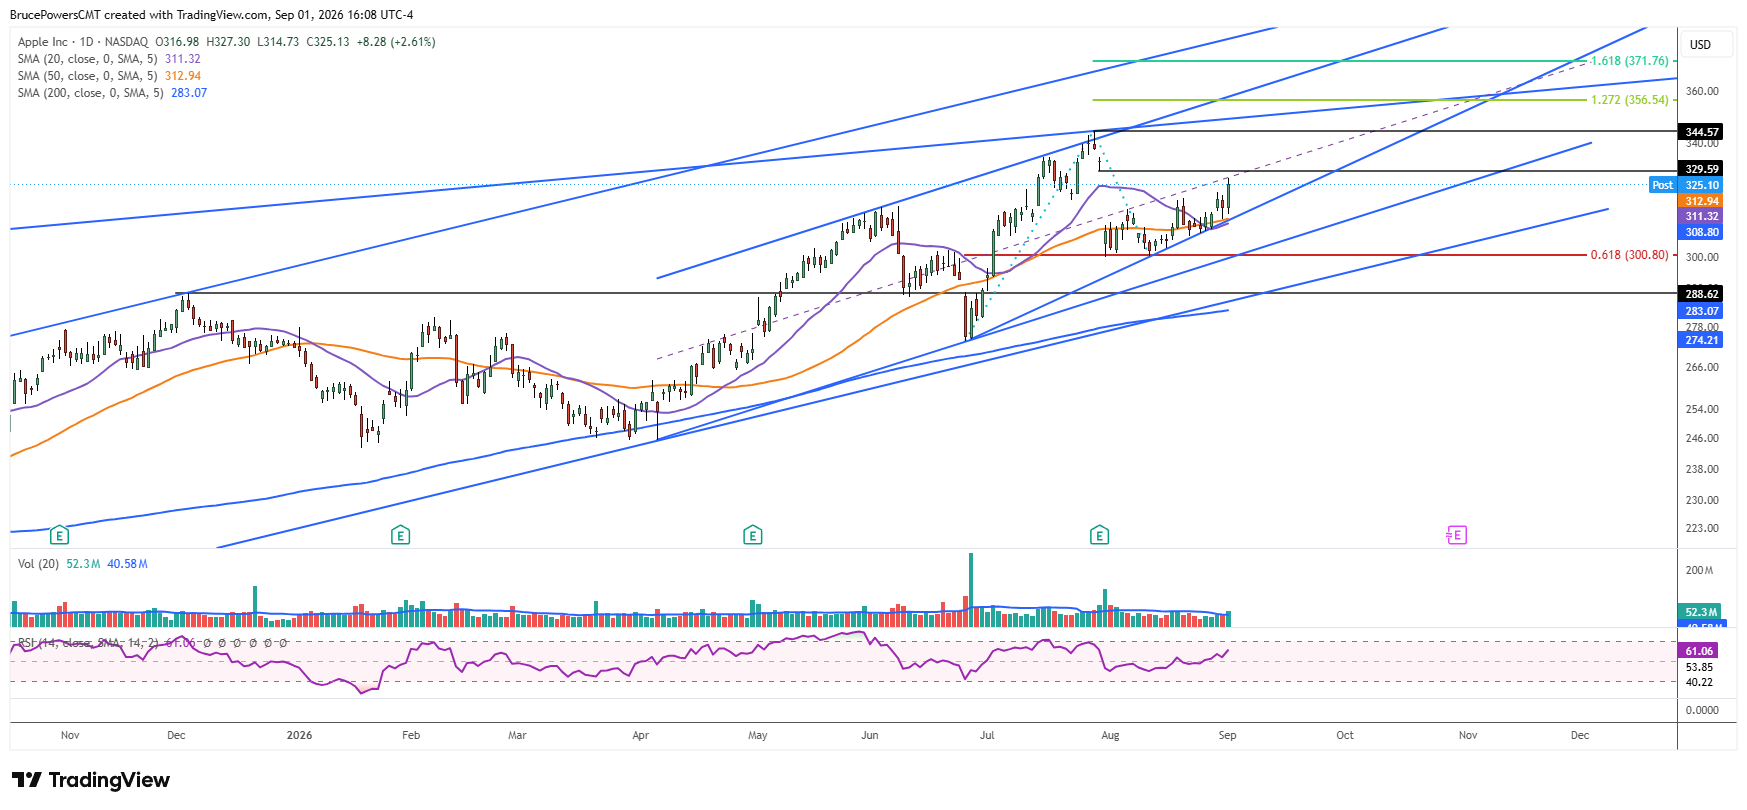
On the daily chart, AAPL showed strength last week by reclaiming both the 20-day and 50-day moving averages. Support was confirmed on Monday when the session low bounced from the 50-day moving average, extending the short-term advance that began from the July low. That low formed in reaction to Apple’s Q3 2026 earnings release and has since acted as the base for the current swing higher.
Earnings Gap First, Then $344
Since then, AAPL has moved higher overall and printed a new high for the current advance on Tuesday at $327.30. The gap down that followed the July earnings release fills at $329.55, and AAPL is now close to that level. The same area is marked by the midline of a rising trend channel, which argues for at least a short-term resistance zone before any run at the July peak.
Even so, AAPL’s July peak of $344.57 sits less than 6% above Tuesday’s high, so it comes into play if bullish momentum picks up after the gap is filled. Key near-term support on the daily chart is the recent higher swing low at $307.01, where the 20-day and 50-day moving averages and an uptrend line also cluster. Those daily support levels sit just above the weekly floor around $300 to $306. Hold $307.01 and the completed pullback can still feed a push through the earnings gap. Lose it, and the long-term uptrend stays intact on the weekly map, but Tuesday’s advance toward $329.55 loses its footing.
If you’d like to know more about technical analysis and how traders use it, please visit our educational area.