Tuesday Slide Hits Support Cluster
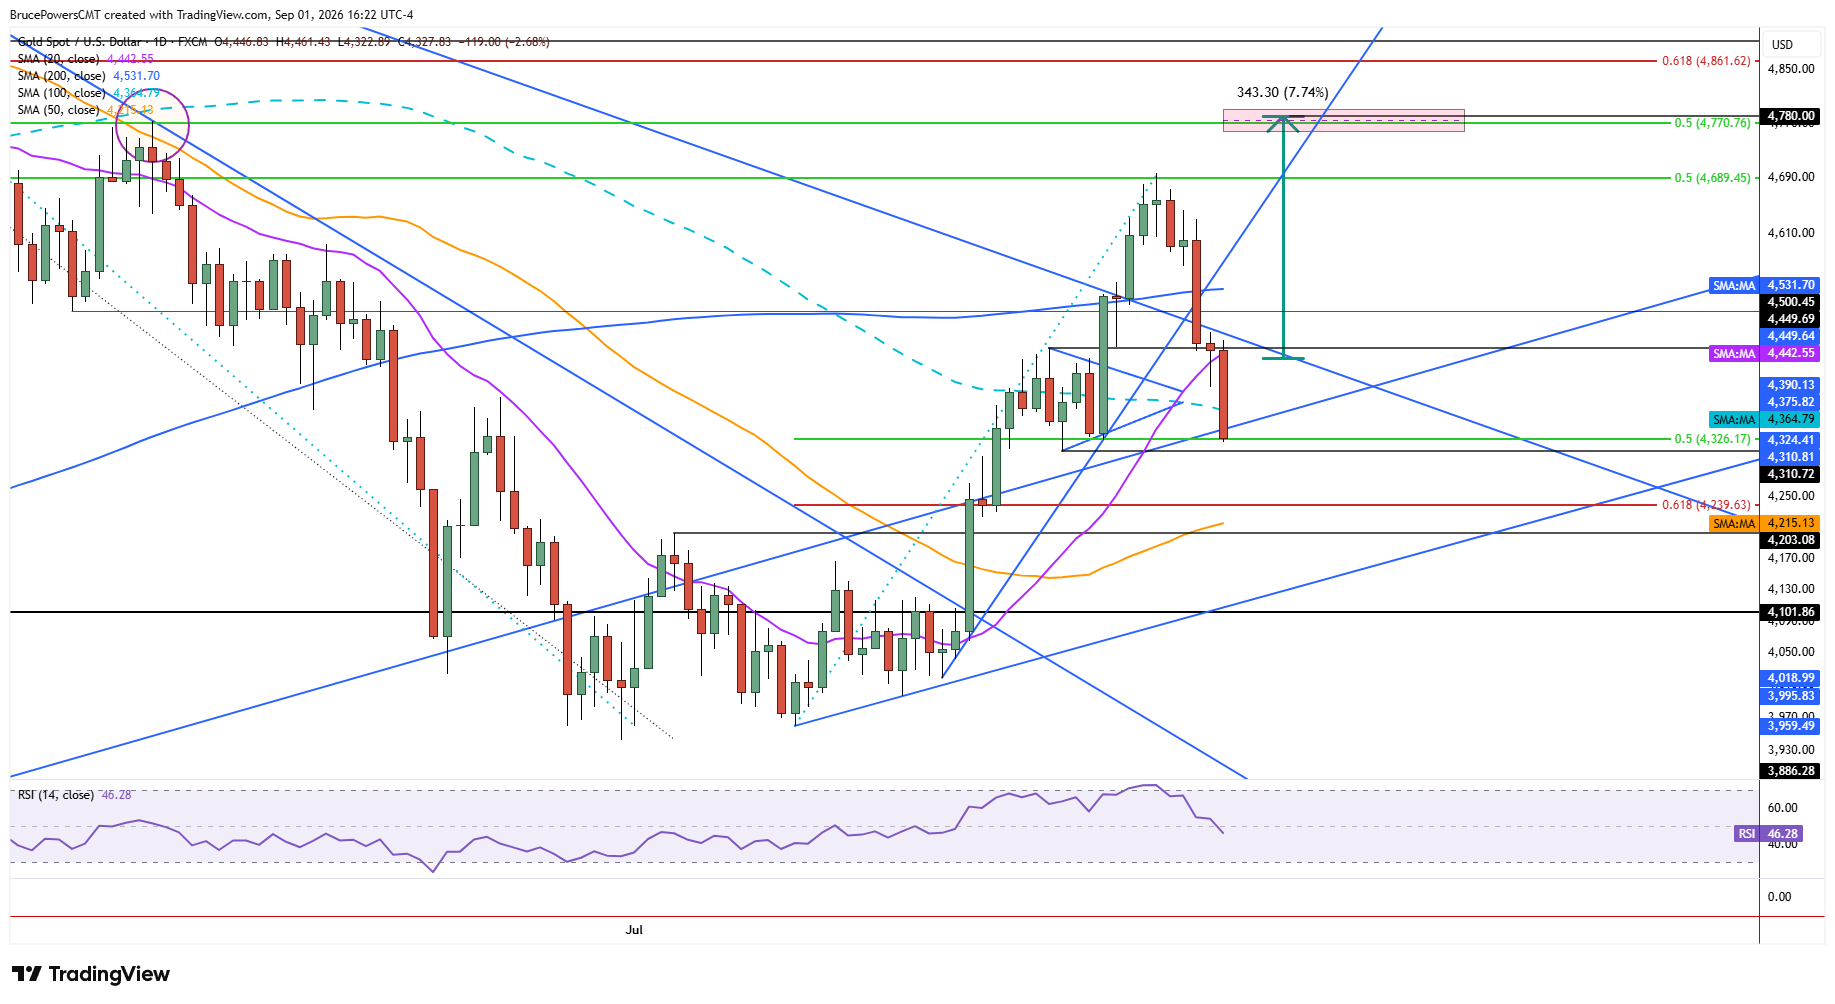
Gold continued to weaken on Tuesday, slicing through the 20-day and 100-day moving averages and landing on a tight confluence of support that now decides whether the August rebound holds. A nine-day low of $4,326 was reached near the confluence of several indicators. The rising trendline recovered during the recent advance was tested as support, along with the 50% retracement of the prior full advance from the mid-July swing low at $4,328, and the lows of a prior pullback support range from $4,329 to $4,311.

August Trendline Still the Pivot
Together, that cluster of levels suggests gold has reached its next key decision point. The pullback to test the rising trendline as support after its decisive recovery on August 7 remains the more significant price action. If the trendline continues to act as dynamic support and it is followed by signs of strength, then prior key dynamic resistance will have switched back to support. Once that flip is confirmed, the developing bullish trend may be ready to proceed into higher prices. Because the area near the trendline is reinforced by other indicators, the potential support zone takes on greater significance.
Failure Below $4,311
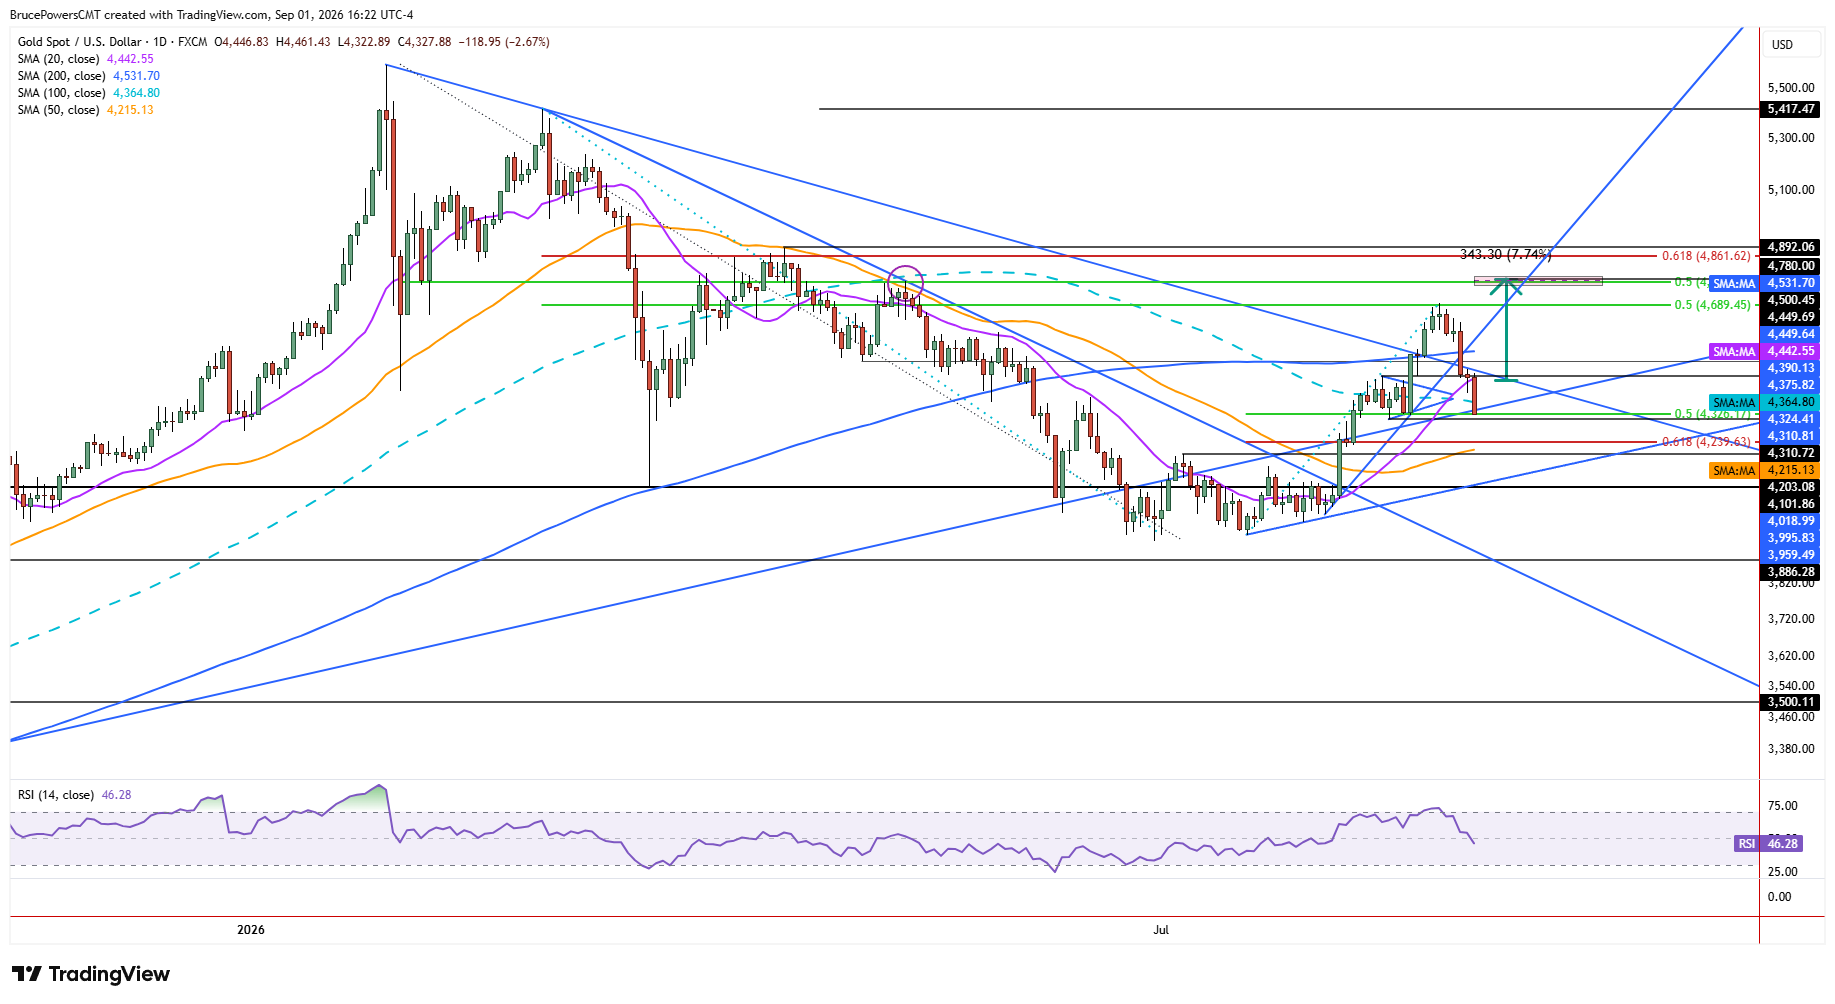
A decline below the recent higher swing low of $4,311 would signal a reversal of that advance and a failure of support at the trendline. That would increase the chance of a test of the prior lower swing high and the top of a consolidation bottom range at $4,203, along with the 50-day moving average near $4,216. Falling back below the uptrend line would put gold in a more vulnerable position, as it would begin to negate recent bullish price behavior that included the reclaim of key moving averages and a downtrend line two weeks ago.
Upside Case If Buyers Return
If gold can continue to hold above support at $4,311 and then strengthen, another leg up toward the next higher target zone near $4,774 comes into play. Initial signs of strength would appear above the swing high of $4,450 and then the 200-day moving average, currently at $4,532. Given the decisive three-day decline in gold, however, support looks likely to be tested further before there are signs of buyers. Until they appear, Tuesday’s break below the moving averages still frames the near-term risk: the same confluence that absorbed the selloff must hold, or the August recovery begins to unwind.
If you’d like to know more about how to trade gold and silver, please visit our educational area.