A Bullish Reversal Emerges After a Deep Decline
Following a 56.6% decline, the stock of Bilibili Inc. (BILI) is starting to show signs of strengthening, having recently established a bullish inverse head-and-shoulders pattern. The company provides online entertainment services in China, and Q2 2026 earnings are estimated to be released around August 20, but the specific date has not yet been confirmed.
An initial upside breakout from the pattern triggered on Monday, with the stock reaching a high of $19.47 and triggering a bullish signal, first above the recent swing high of $19.09 and then above the earlier lower swing high of $19.19. The breakout was confirmed by a daily close above the neckline of the inverse head-and-shoulders pattern as well as above both those swing highs. However, the subsequent pullback means the breakout still needs follow-through to strengthen the reversal signal.

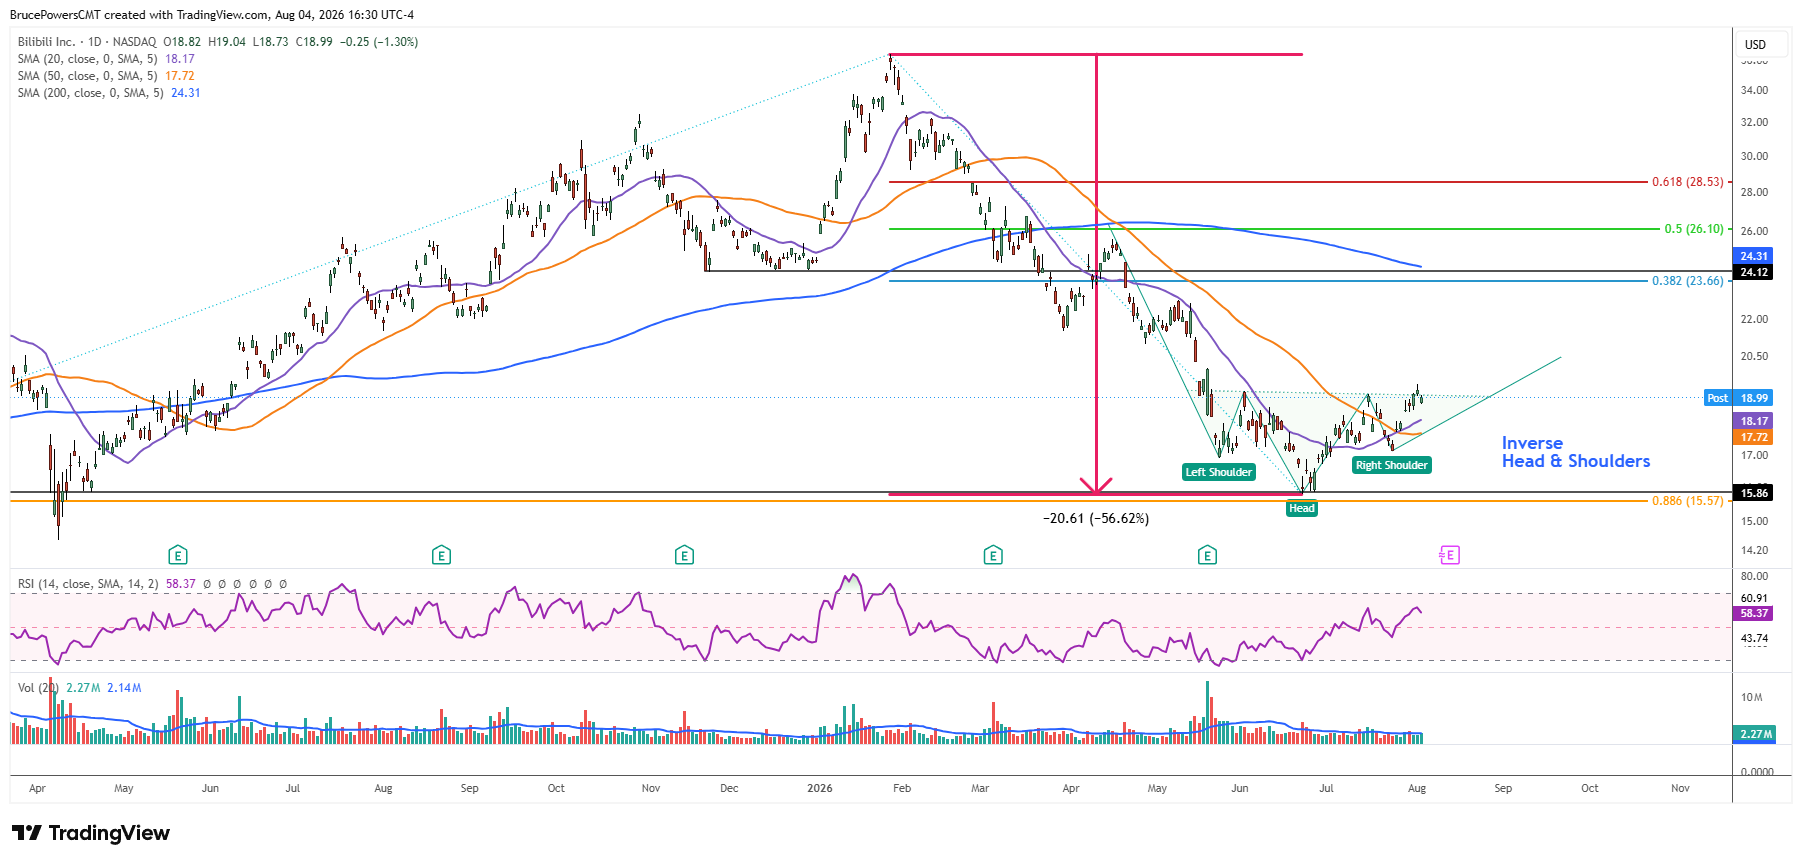
Breakout Now Faces a Confirmation Test
Next, there needs to be further signs of strengthening to further confirm the bottom reversal breakout. On Tuesday, BILI failed to confirm the breakout and instead pulled back below the neckline and into the base consolidation pattern. Nonetheless, the potential bullish pattern remains valid unless the higher swing low of $17.14 is broken to the downside. A break below that level would represent a maximum-failure signal and significantly weaken the bullish reversal setup.
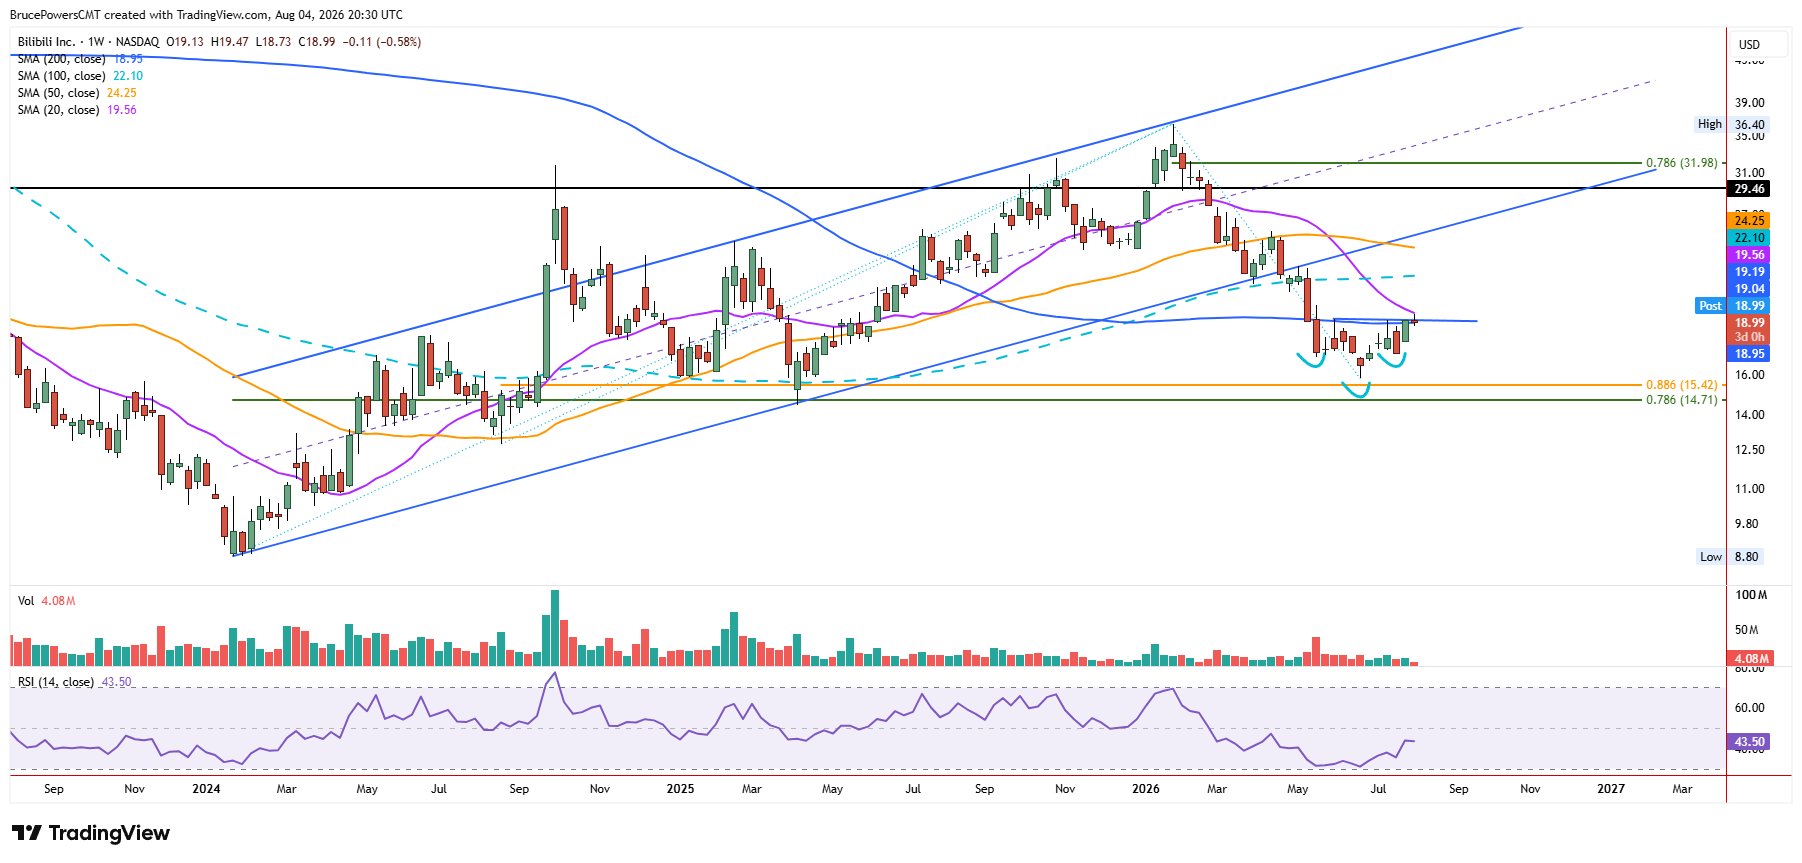
Moving Averages Define the Bullish Line in the Sand
There are also two moving averages that represent potential dynamic support. The more significant level is represented by the 50-day moving average at $17.72. The other is the 20-day moving average, now near $18.17 and rising. During the rally that followed the higher swing low of the right shoulder, the 50-day moving average was reclaimed as support for the second time recently. Also, an improvement in short-term bullish momentum was shown by the 20-day moving average crossing above the 50-day average. Together, the moving averages provide a nearby support zone that could help determine whether the recent breakout develops into a sustained advance or fades into further consolidation.
Higher Targets Await a Sustained Breakout
Another rise above the breakout level of $19.09 should be followed by additional signs of strength and bullish momentum. Until then, consolidation and a pullback towards the moving averages may occur. An initial upside target zone is indicated from around $23.66 to $24.31, derived from the 38.2% Fibonacci retracement and the 200-day moving average, respectively, along with a prior support shelf from late 2025 near $24.12.
That confluence resistance zone is slightly above an estimated measured move target from the inverse head-and-shoulders pattern at $22.39. Therefore, a sustained move above $19.09 would strengthen the bullish reversal case, while the ability to hold the moving-average support zone would help keep the pattern’s upside targets in play.