Bitcoin (BTC) is approaching an on-chain signal that has historically appeared near major bear-market bottoms and preceded some of the cryptocurrency’s largest long-term recoveries.

Bitcoin Realized Losses Cross Realized Profits: Why It’s an Important Bottom Indicator
Bitcoin’s 365-day average realized losses moved below realized profits, according to data resource CryptoQuant.
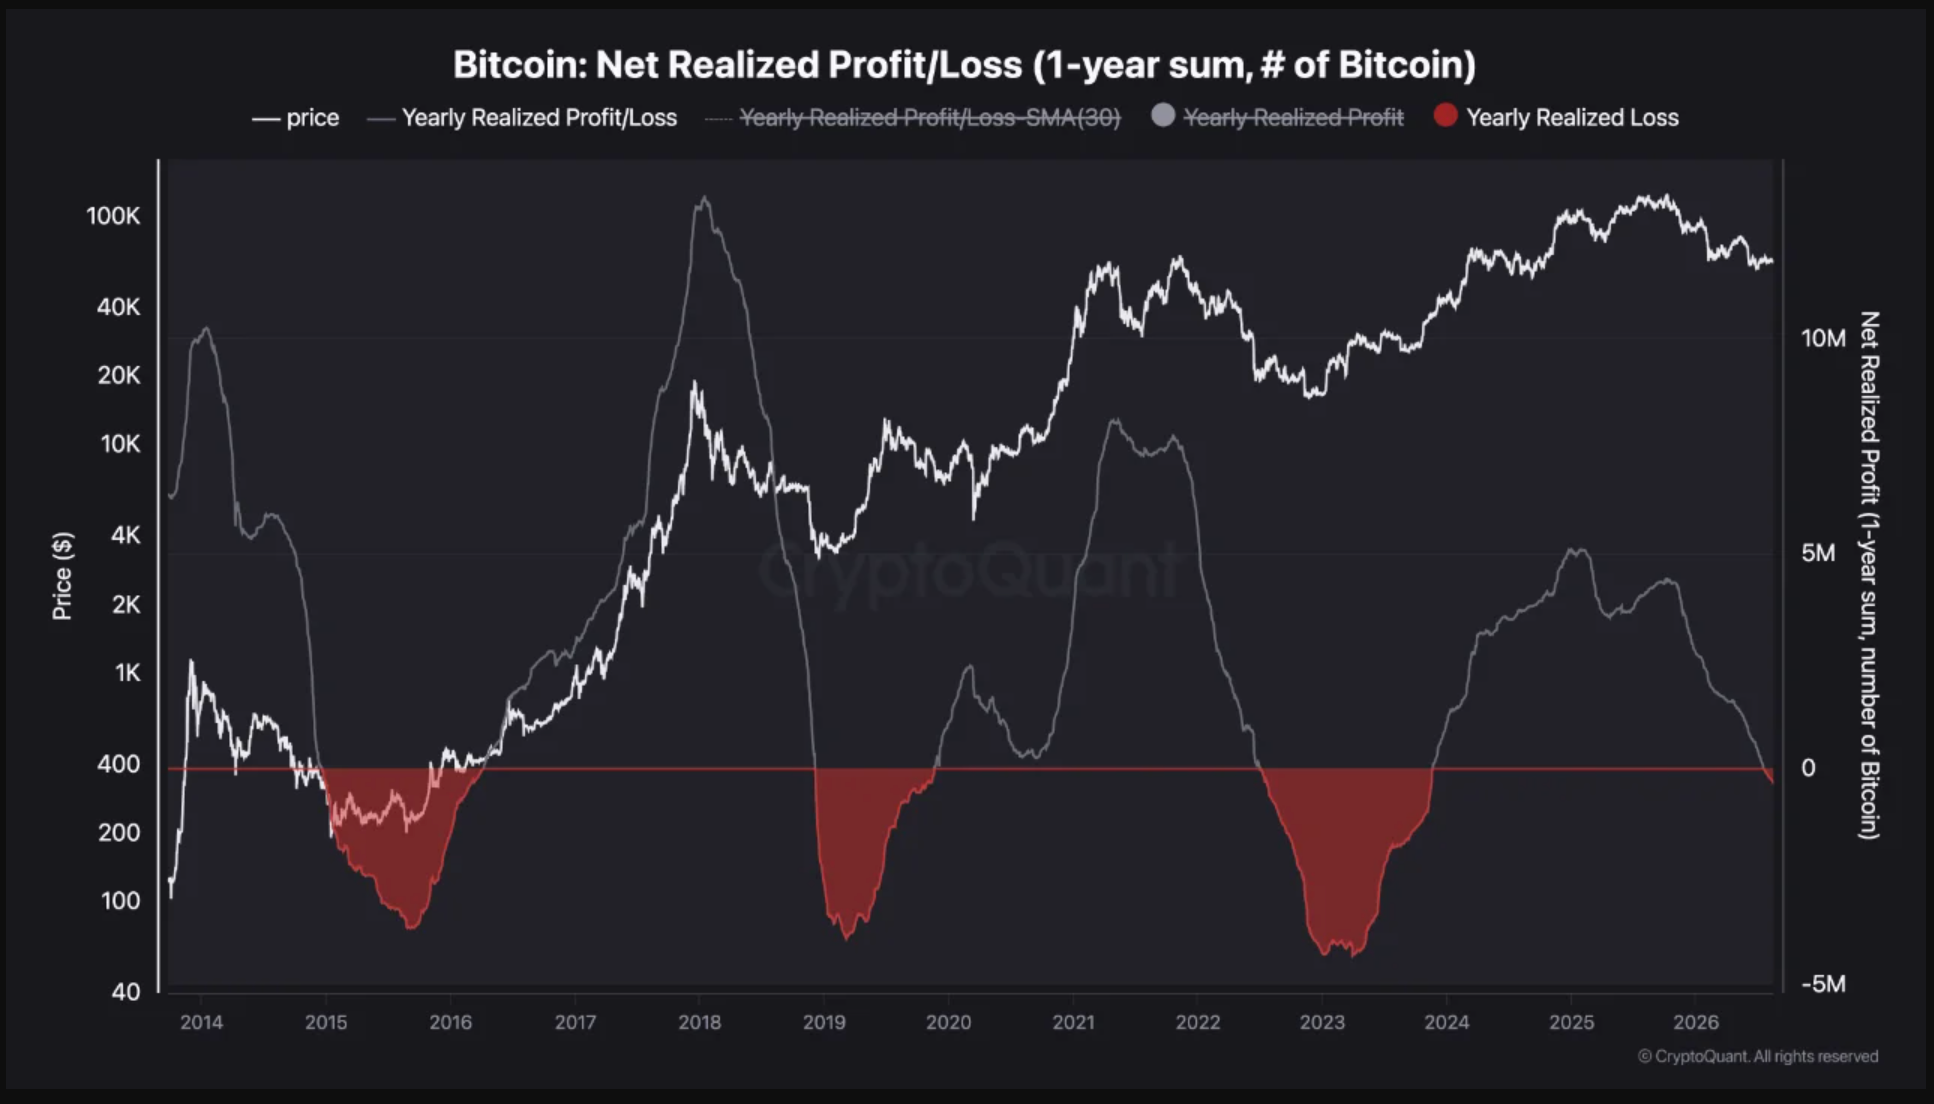
The crossover occurs when holders collectively begin realizing more losses than profits over the measured period, a condition typically associated with heavy market stress and capitulation.
Similar crossovers appeared around Bitcoin’s major bottoms in 2015, 2019, and 2022-23, noted analyst CryptoGoos in a Monday post.
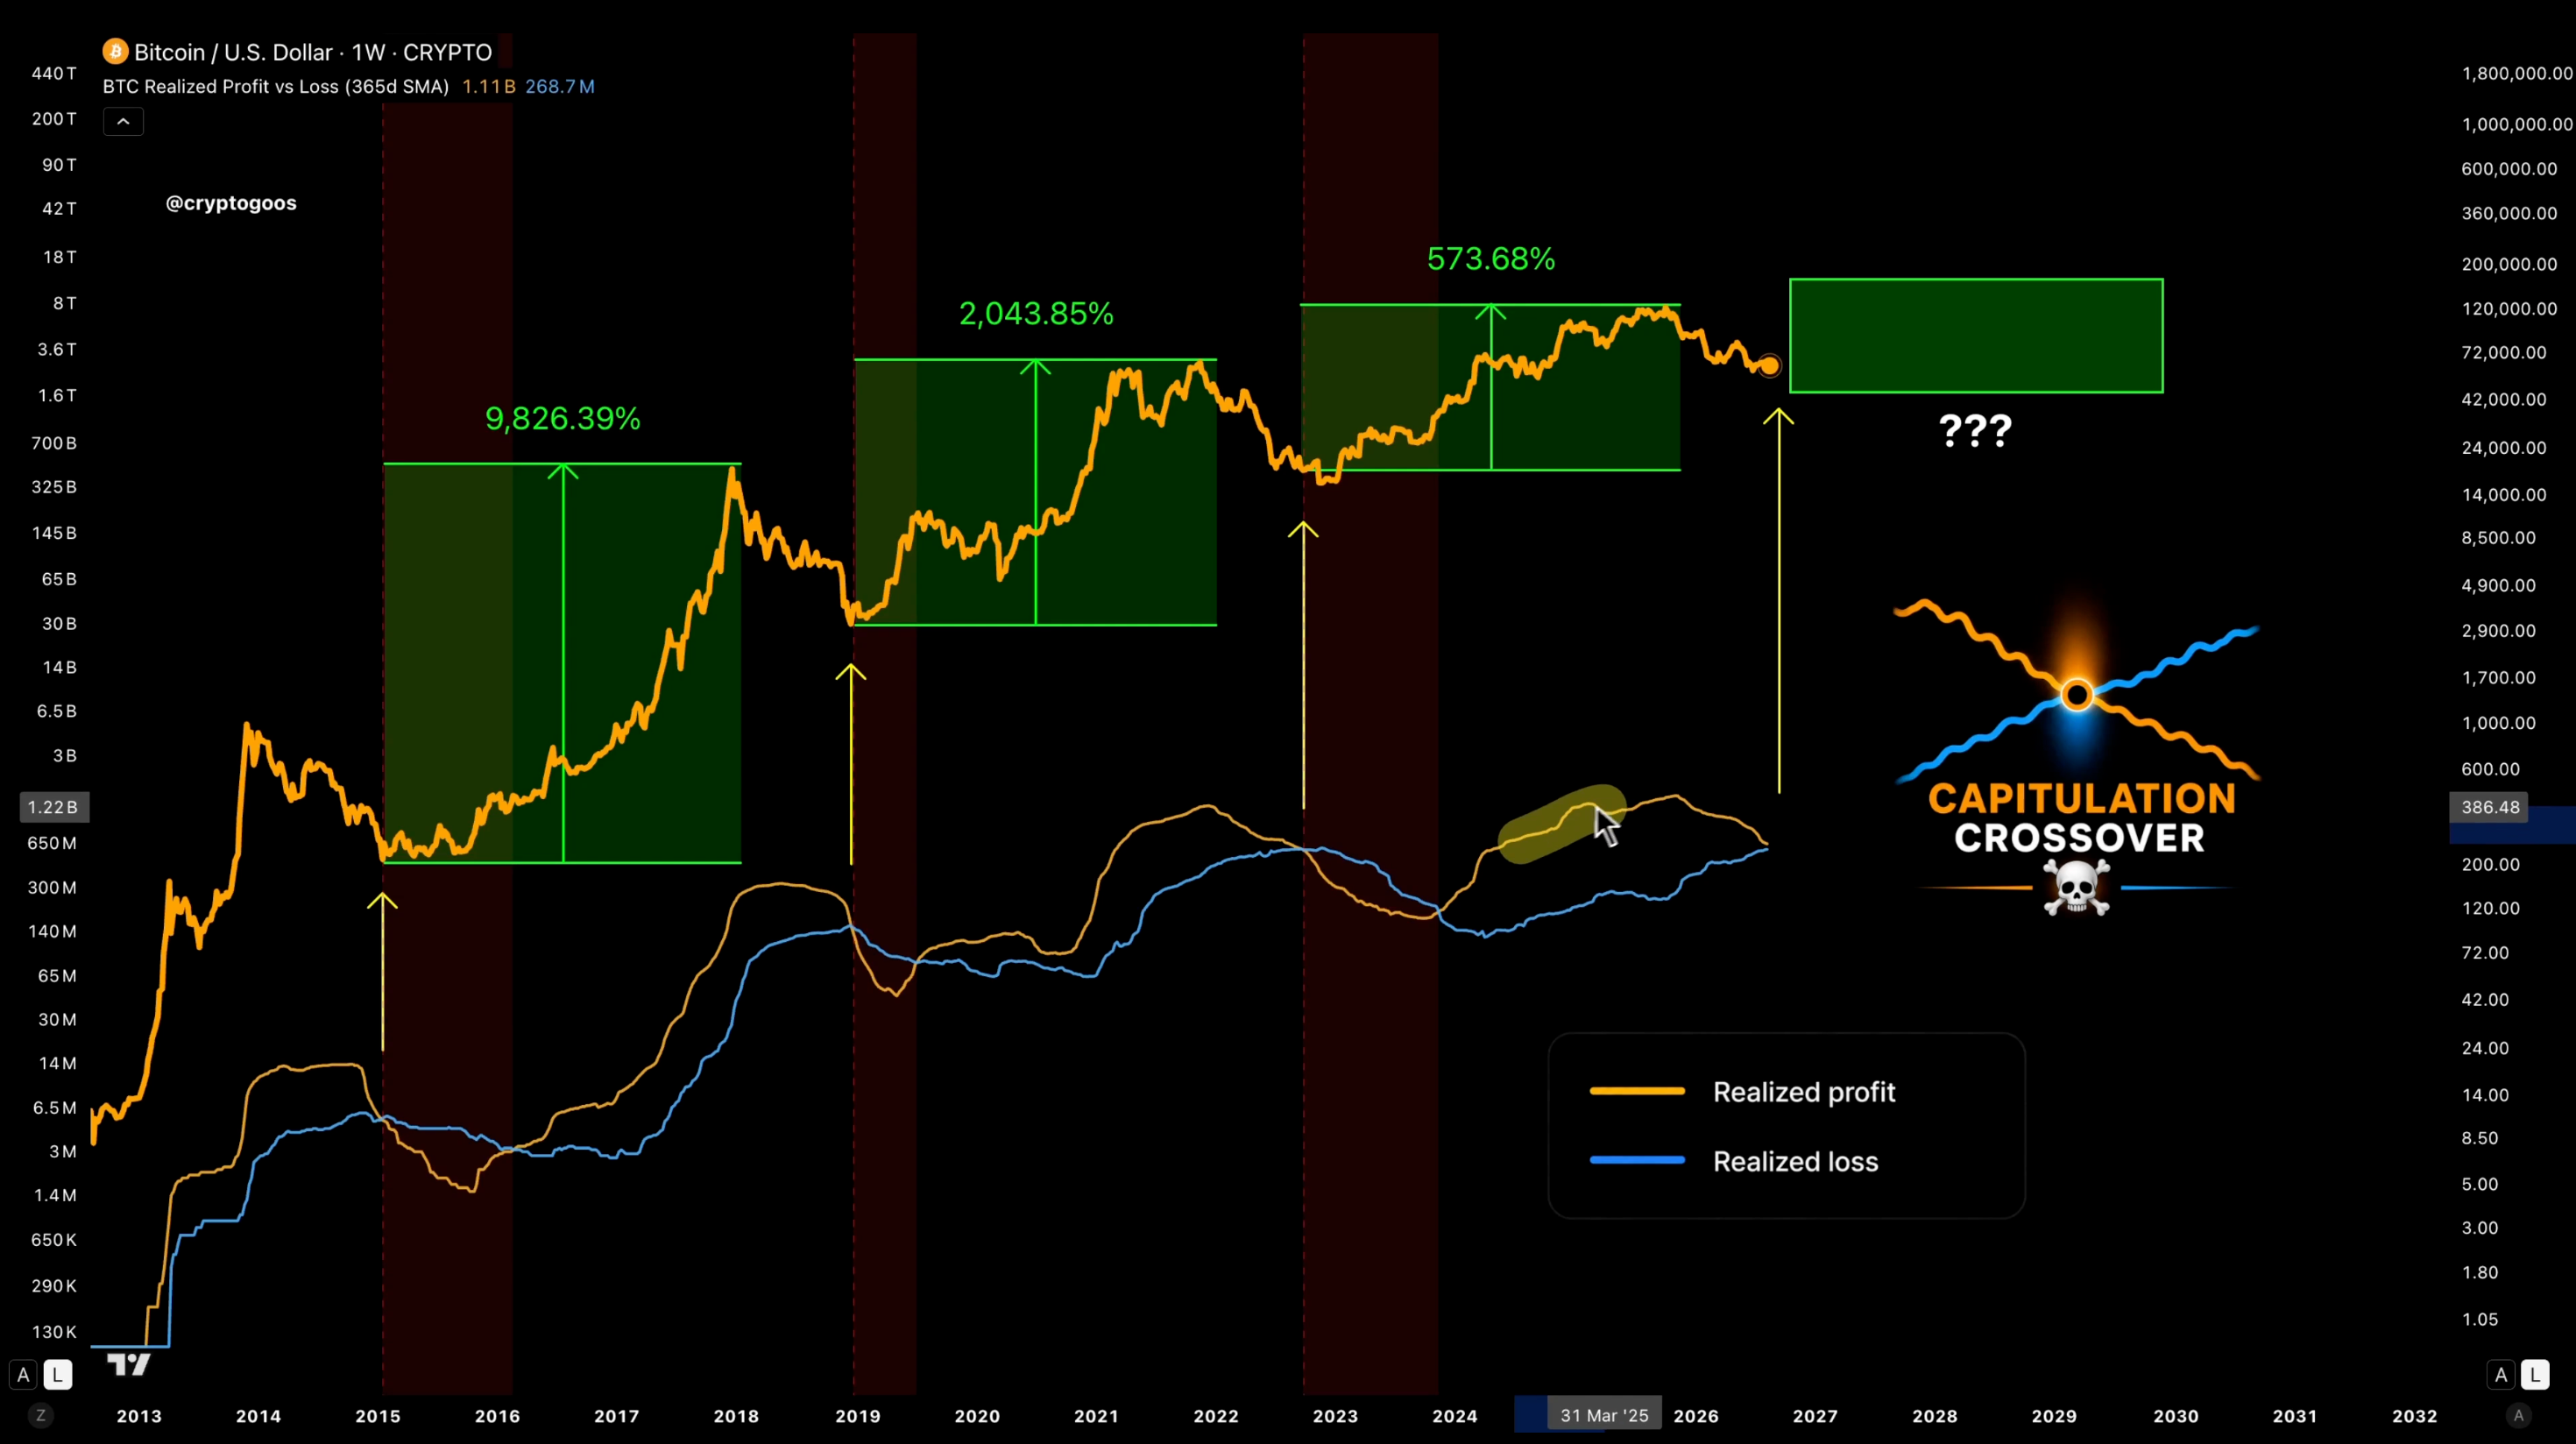
Following those signals, Bitcoin eventually rallied approximately 9,826%, 2,044%, and 574%, respectively, toward subsequent cycle highs.
“Once the capitulation crossover hits, the bottom is usually extremely close, if not already in,” CryptoGoos said.
That works out to an average gain of roughly 4,148%, although the figure is heavily skewed by Bitcoin’s enormous post-2015 rally. The median return across the three periods was closer to 2,044%.
Bitcoin Price Forecast
Every new Bitcoin analysis as it publishes, today's technical signal and key levels, live price — on one page.
See all Bitcoin forecastsBitcoin Fractal Points to $44,000–$51,000
Still, the negative realized P/L reading should be viewed more as evidence of an ongoing capitulation phase than as a definitive Bitcoin bottom signal.
That leaves room for further downside, and Bitcoin’s long-term technical setup suggests the correction may not be over yet.
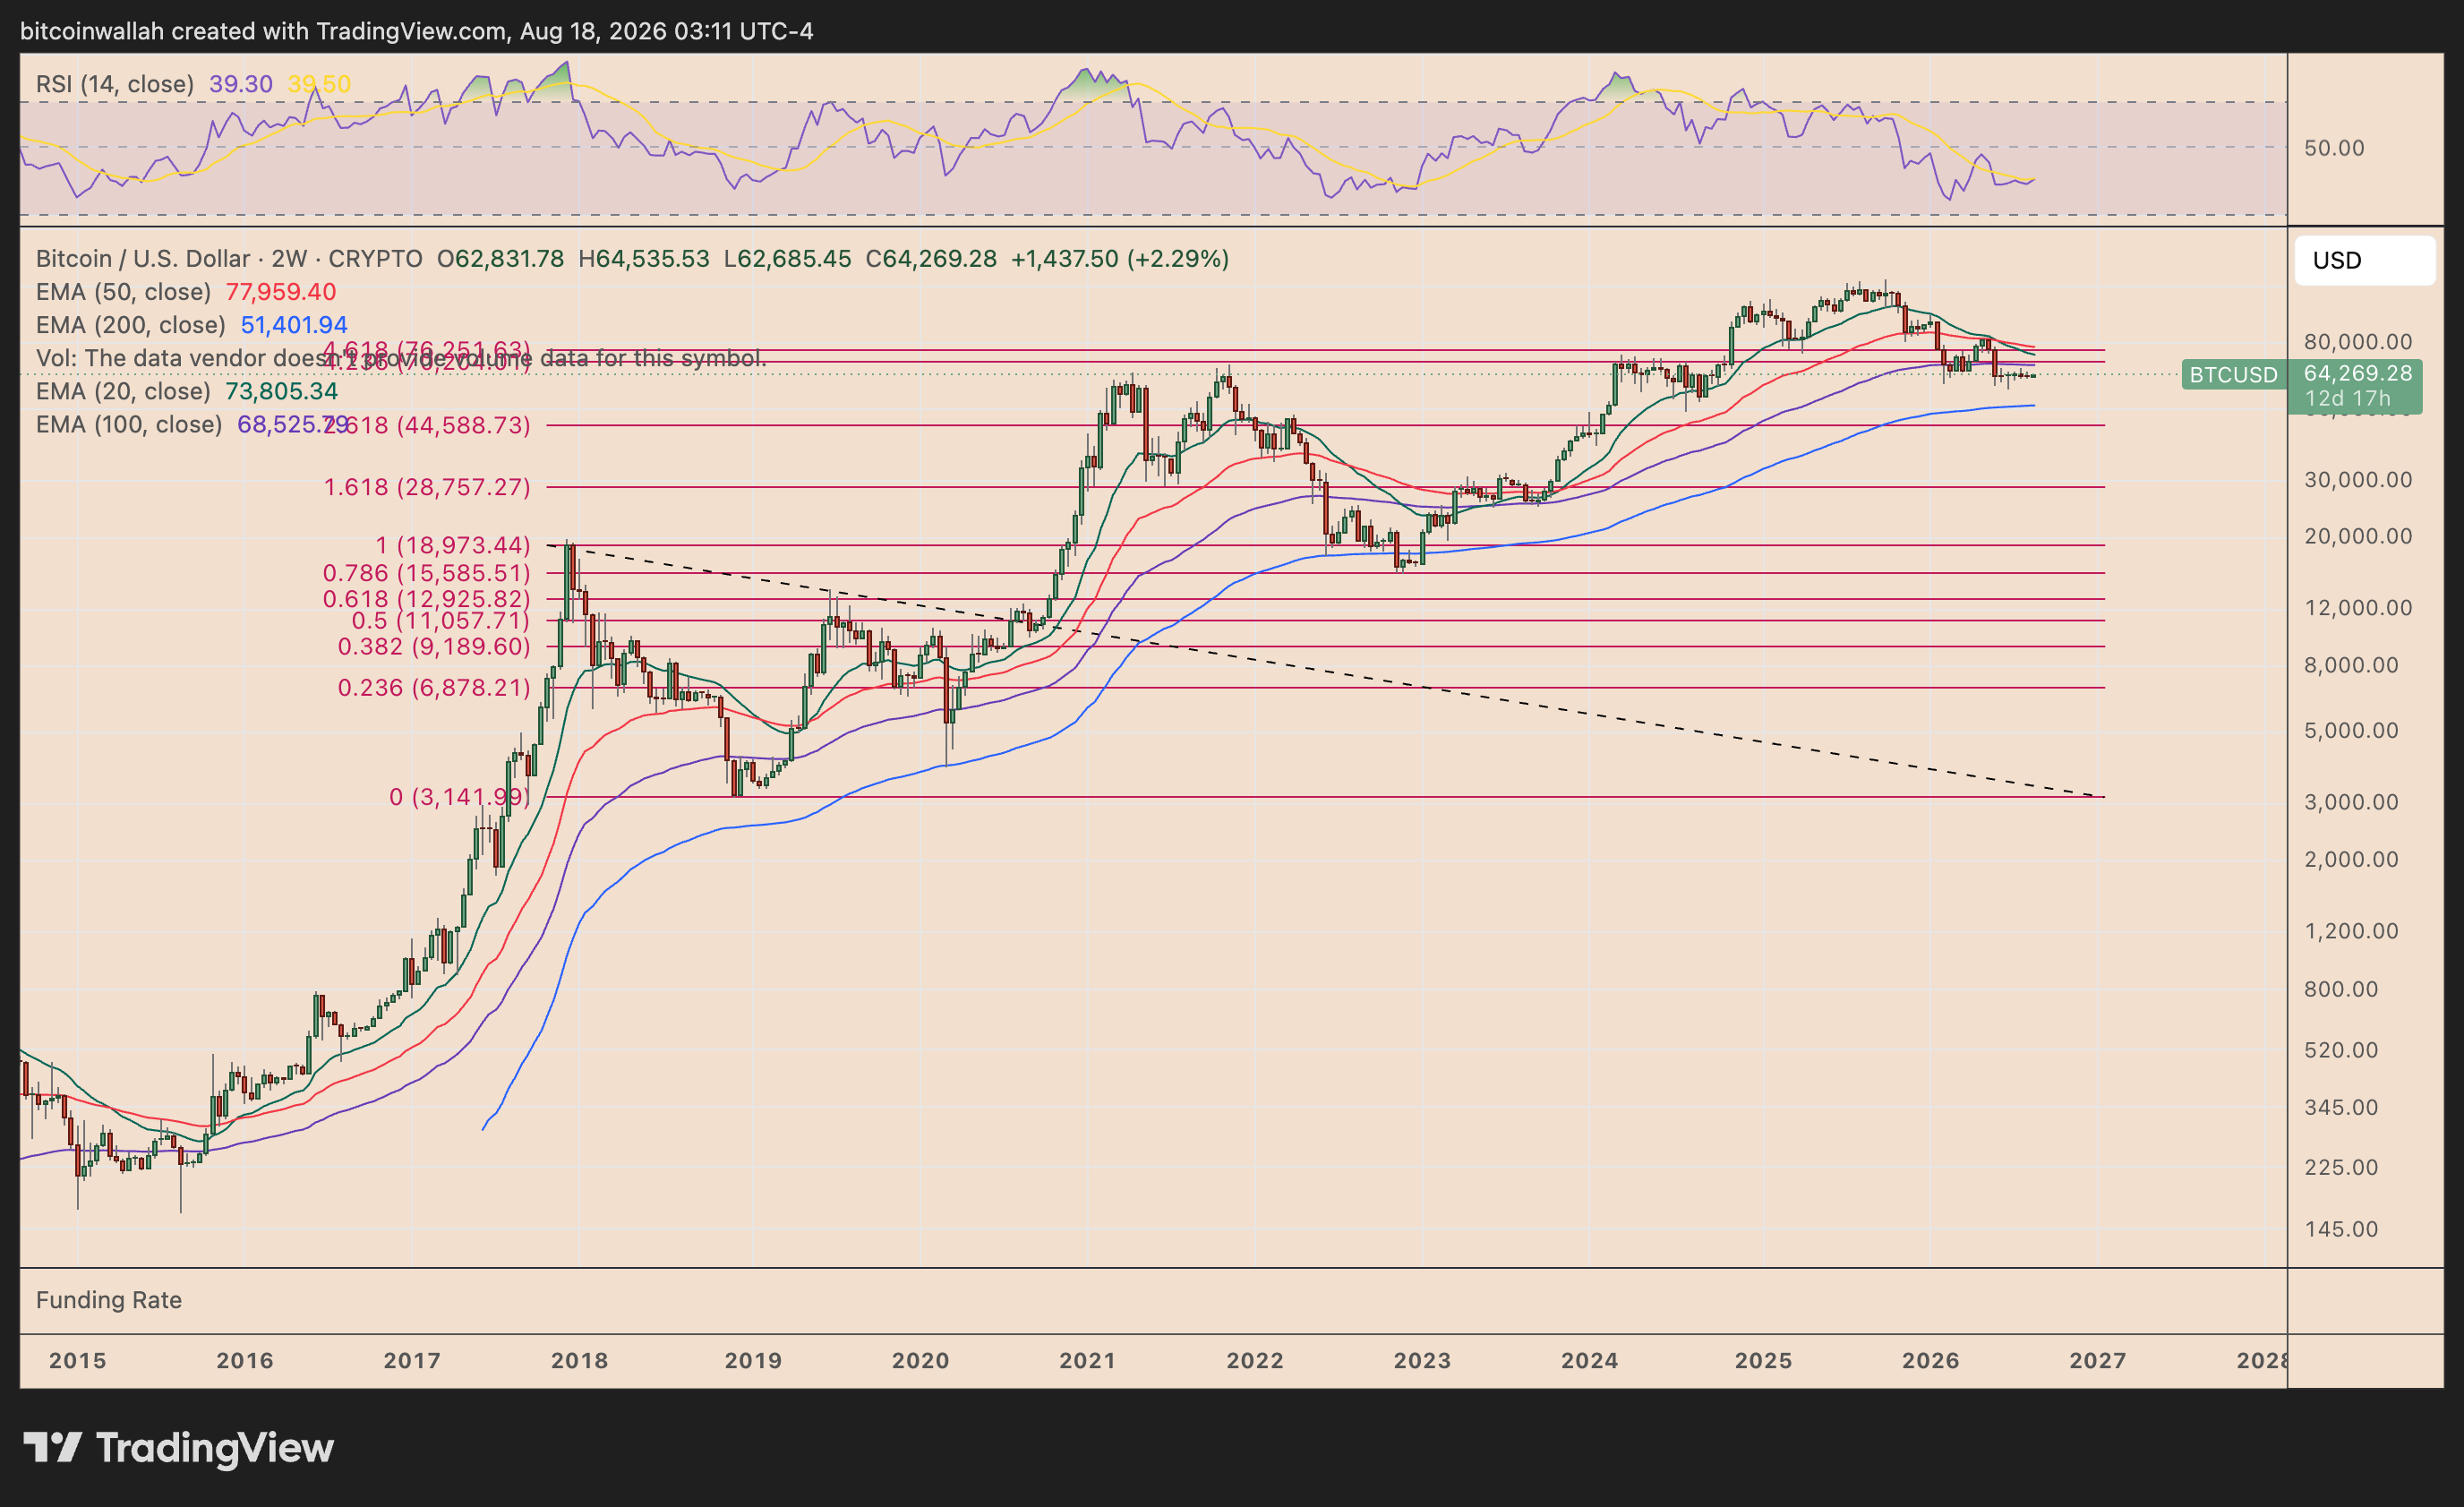
That would imply roughly 20% downside from current levels.
A deeper capitulation could push Bitcoin toward the 2.618 Fibonacci extension near $44,600, about 30% below current prices, particularly if BTC loses the rising 200-period EMA.
Meanwhile, the two-week RSI near 39 remains above oversold territory, leaving room for further weakness before momentum reaches historically depressed levels.