Bitcoin (BTC) was down on Monday as traders awaited the core inflation data, due to release Tuesday, while assessing the worsening US–Iran ceasefire conditions.

SK Hynix Rout Adds Pressure on Bitcoin
The BTC/USD exchange rate dropped more than 2% to around $62,500 ahead of the European session, extending its retreat alongside technology stocks.
US-listed shares of South Korean chipmaker SK Hynix plunged roughly 8%, weighing on semiconductor stocks and pushing US equity futures lower.

SK Hynix is the world’s second-largest memory-chip maker and Nvidia’s (NVDA) main supplier of high-bandwidth memory, a critical component in AI accelerators.
The company controlled about 61% of the global HBM market in 2025, making its stock a key gauge of investor confidence in the AI hardware boom.
The synchronized losses in Bitcoin and semiconductor stocks reflected a wider pullback from risk assets.
Traders were also reducing exposure ahead of Wednesday’s US core inflation report.
A hotter-than-expected reading could strengthen expectations that the Federal Reserve will keep interest rates elevated or consider further tightening, adding pressure on cryptocurrencies and growth-oriented stocks.
Meanwhile, worsening conditions surrounding the US–Iran ceasefire added another layer of uncertainty. Any renewed escalation could lift oil prices, revive inflation concerns, and further weaken demand for risk assets such as Bitcoin.
Bitcoin Price Forecast
Every new Bitcoin analysis as it publishes, today's technical signal and key levels, live price — on one page.
See all Bitcoin forecasts
Bitcoin Rising Wedge Breakdown Targets $58,500
Bitcoin’s four-hour chart shows a breakdown from a rising wedge, a bearish reversal pattern that forms when price climbs between two converging trendlines.
BTC slipped below the wedge’s lower boundary near $63,500 and is now trading under both the 50-4H EMA (red) at $63,247 and the 200-4H EMA (blue) at $63,805.
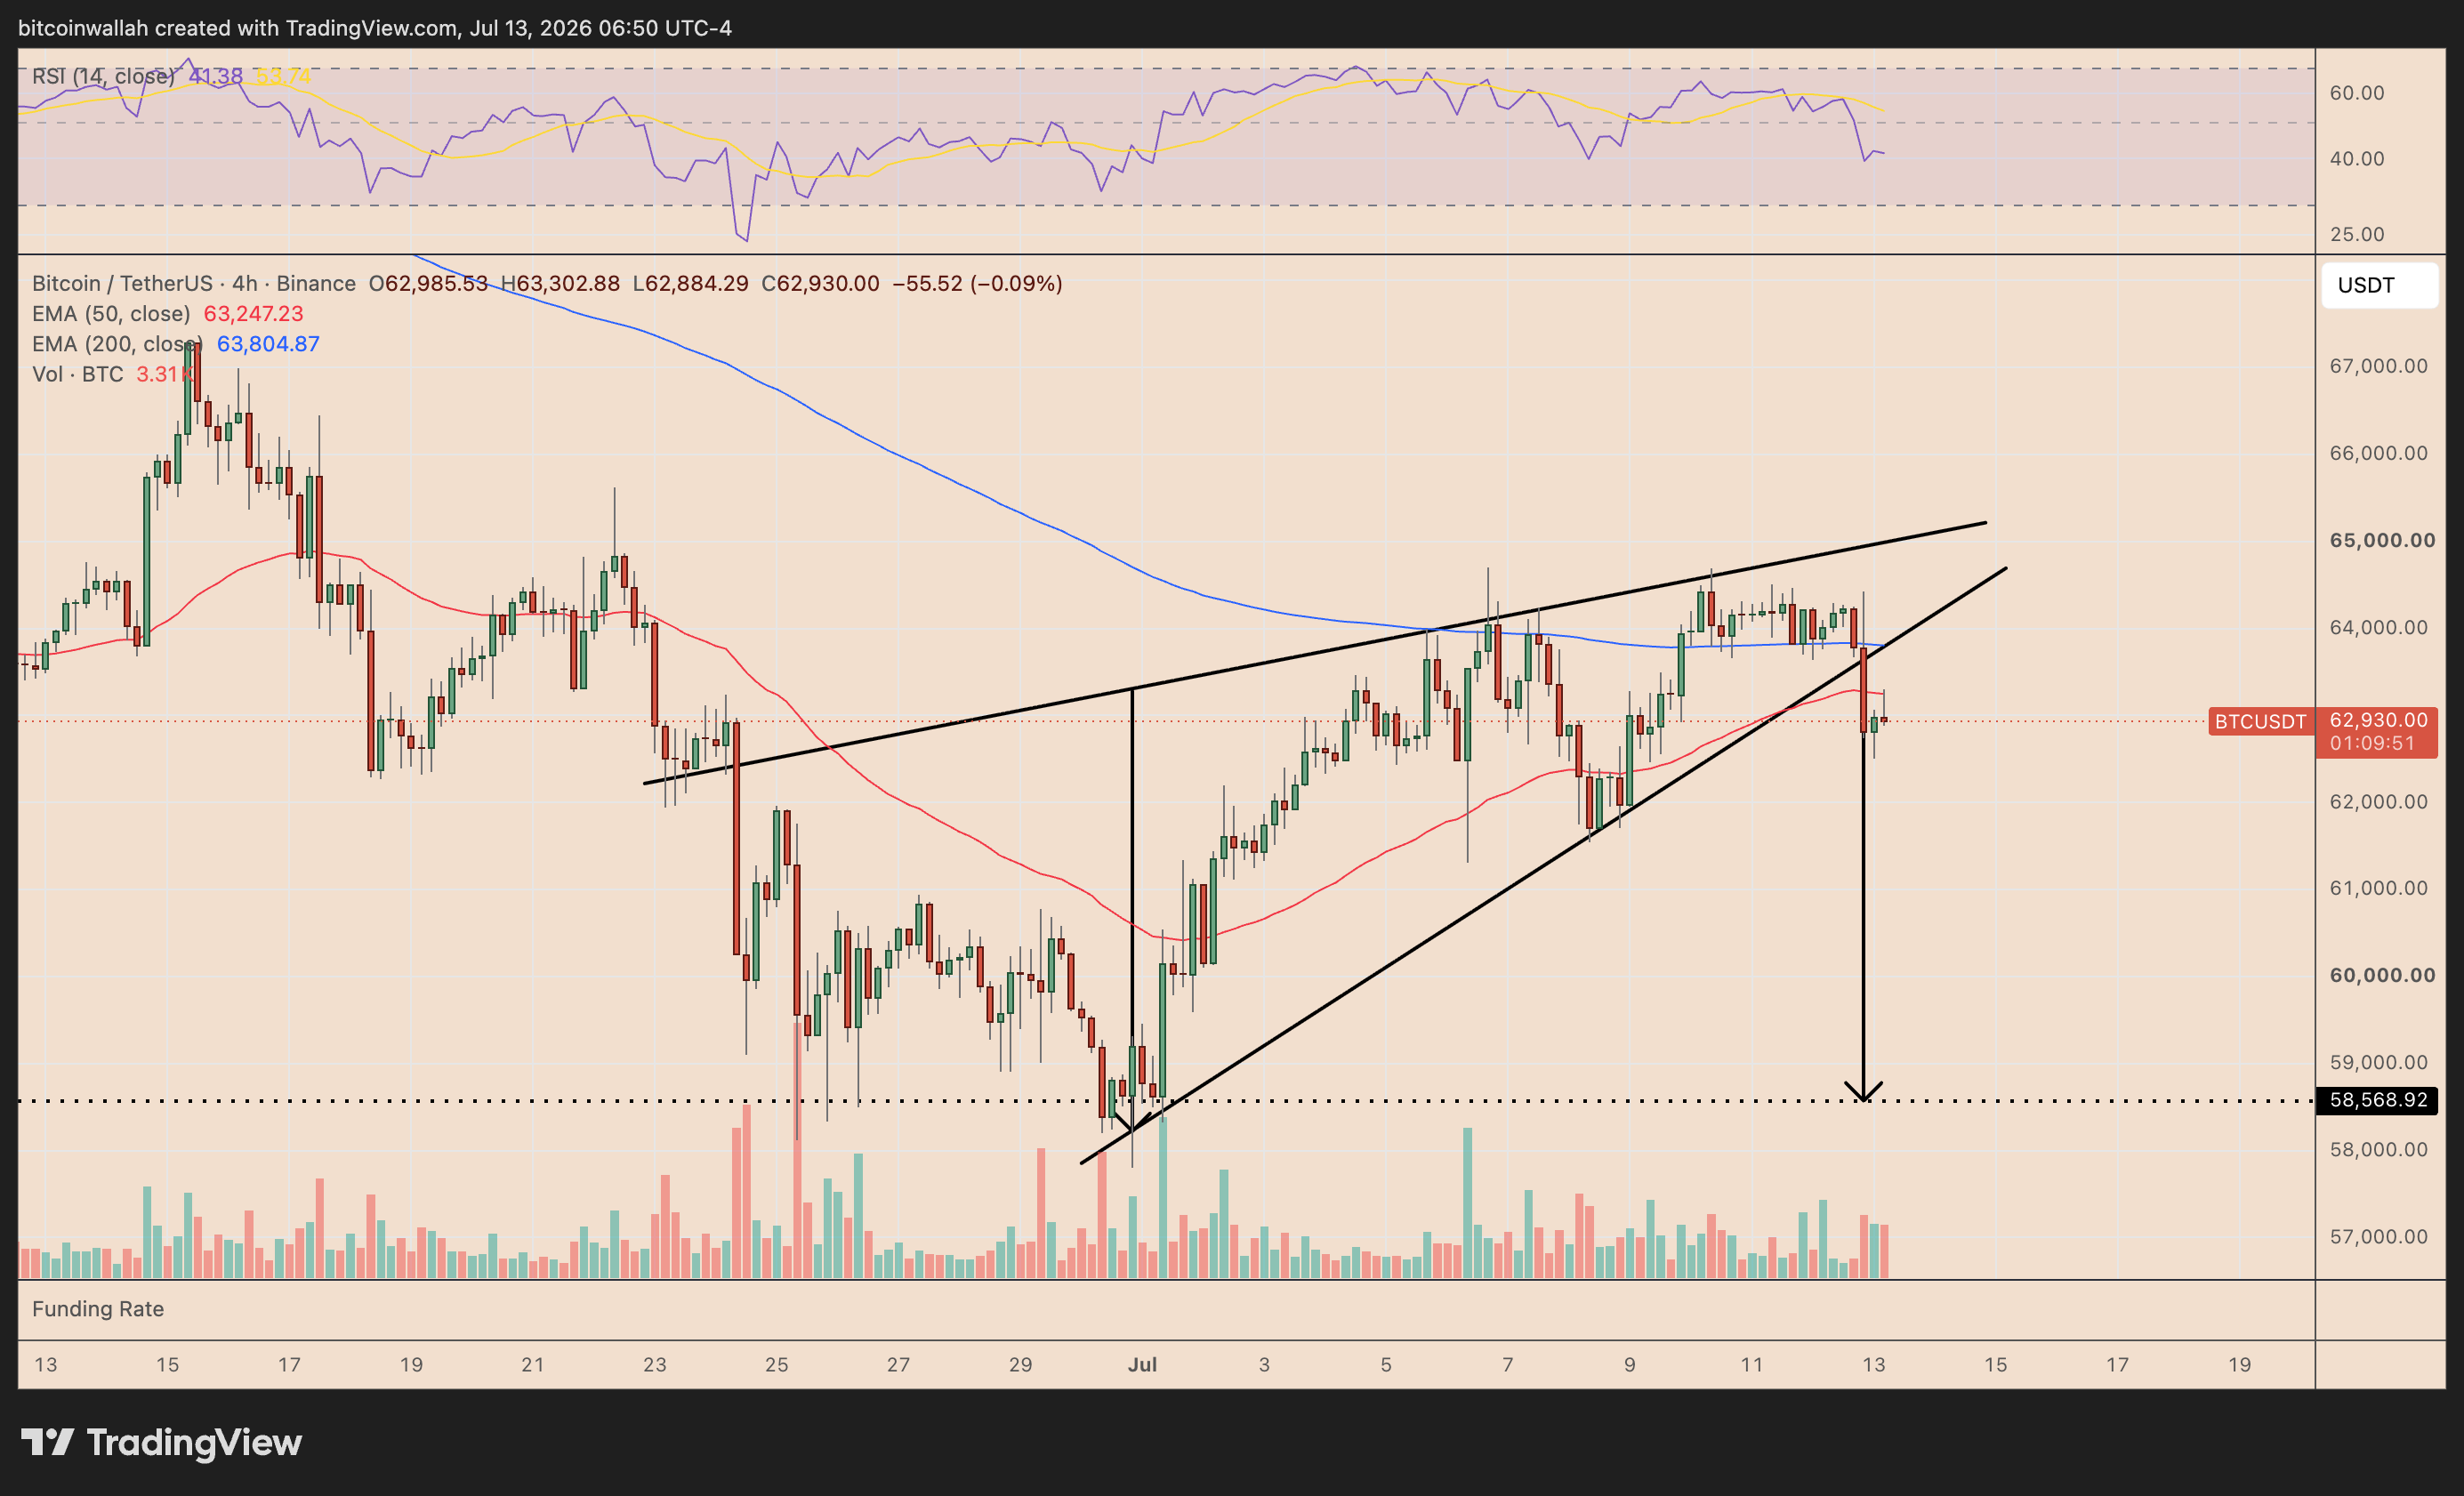
The breakdown puts the wedge’s measured downside target near $58,570 in focus, roughly 7% below current levels.
Momentum also favors sellers, with the relative strength index falling toward 41 and displaying room for further declines toward the oversold threshold reading of 30.
A recovery above $64,000 would weaken the bearish setup and reopen the path toward $65,000. Otherwise, the broader correction may continue into mid-July.