
Bitcoin (BTC) is showing three technical signals that closely resemble its recovery from the 2022 bear-market bottom, strengthening the case for a rally toward $100,000 in 2026.
Here are the three reasons why.

1. Bitcoin Is Repeating Its 2022 RSI Fractal
The first similarity comes from Bitcoin’s weekly relative strength index (RSI).
Near the November 2022 bottom, BTC continued forming lower or flat price lows while its weekly RSI began making higher lows. The divergence suggested that downside momentum was weakening even though Bitcoin remained under selling pressure.
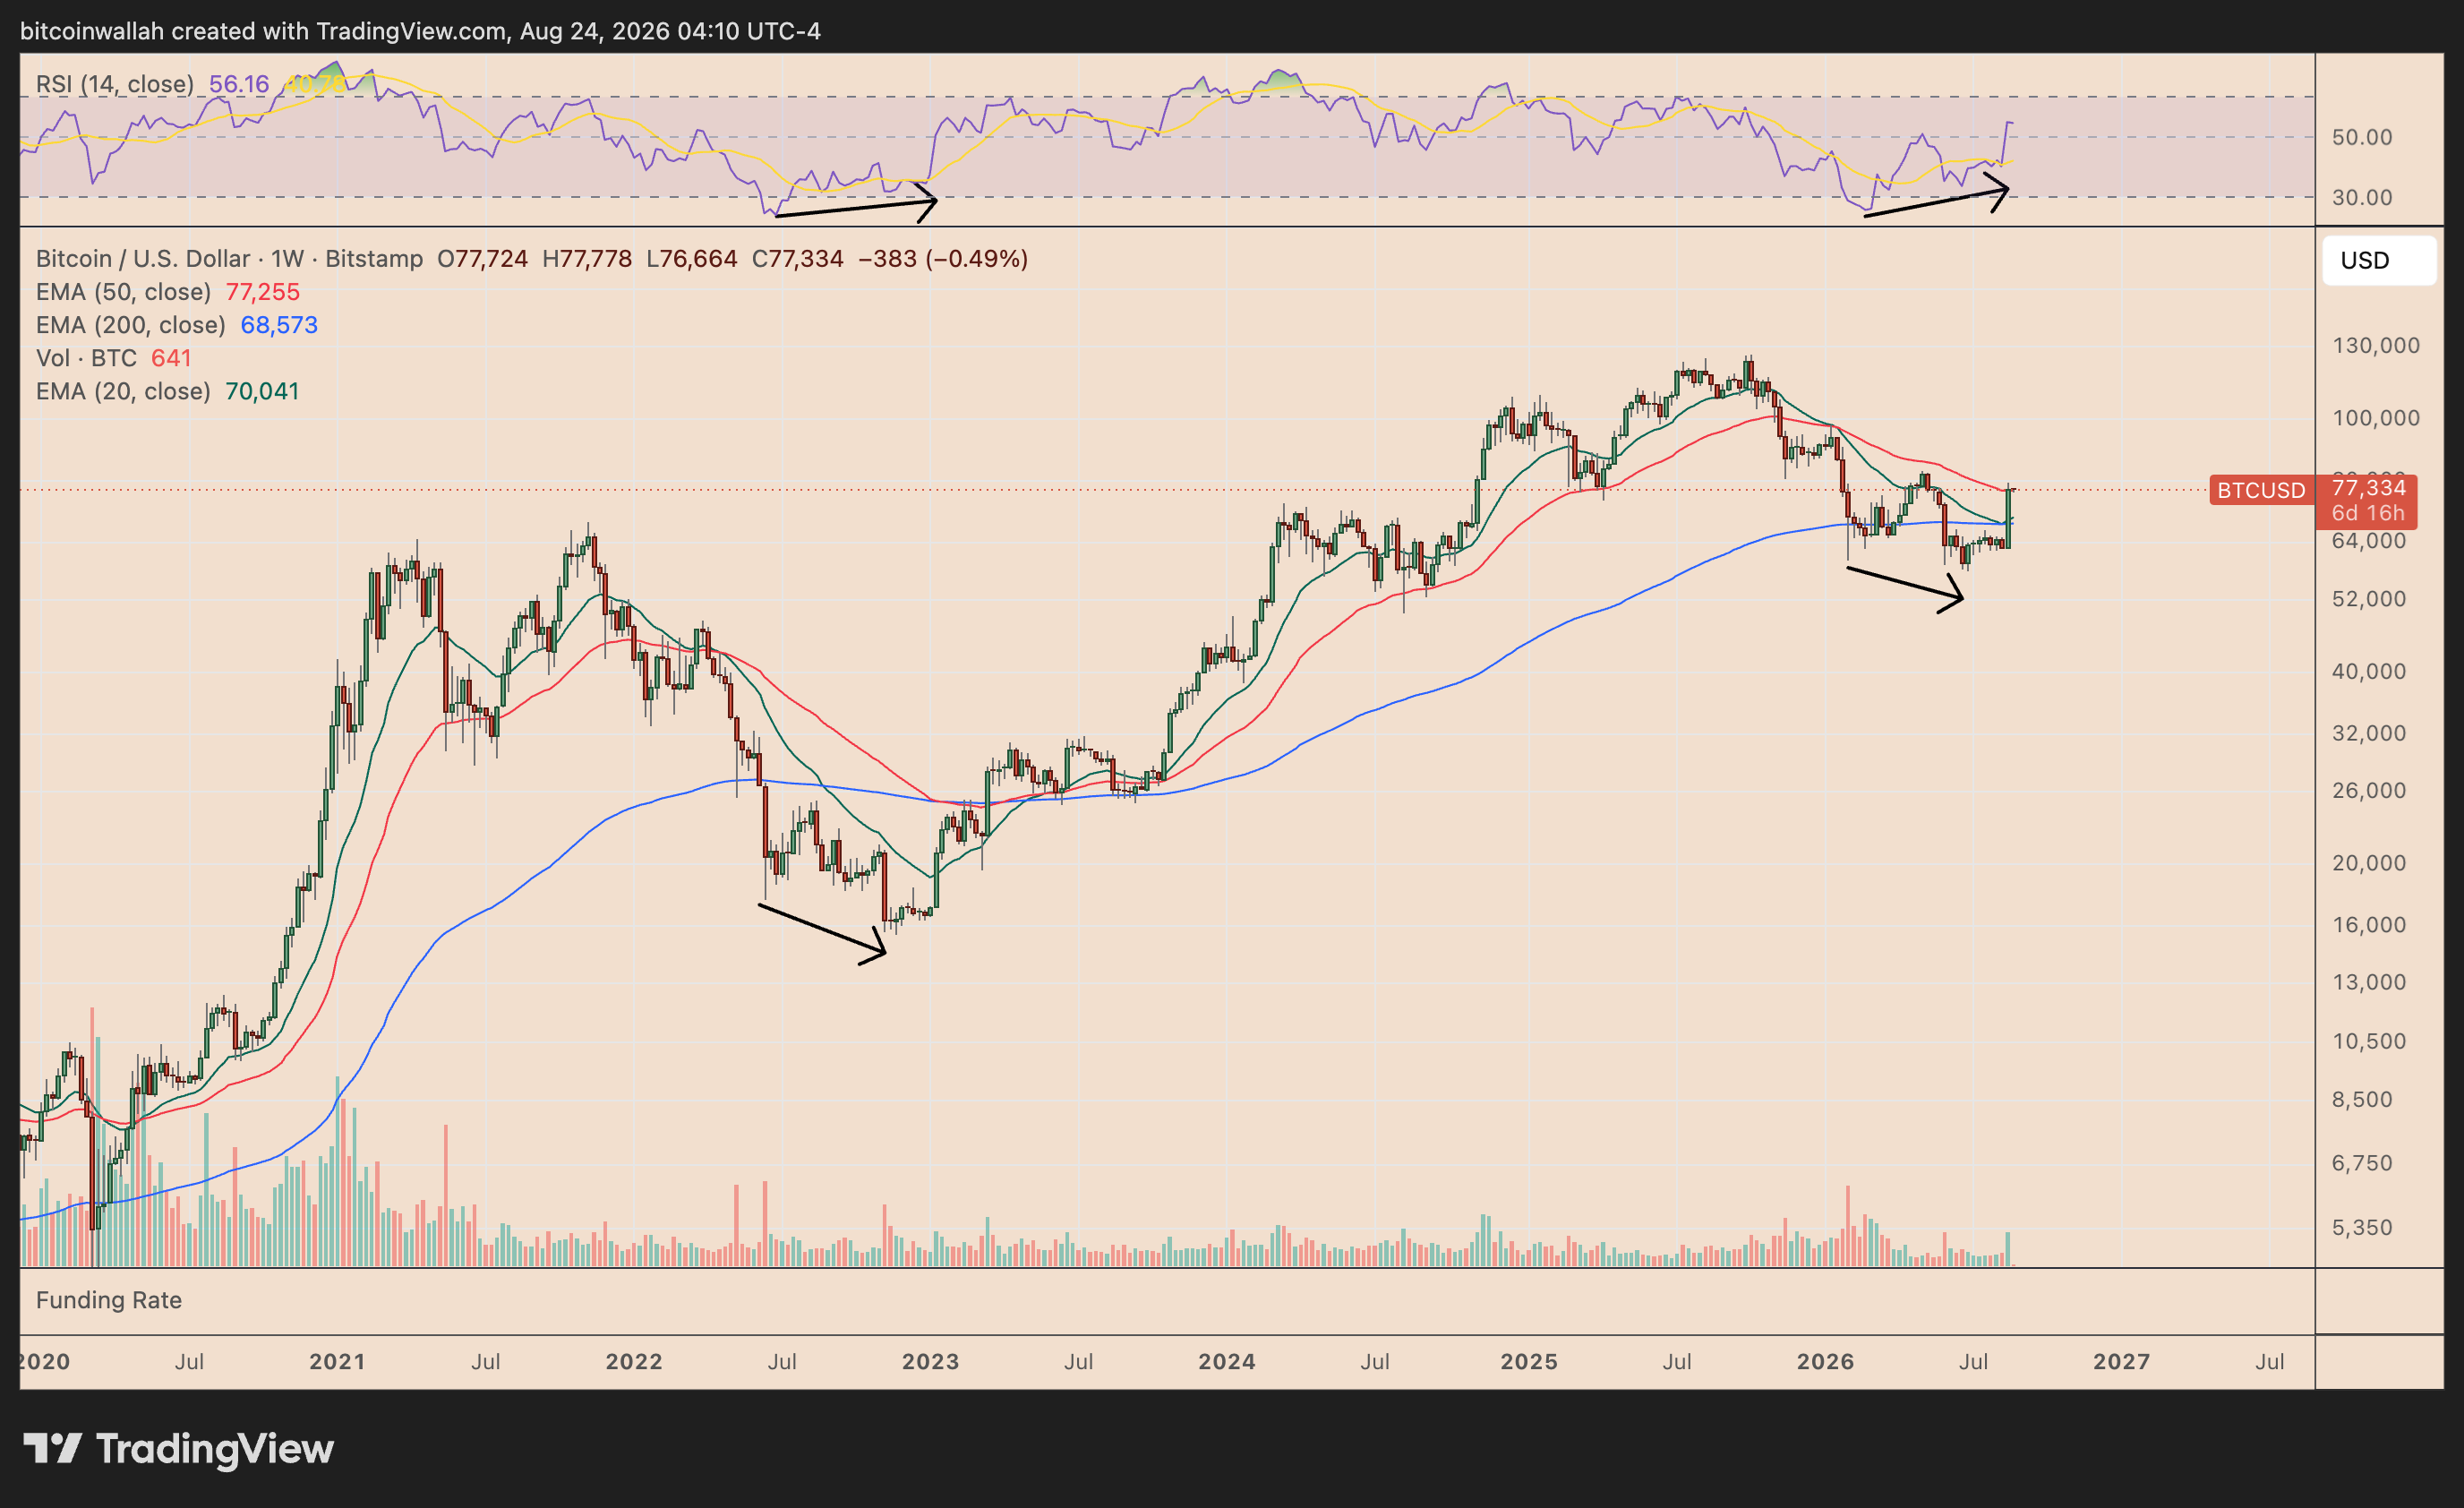
In both cases, the RSI reversal emerged while the indicator was hovering near historically oversold territory, suggesting sellers were gradually losing control.
That does not guarantee that Bitcoin has established another macro bottom, but the momentum structure looks remarkably similar.
Bitcoin Price Forecast
Every new Bitcoin analysis as it publishes, today's technical signal and key levels, live price — on one page.
See all Bitcoin forecasts2. BTC Just Delivered Another Massive Weekly Pump
The second similarity is the strength of Bitcoin’s rebound.
BTC surged roughly 22% in a single week during its recovery from the 2022 bottom. That move helped confirm the momentum reversal and eventually preceded a much larger advance.
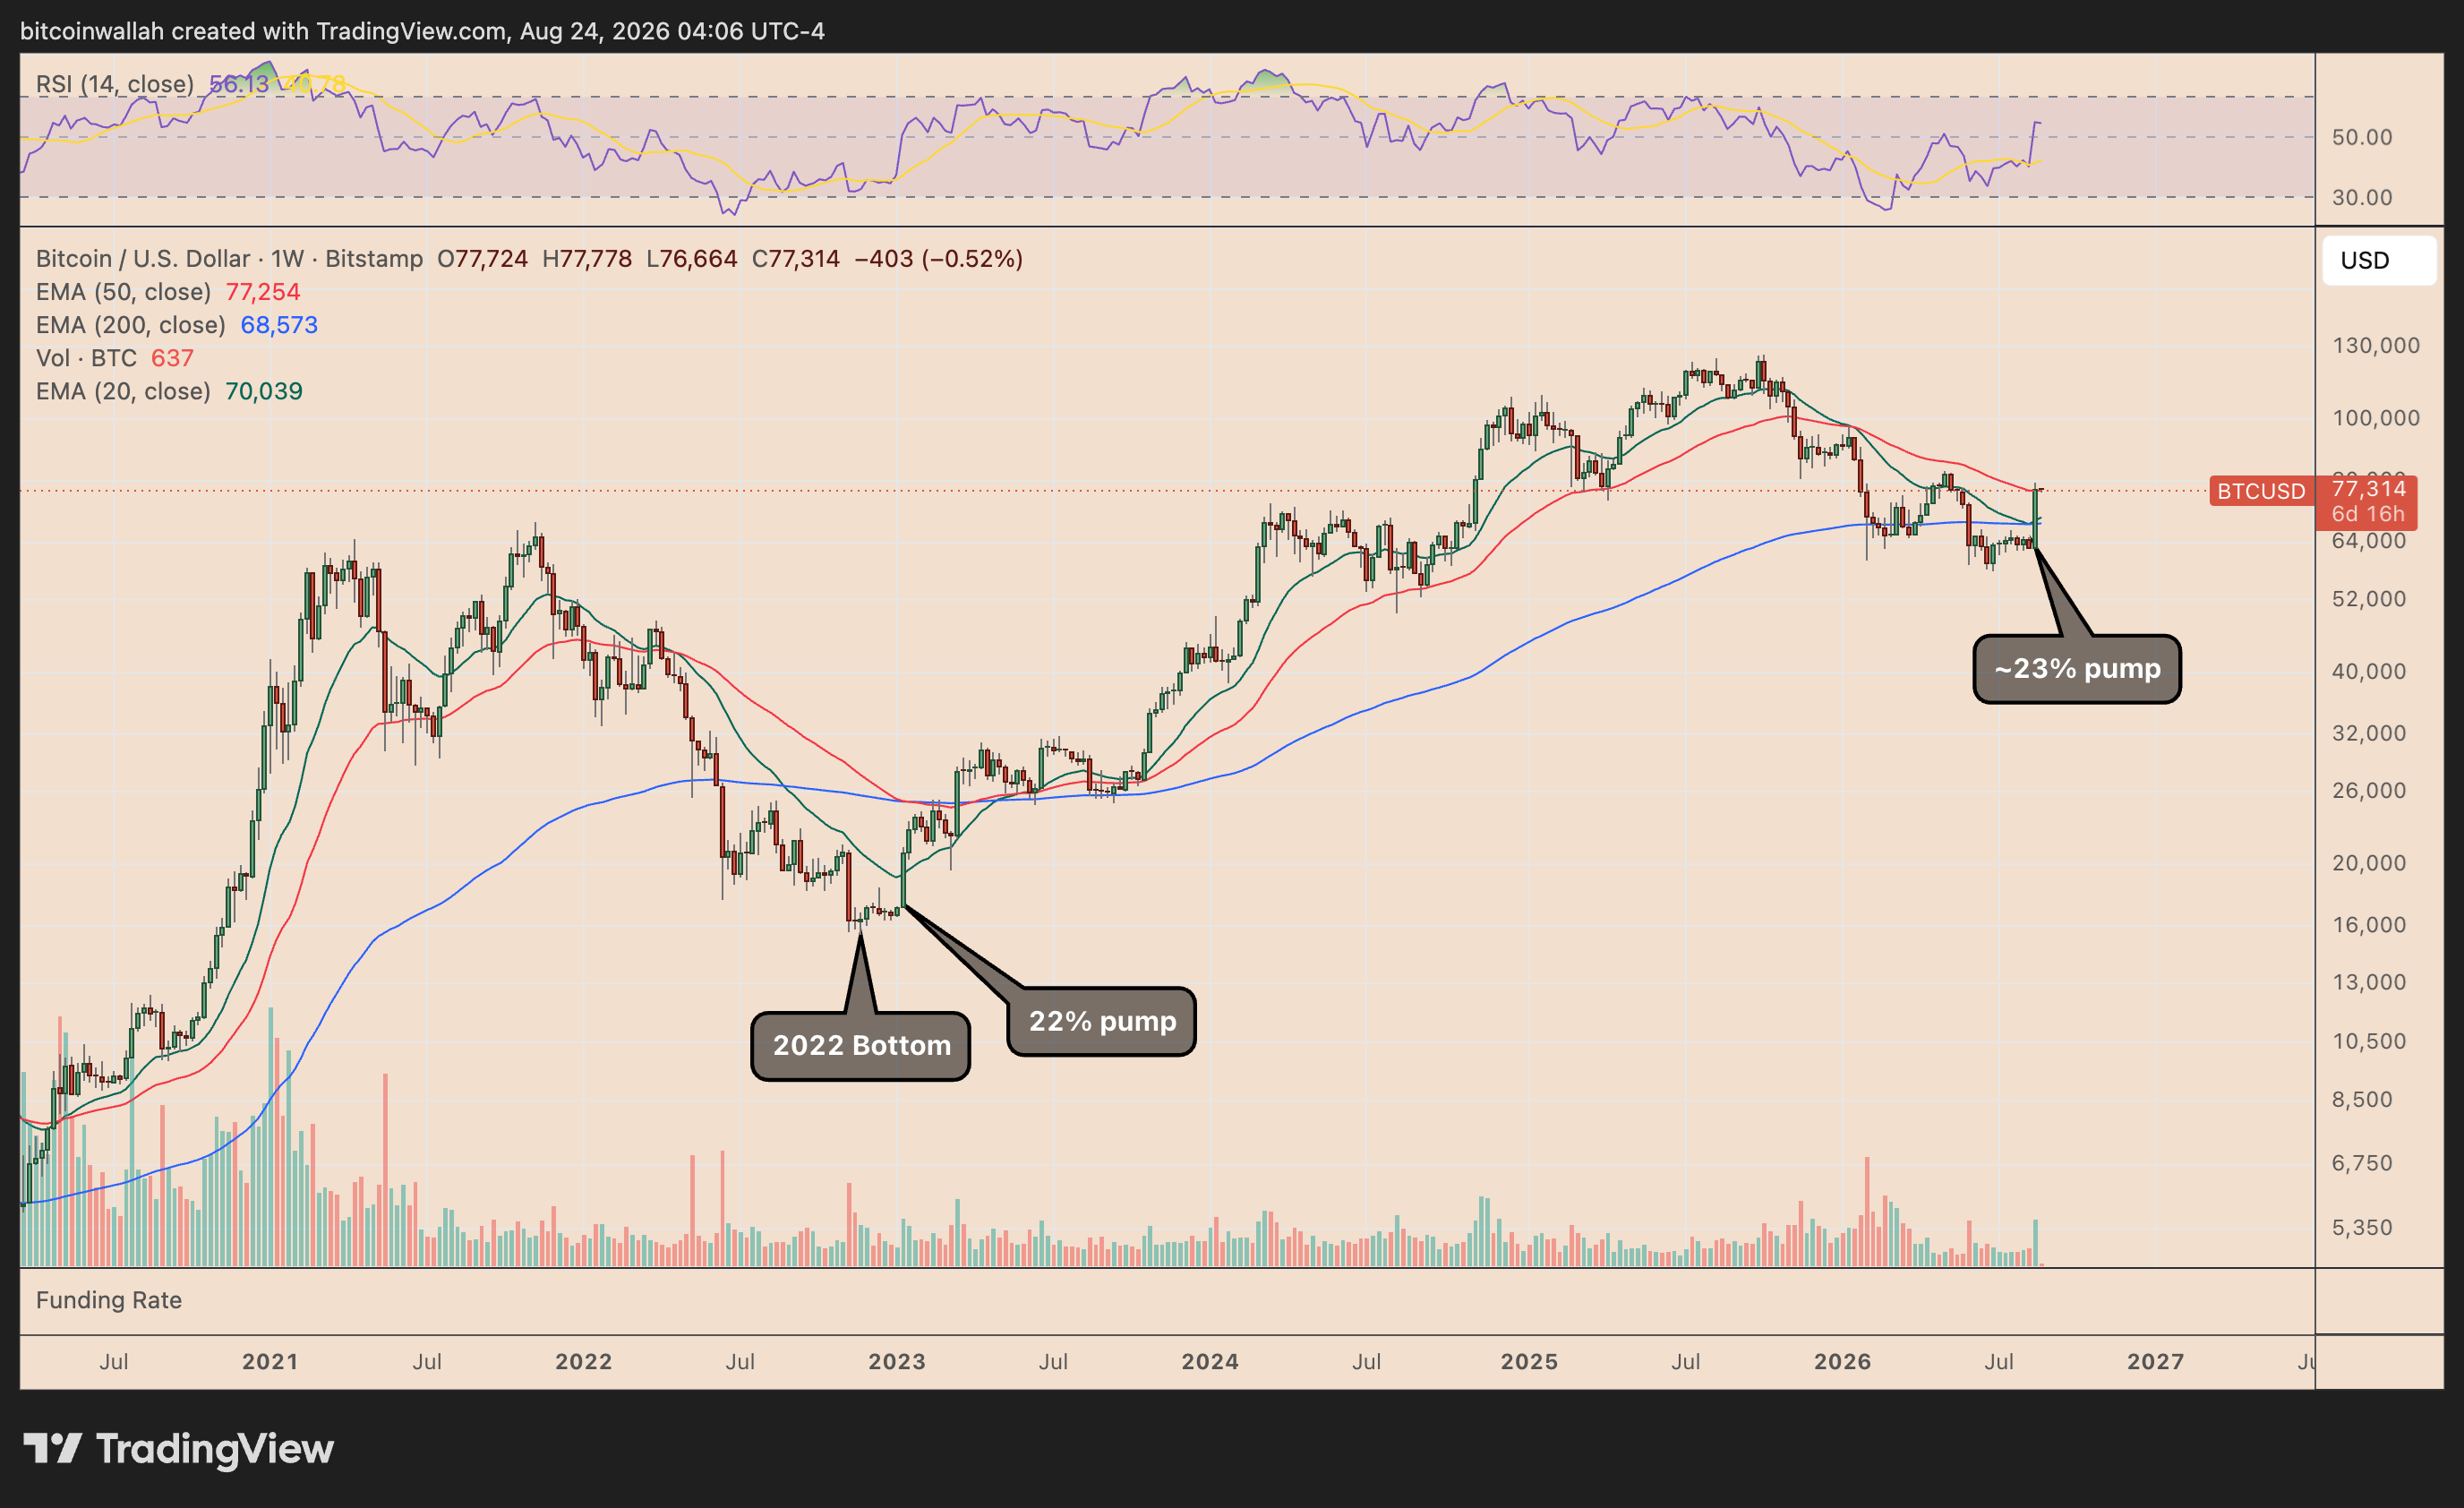
Bitcoin has now produced an almost identical reaction, rebounding approximately 23% from its recent lows at the strongest point of the move.
The near-identical weekly gains make the current setup particularly notable.
Both rallies also occurred after prolonged declines and RSI divergence signals, suggesting Bitcoin may again be transitioning from capitulation toward a broader recovery phase.
3. Bitcoin Has Reclaimed a Key Fibonacci Support
The third bullish signal comes from Bitcoin reclaiming its 0.236 Fibonacci retracement level near $74,000.
BTC was trading around $77,700 on Aug. 24, putting the cryptocurrency firmly above the Fib level and its 20-week exponential moving average near $70,000.
Holding $74,000 as support could expose the next Fibonacci targets at approximately $84,000 and $92,000.
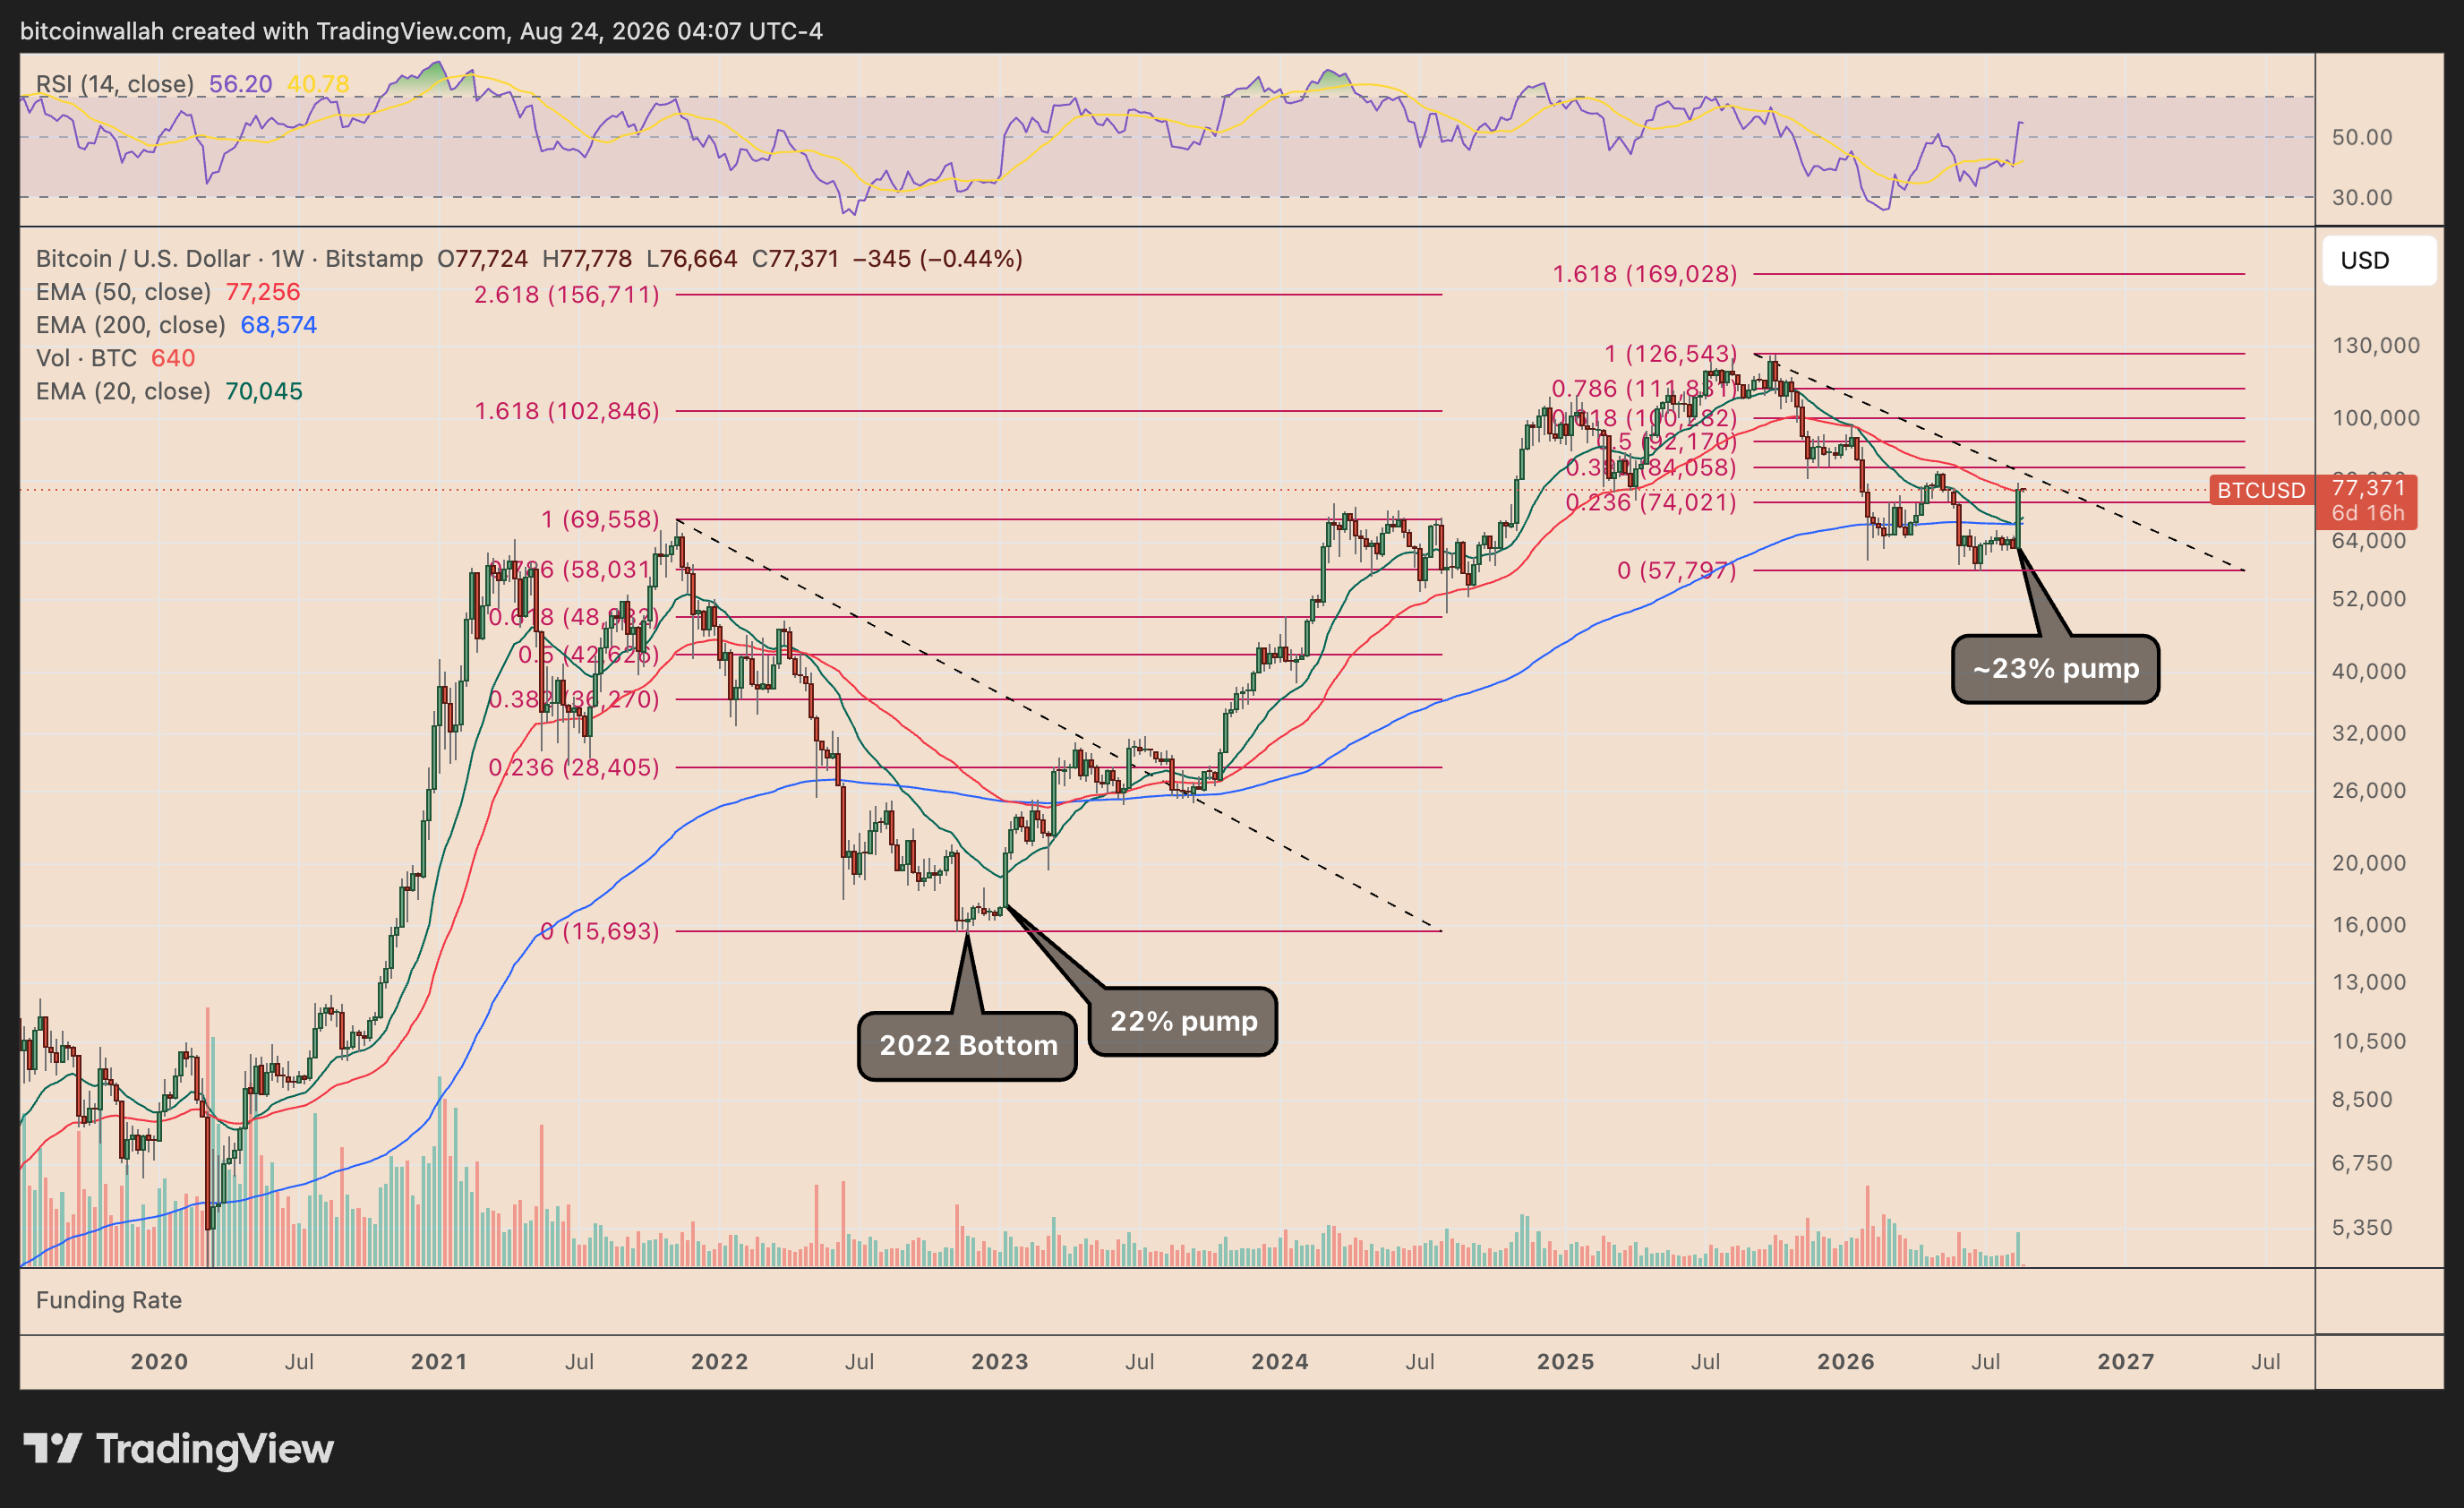
The most important level sits near $100,300, corresponding with Bitcoin’s 0.618 Fib retracement.
That would represent roughly 29% upside from current levels.
Still, the bullish outlook comes with a warning. Bitcoin’s weekly RSI may be developing a bearish divergence as price rebounds, suggesting momentum could weaken if BTC fails to sustain the breakout.
A drop back below $74,000 would weaken the $100,000 fractal scenario, while losing the 20-week EMA near $70,000 would increase the risk of a deeper correction.