Key Insights:
- On Wednesday, bitcoin (BTC) slipped by 0.47% to end the day at $16,845.
- Profit-taking from the bullish Tuesday session left BTC in the red as investors consider the SBF extradition to the US.
- The Fear & Greed Index rose from 26/100 to 28/100 despite BTC failing to revisit $17,000.
On Wednesday, bitcoin (BTC) slipped by 0.47%. Partially reversing a 2.90% rally from Tuesday, BTC ended the day at $16,845. Notably, BTC failed to revisit $17,000 for the fourth time in five sessions.
A mixed start to the day saw BTC rise to an early morning low of $16,934. However, coming up short of the First Major Resistance Level (R1) at $17,189, BTC fell to an early afternoon low of $16,750. Steering clear of the First Major Support Level (S1) at $16,536, BTC found late support to reduce the deficit for the session.

FTX and Sam Bankman-Fried Swamp the Headlines to Test Sentiment
Following the bullish Tuesday session, investors were more cautious on Wednesday. News of the SBF extradition to the US raised concerns, with US lawmakers likely to delve deeper into the digital asset space. We also expect lawmakers to explore the relationship between FTX and Binance.
Last week, news of US authorities planning to charge Binance with financial crimes weighed on investor sentiment. The Senate Banking Committee also held a hearing last week to discuss the demise of FTX. Lawmakers raised concerns over the dominance that Binance has in the digital asset space.
SBF testimony could place Binance back in the spotlight and increase lawmaker scrutiny.
The BTC decoupling from the NASDAQ Index reflected the shift in focus away from US economic indicators and corporate earnings. The NASDAQ Index rose by 1.54% on Wednesday, supported by better-than-expected consumer confidence figures and upbeat corporate earnings. Nike (NKE) and FedEx (FDX) quarterly earnings delivered support.
Today, FTX updates will remain a focal point, with US economic indicators likely to draw interest. Barring a revision to Q3 GDP numbers, the weekly jobless claims could move the dial. The NASDAQ mini was up 32.75 points this morning, providing early support.
Bitcoin Price Forecast
Every new Bitcoin analysis as it publishes, today's technical signal and key levels, live price — on one page.
See all Bitcoin forecasts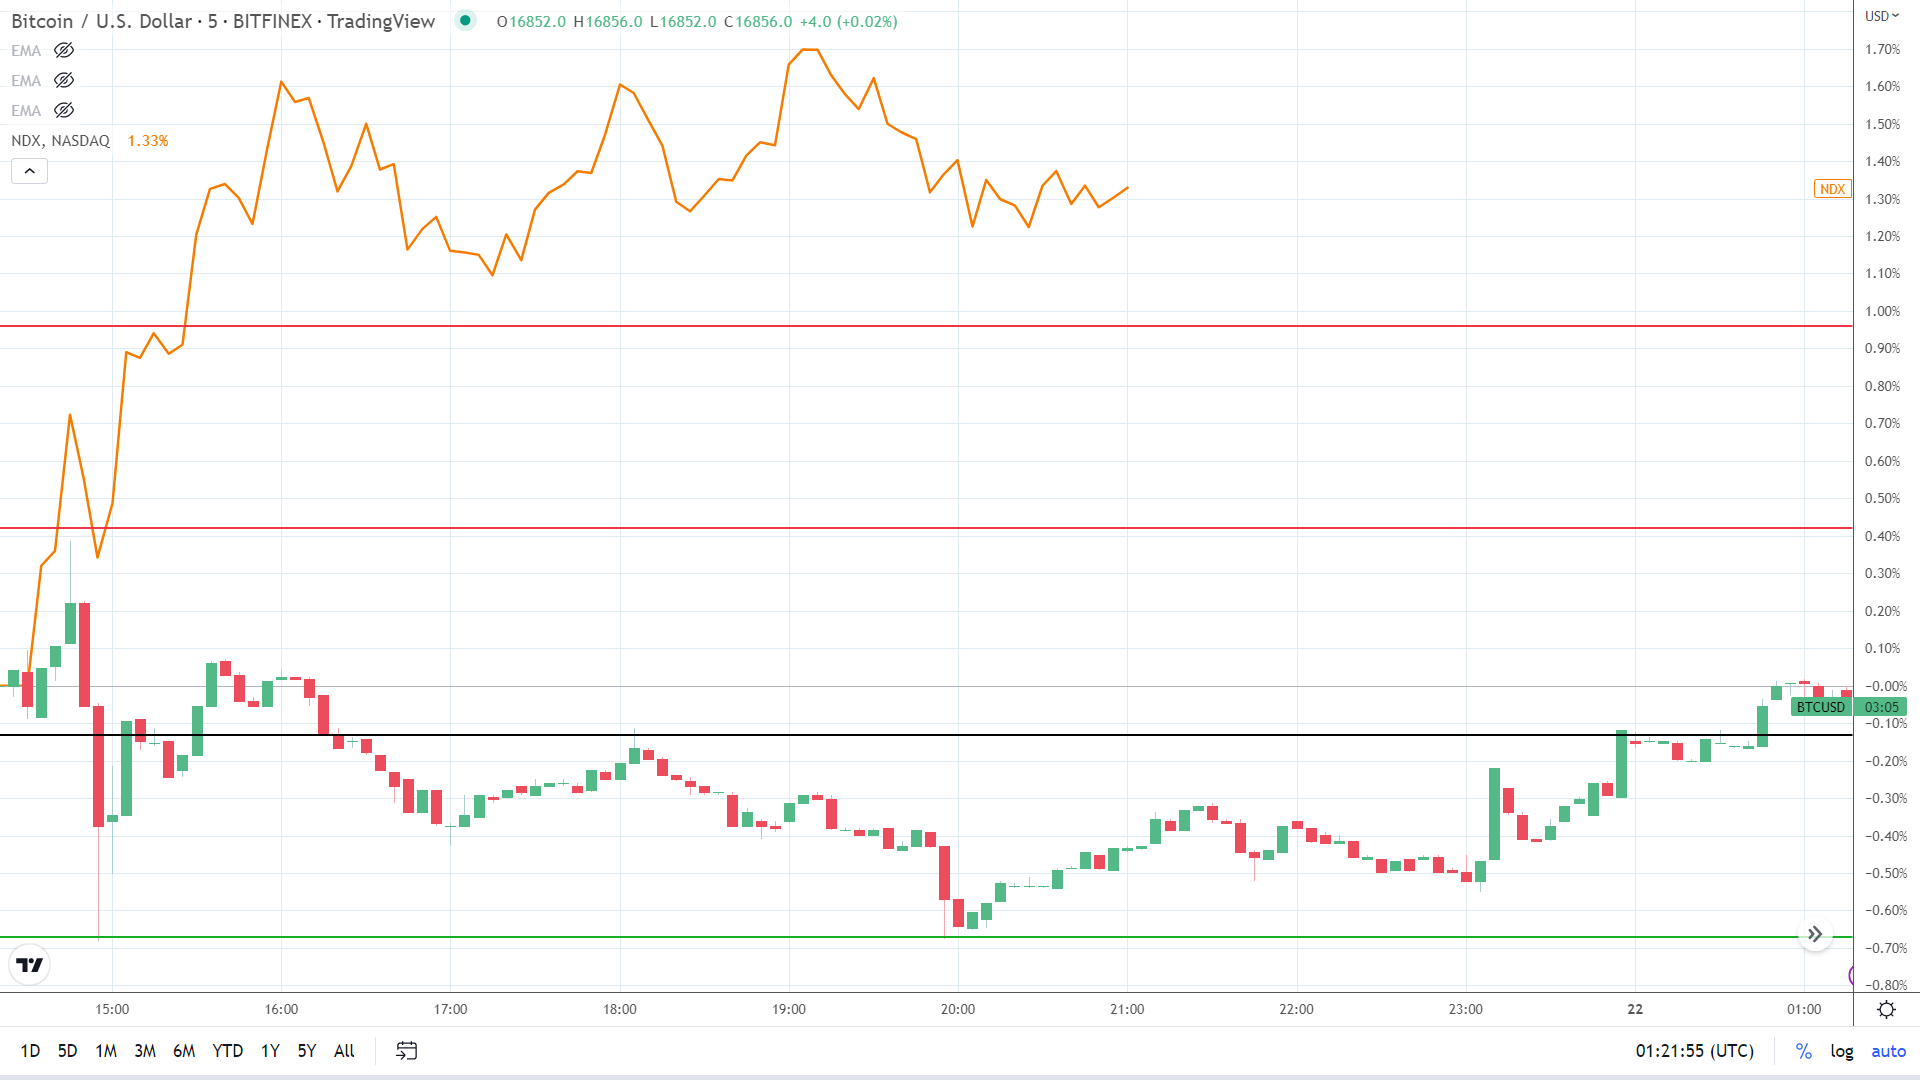
The Fear & Greed Index Rises to 28/100 to Signal a Bullish Thursday
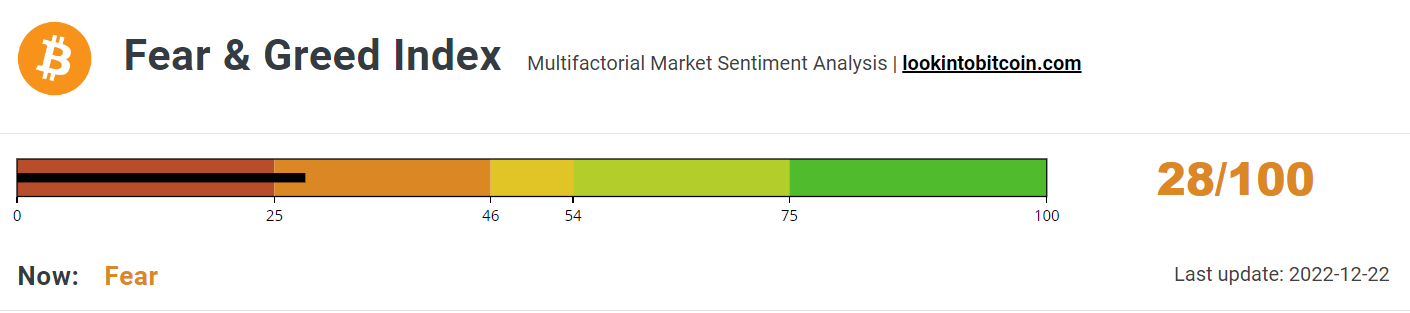
Today, the BTC Fear & Greed Index rose from 26/100 to 28/100, despite BTC failing to revisit $17,000.
Market focus on FTX and the SBF extradition left BTC on the back foot. However, US economic indicators and corporate earnings provided hopes of a soft landing, supporting investor sentiment.
Over the near term, SBF testimony will likely remain a market focal point. However, regulatory chatter and US economic indicators will continue to provide direction.
Avoiding sub-20/100 remains the key near-term. The bulls will need to target the pre-FTX collapse November 6 high of 40/100 to support a BTC run at $20,000.
Bitcoin (BTC) Price Action
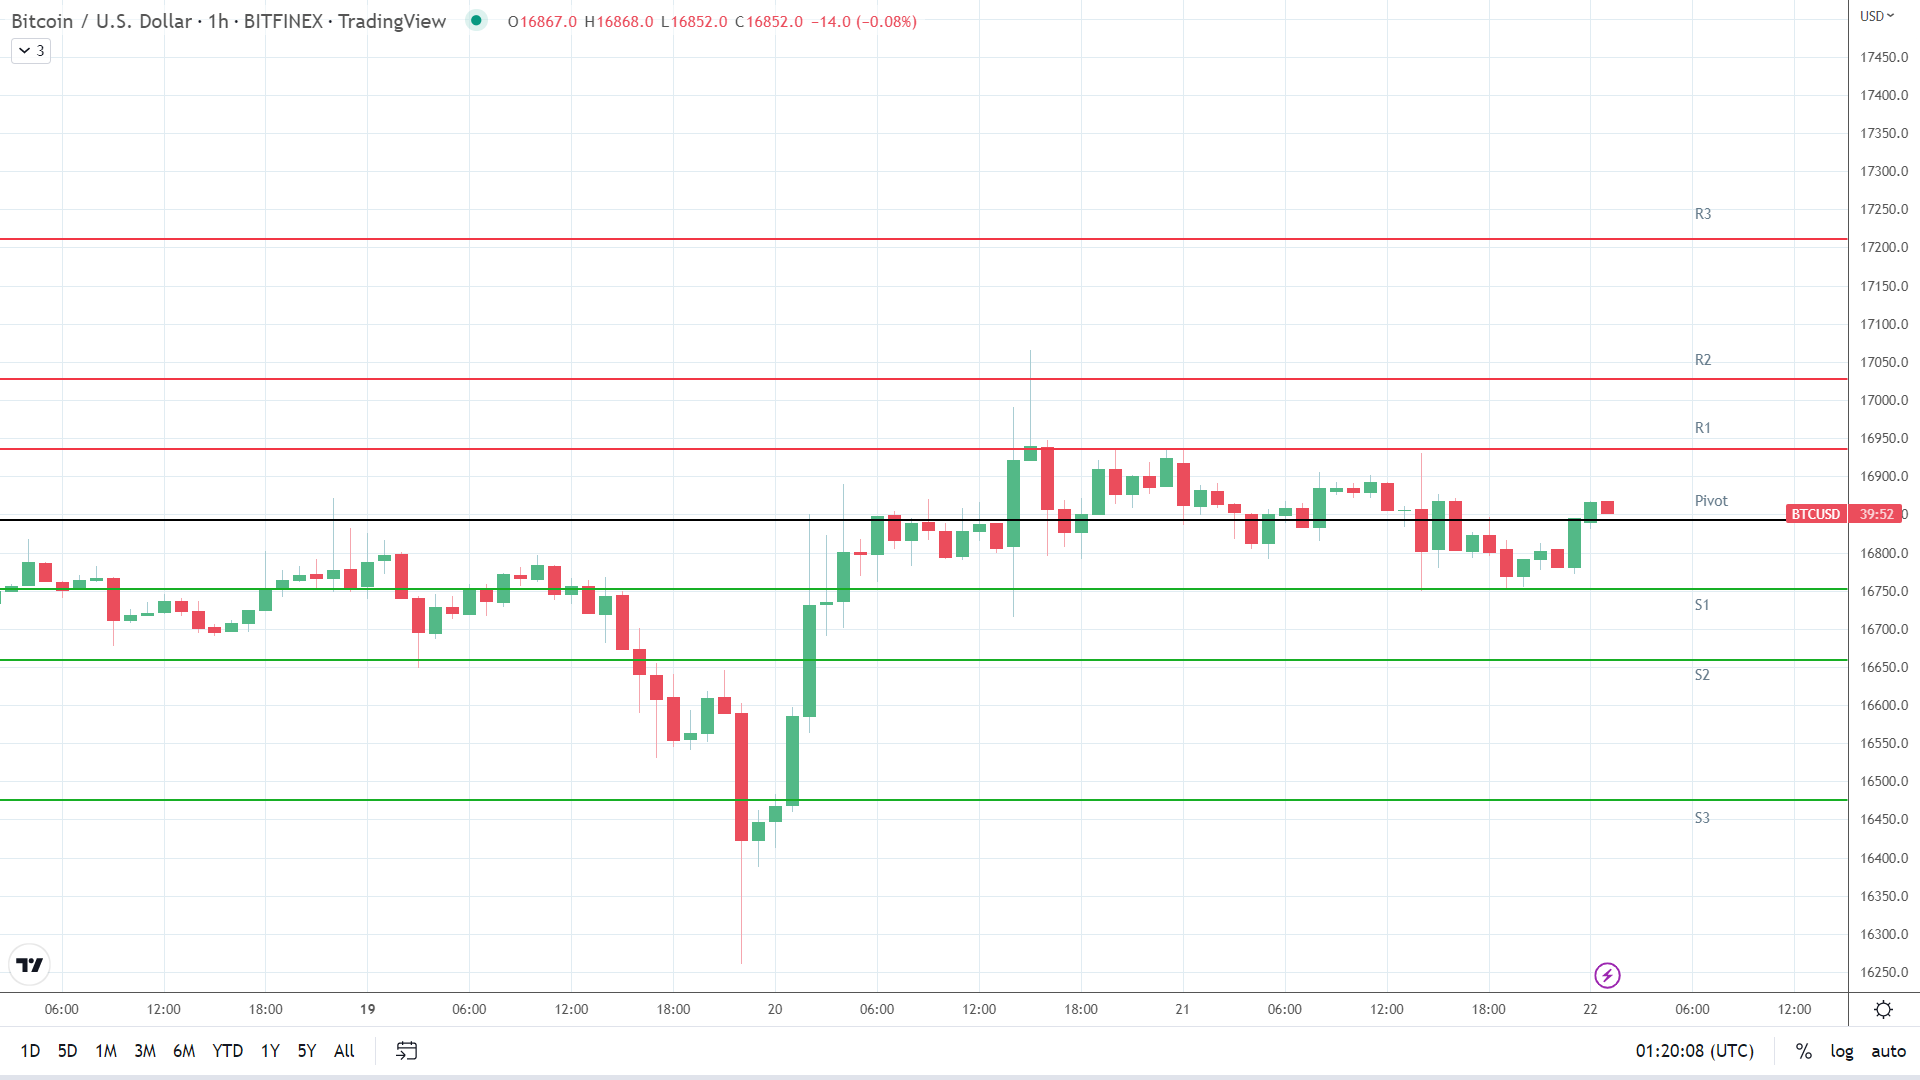
At the time of writing, BTC was up 0.04% to $16,852. A range-bound start to the day saw BTC fall to an early low of $16,831 before rising to a high of $16,868.
Technical Indicators
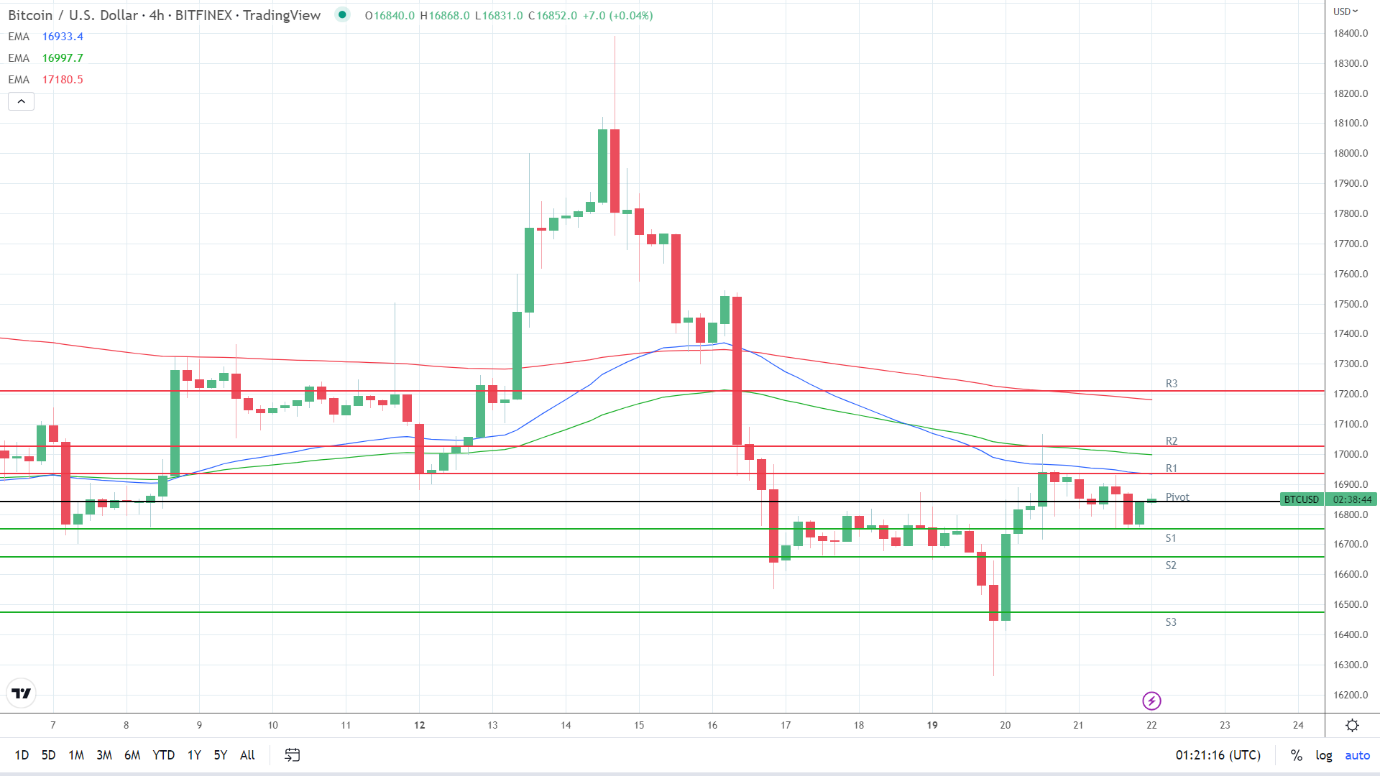
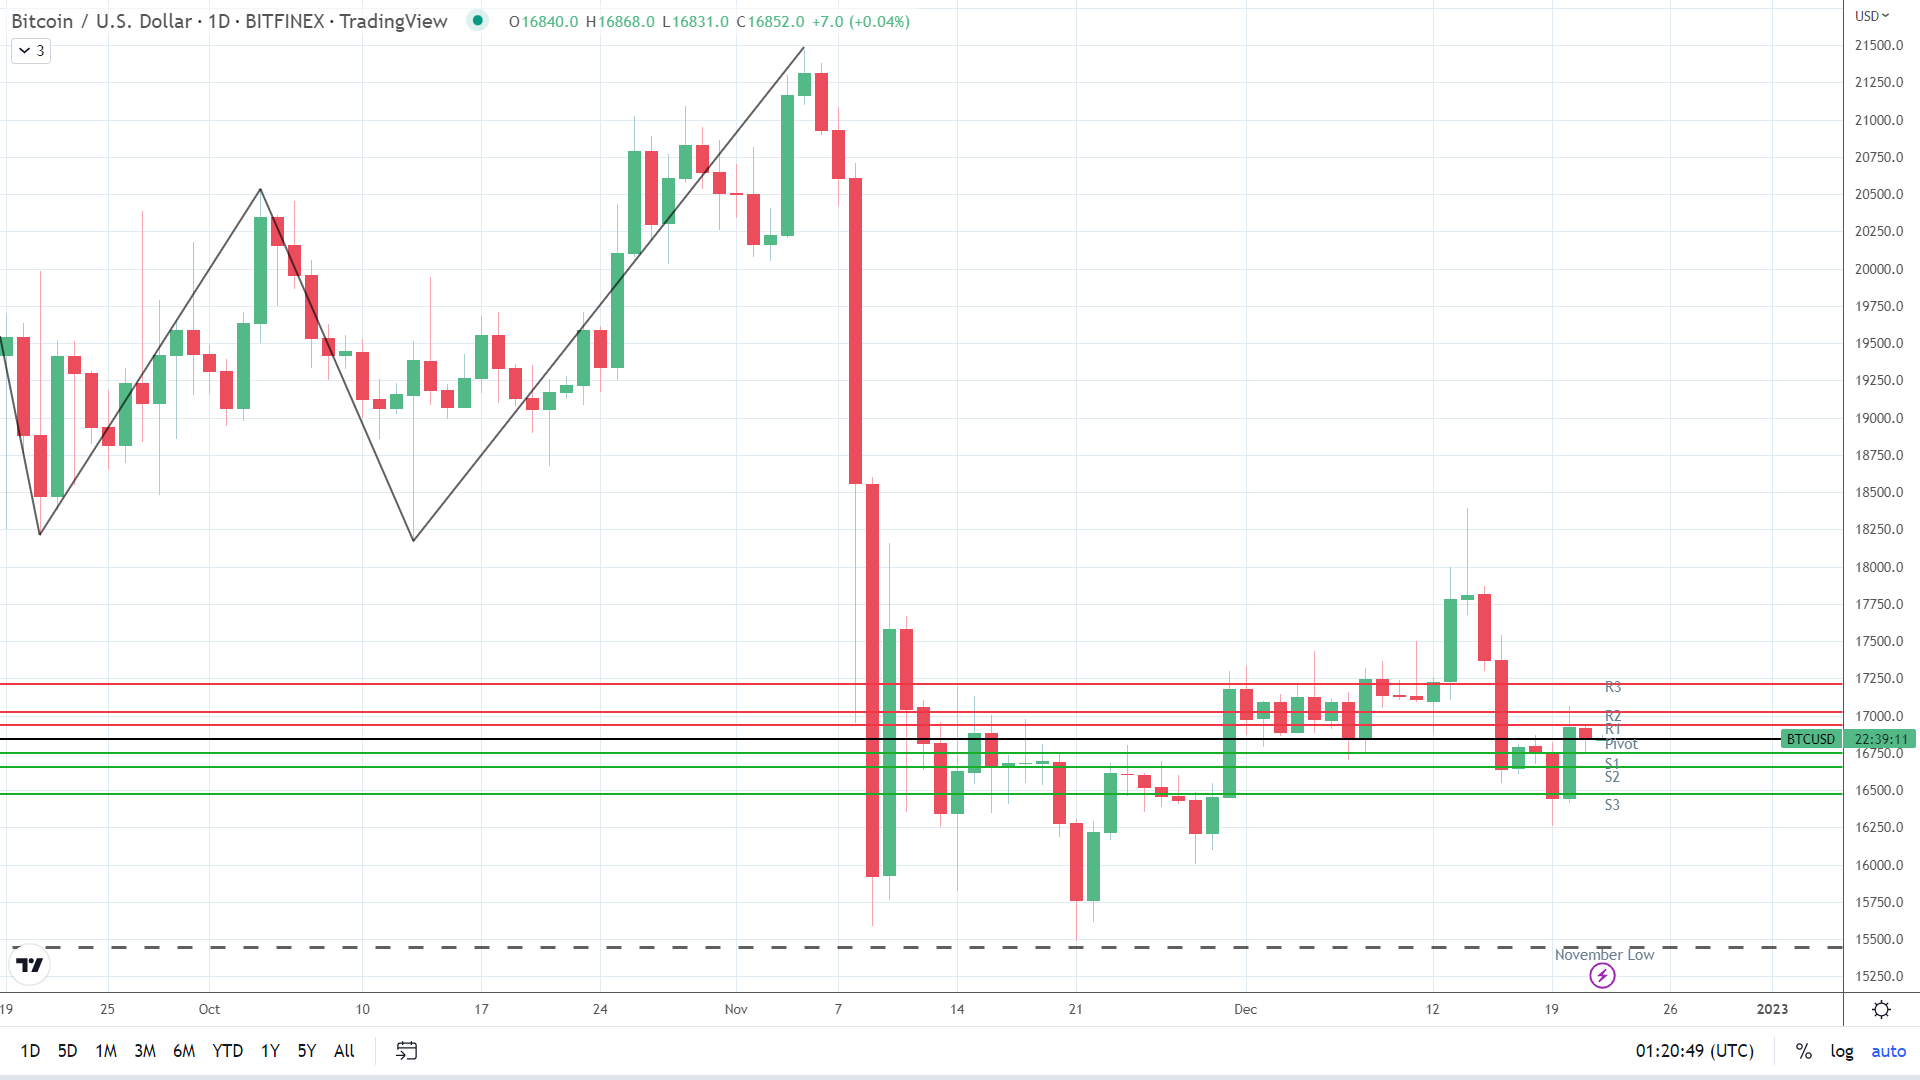
BTC needs to avoid the $16,843 pivot to target the First Major Resistance Level (R1) at $16,936. A return to $16,900 would signal a bullish session. However, the NASDAQ Index and crypto news wires need to be crypto-friendly.
In the event of an extended rally, BTC would test the Second Major Resistance Level (R2) at $17,027 before any pullback. The Third Major Resistance Level (R3) sits at $17,211.
A fall through the pivot would bring the First Major Support Level (S1) at $16,752 into play. Barring a risk-off-fueled sell-off, BTC should avoid sub-$16,500. The Second Major Support Level (S2) at $16,659 should limit the downside. The Third Major Support Level (S3) sits at $16,475.
An adverse crypto market event would bring sub-$16,000 into play.
Looking at the EMAs and the 4-hourly candlestick chart (below), it was a bearish signal. This morning, BTC sat below the 50-day EMA, currently at $16,933. After Sunday’s bearish cross, the 50-day EMA fell back from the 100-day EMA, with the 100-day EMA easing back from the 200-day EMA, delivering bearish signals.
A move through the 50-day ($16,933) and R1 ($16,936) would support a breakout from the 100-day ($16,998) to target R2 ($17,027). However, failure to move through the 50-day EMA ($16,933) would leave BTC under pressure.