Key Insights:
- On Friday, bitcoin (BTC) rose by 1.53% to end the day at $20,611. Notably, BTC fell short of $21,000 while wrapping up the day at $20,000 for the fourth consecutive session.
- US economic indicators and corporate earnings supported a bullish session, with BTC reversing losses from the morning session.
- The Bitcoin Fear & Greed Index responded to the bullish session, rising from 30/100 to 34/100.
On Friday, bitcoin (BTC) rose by 1.53%. Partially reversing a 2.35% loss from Thursday, BTC ended the day at $20,611. Notably, BTC wrapped up the day at $20,000 for the fourth time since October 5 while falling short of $21,000 for a second session.
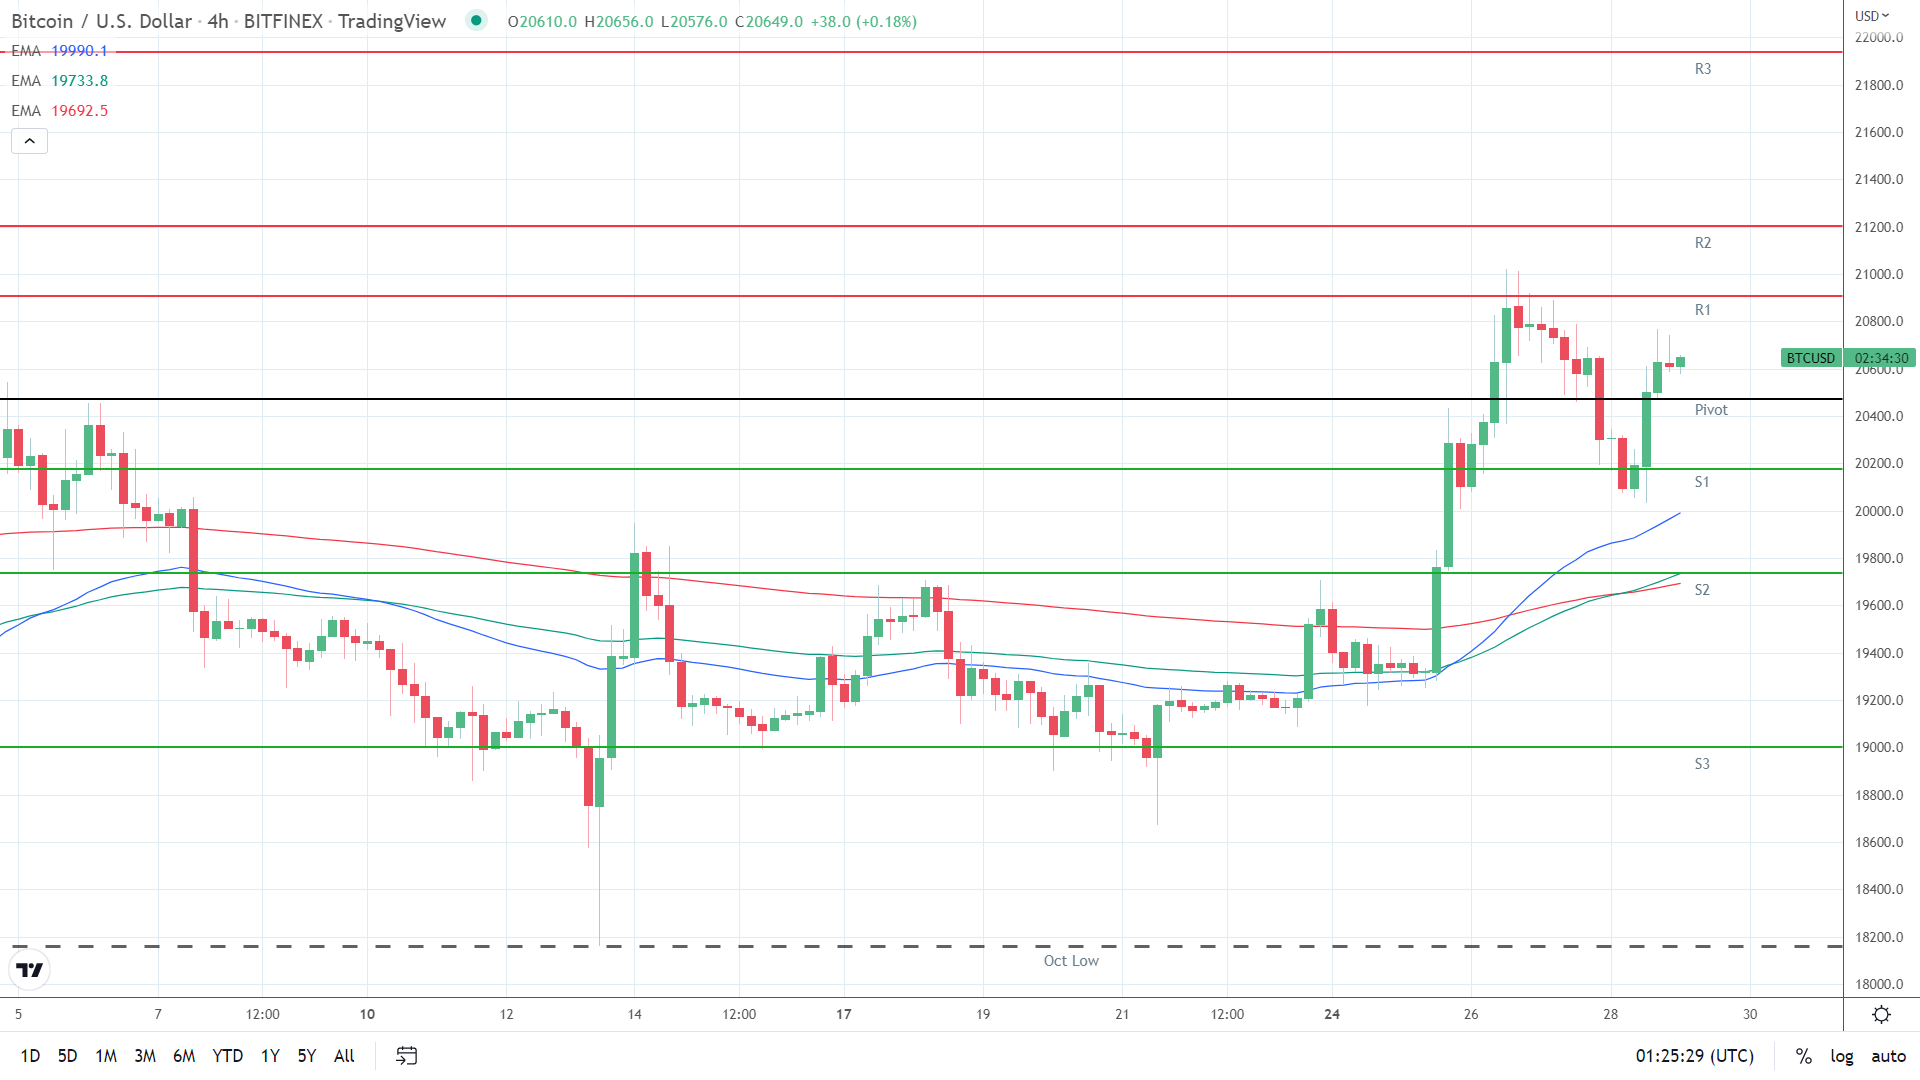
A bearish morning saw BTC fall to a mid-day low of $20,033. Finding support at the First Major Support Level (S1) at $20,031, BTC rallied to a late high of $20,767. BTC broke through the First Major Resistance Level (R1) at $20,732 before easing back to end the day at sub-$20,700.
US economic indicators and corporate earnings supported a bullish session. Friday’s stats reinforced the market bets of a Fed pivot in December, with wage growth softening in Q3.
However, a pickup in inflationary pressure did leave some uncertainty, with the Core PCE Price Index up 5.1% year-over-year in September versus 4.9% in August.
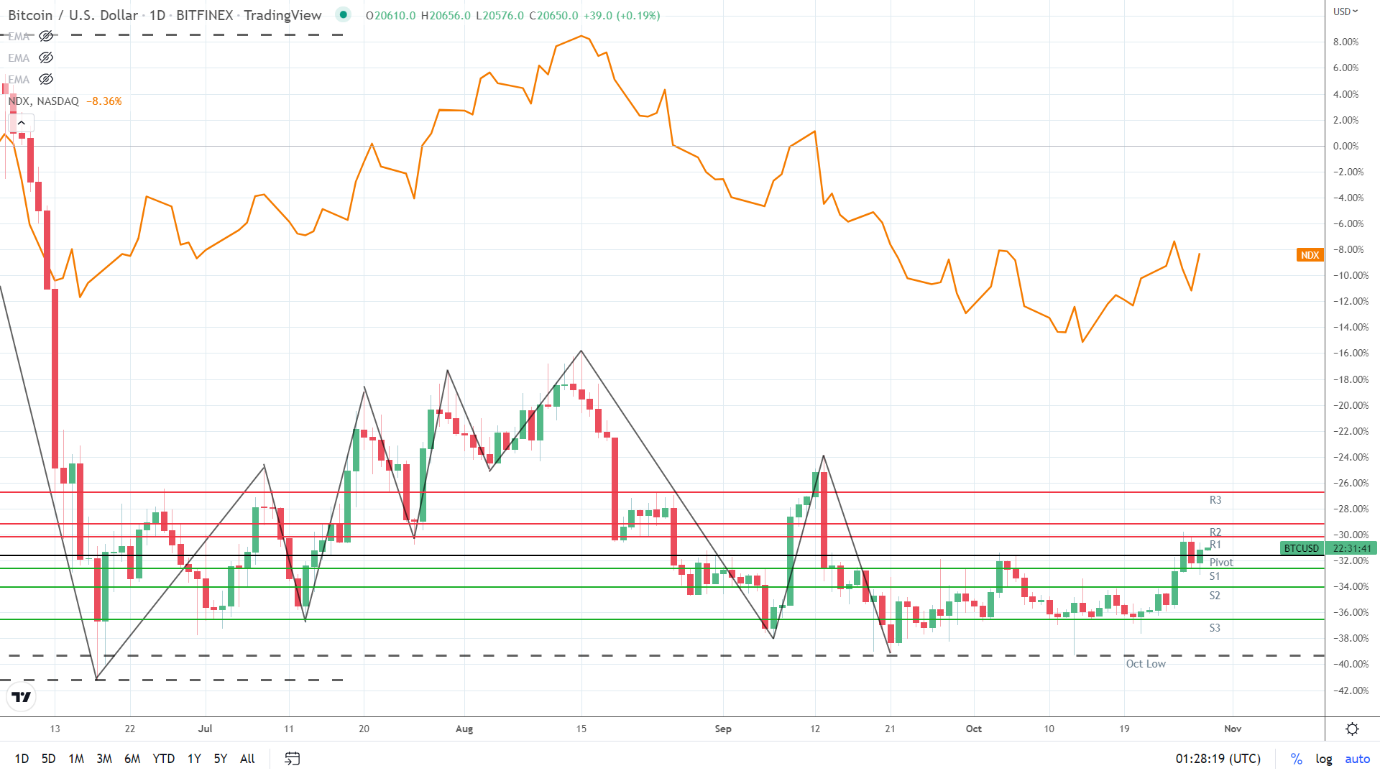
US corporate earnings added support to riskier assets, with Chevron (CVX) and Exxon Mobil (XOM) beating forecasts. On Friday, the NASDAQ 100 rallied by 2.87%.

The Fear & Greed Index Rises to 34/100 on Fed Pivot Hopes
This morning, the Fear & Greed Index rose from 30/100 to 34/100. Improved risk appetite and rising hopes of a Fed pivot in December supported the increase and gradual move toward the Neutral zone.
Near-term, US economic indicators will remain the focal point as investors await the Fed policy decision on November 2.
The Index will need to target 40/100 and the neutral zone to support a BTC bearish trend reversal. However, a fall to sub-20/100 would signal a BTC slide to sub-$18,000.
Bitcoin Price Forecast
Every new Bitcoin analysis as it publishes, today's technical signal and key levels, live price — on one page.
See all Bitcoin forecasts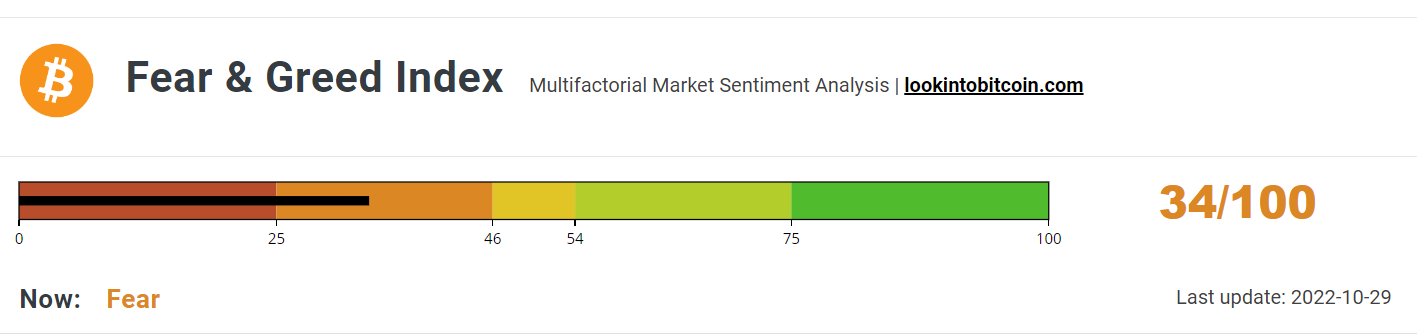
Bitcoin (BTC) Price Action
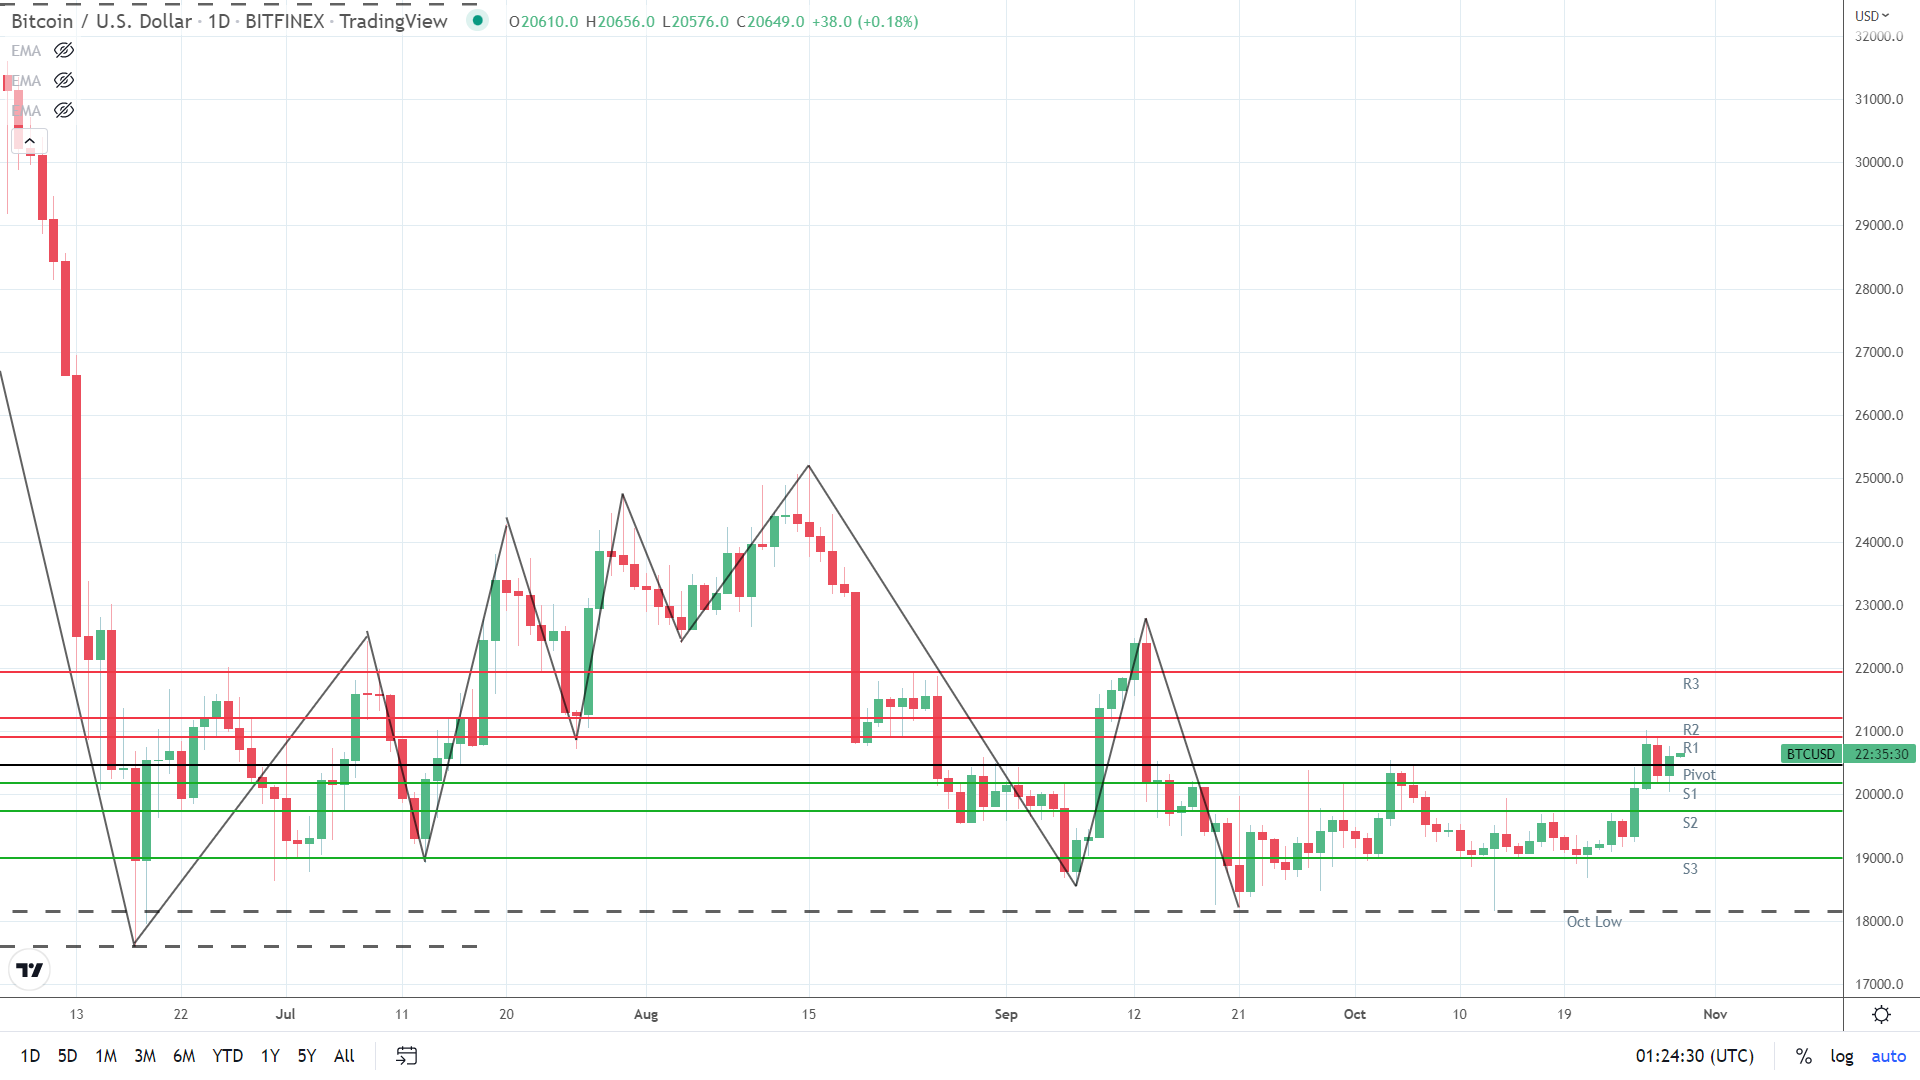
At the time of writing, BTC was down 0.18% to $20,649. A range-bound start to the day saw BTC fall to an early low of $20,576 before rising to a high of $20,656.
Technical Indicators
BTC needs to avoid the $20,470 pivot to target the First Major Resistance Level (R1) at $20,908. A BTC move through the Friday high of $20,767 would signal a possible breakout session.
In the case of an extended rally, the Second Major Resistance Level (R2) at $21,204 and $21,500 would likely come into play. The Third Major Resistance Level (R3) sits at $21,938.
A fall through the pivot would bring the First Major Support Level (S1) at $20,174 into play. Barring an extended sell-off, BTC should avoid sub-$20,000 and the Second Major Support Level (S2) at $19,736.
The Third Major Support Level (S3) sits at $19,002.
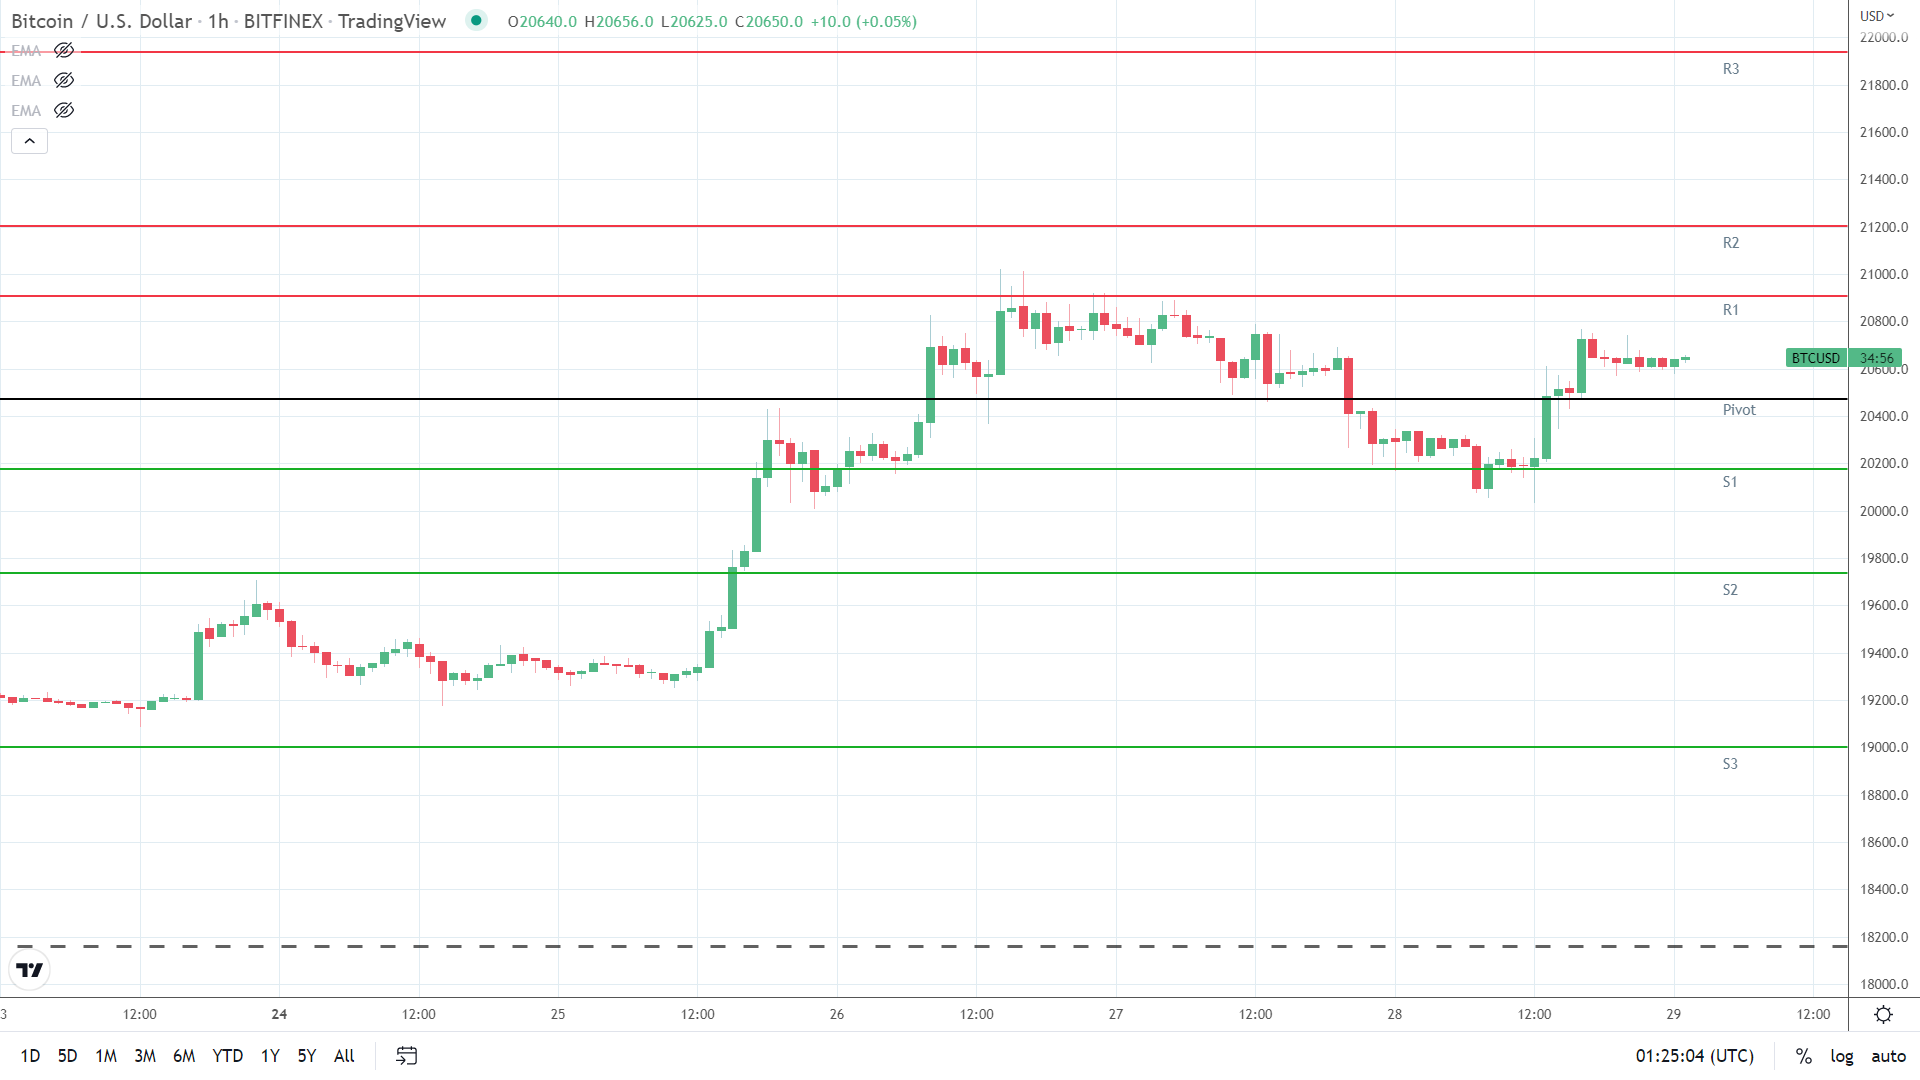
Looking at the EMAs and the 4-hourly candlestick chart (below), it was a bullish signal. This morning, bitcoin sat above the 50-day EMA, currently at $19,990.
The 50-day EMA widened from the 200-day EMA, with the 100-day EMA pulling away from the 200-day EMA to deliver bullish signals.
Following the bullish cross of the 100-day EMA through the 200-day EMA, the EMAs support a move through R1 ($20,908) to target R2 ($21,204) and $21,500. However, a fall through S1 ($20,174) would bring the 50-day EMA ($19,990) and S2 ($19,736) into view.