Early Signs of a Bottom
Circle Internet Group, Inc. (CRCL) stock is showing signs that it may be getting closer to establishing a bottom and ending the bearish correction. The company is a financial-technology and digital-asset infrastructure company best known as the issuer of the USDC (USD Coin) stablecoin. It reported Q2 2026 earnings on August 5, and the stock has since begun to show early signs of gradual strengthening.
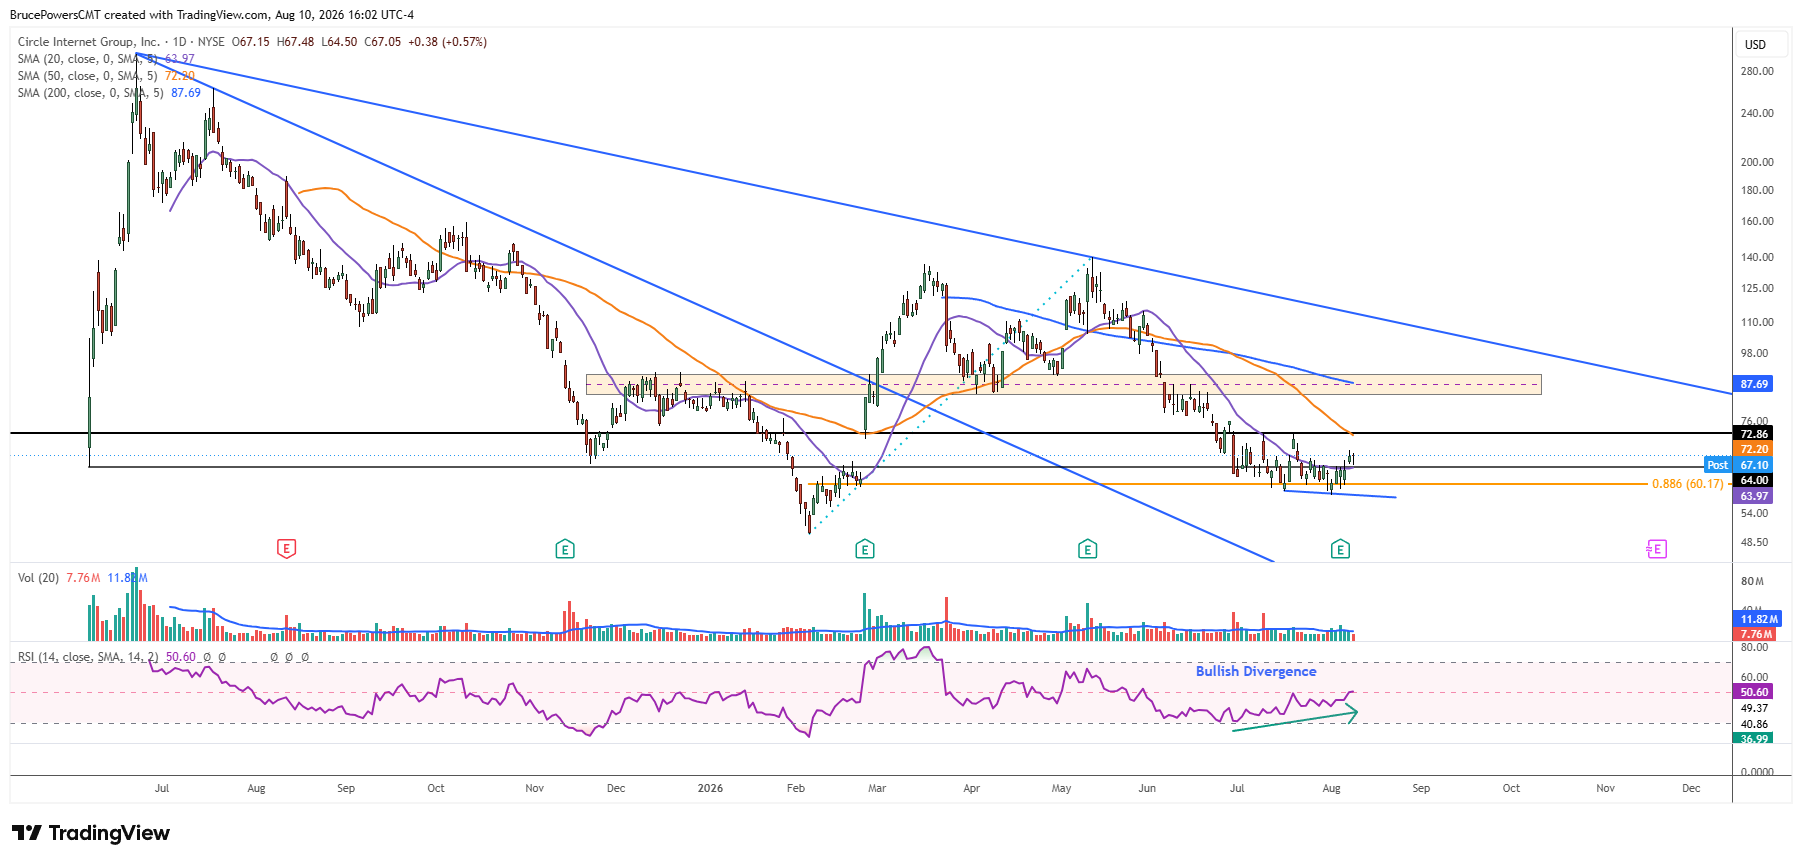
On Friday, the 20-day moving average was reclaimed with the session’s full range contained above that average, while the same price behavior occurred on Monday. These early signs of strength are beginning to support the possibility that the corrective phase is nearing completion.

A Bullish Weekly Reversal
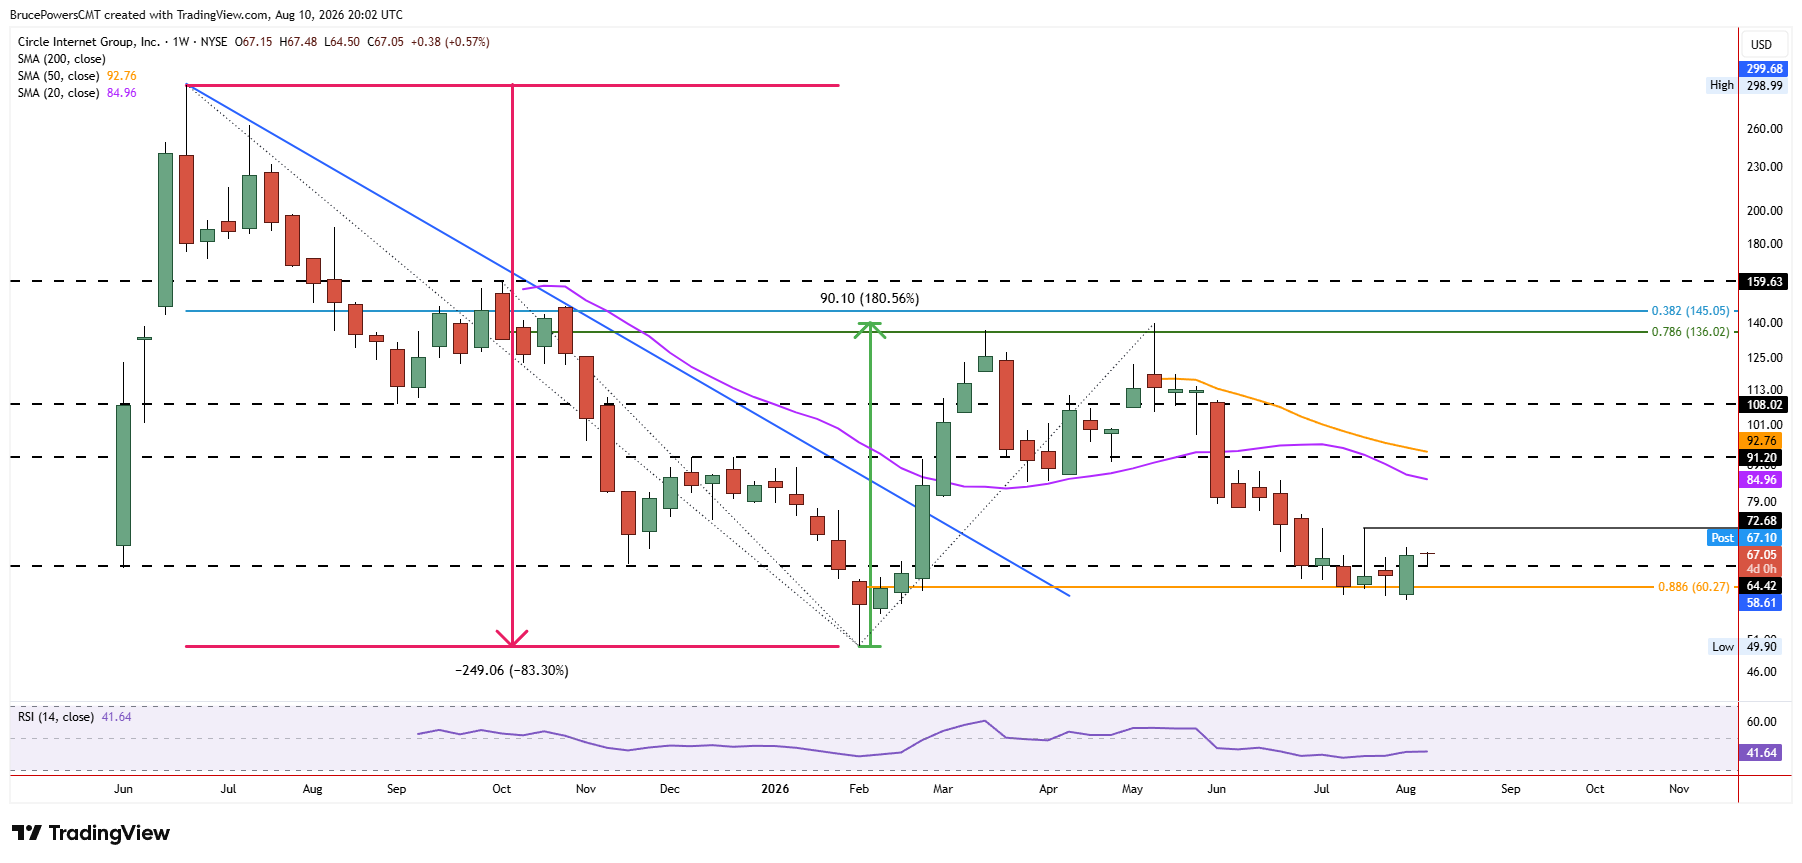
A new corrective low of $57.84 was reached last week before buyers stepped in and drove the stock higher. The week ended with a bullish outside week reversal candle, confirmed by a weekly close at $66.67, which was above the prior week’s high of $66.24. Moreover, CRCL ended the week at its highest weekly closing price in seven weeks. The combination of a new corrective low, a bullish weekly reversal, and a higher weekly close point to improving momentum and raises the potential for additional bullish signals ahead.
$72.86 Confirmation Level
CRCL has been forming a potential bottom consolidation pattern since an initial corrective low of $61.77 was reached at the beginning of July. A lower swing high at $72.86 is a key level, since a breakout above it will signal a reversal of the downtrend, along with a reclaim of the 50-day moving average. However, the 50-day moving average is now at $72.19 and heading lower. This means that an earlier bullish signal would occur on an advance above the 50-day moving average, although a move above $72.86 would provide stronger confirmation of a trend reversal.
Momentum Begins to Shift
Since early July, support has been tested repeatedly near the 88.6% Fibonacci retracement level for the prior advance at $60.17. This deep retracement could provide an important foundation for a durable bottom if support holds. As consolidation near the bottom formed, the Relative Strength Index (RSI) showed signs of bullish divergence, suggesting that bearish momentum was weakening. Together with the bullish weekly reversal and reclaim of the 20-day moving average, the divergence adds to the early evidence that a correction may be nearing completion.