Breakout Sets Up Next Leg Higher
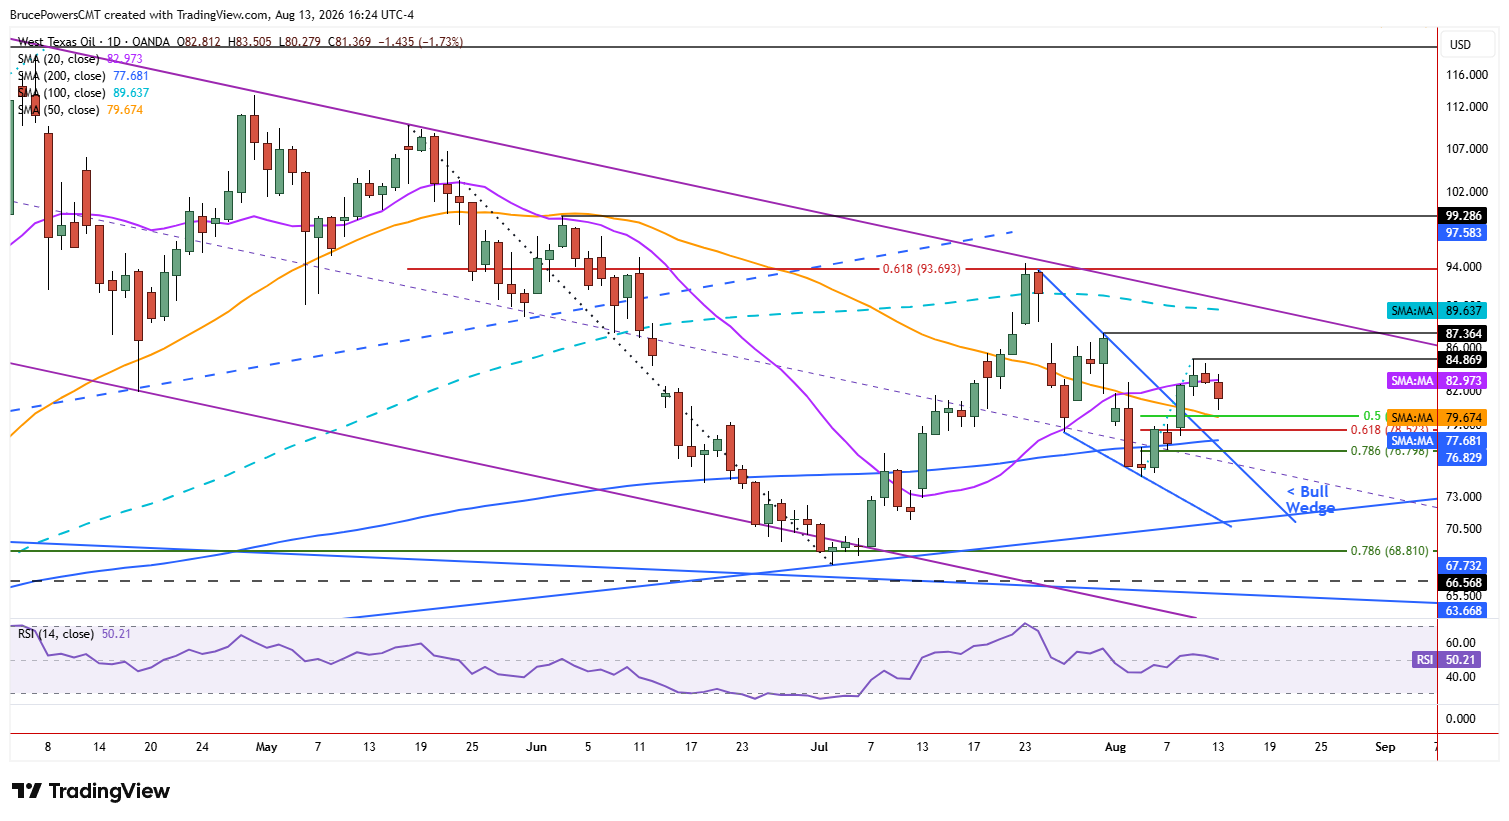
WTI crude oil pulled back to a three-day low of $80.28 on Thursday, as it began the first retracement after an upside breakout of a falling bullish wedge continuation pattern that triggered on Monday. A subsequent high of $84.87 was reached on Tuesday, resulting in the current pullback. However, given the bullish signal from the falling wedge the pullback is anticipated to lead to at least another leg up.
That next leg up may eventually reach the upper downtrend line that is part of a declining trend channel. For now, the pullback appears consistent with a normal reaction following the recent breakout rather than an immediate reversal of the developing bullish trend.

$94.34 Target Comes Into Focus
The bottom of the wedge is at the recent higher swing low of $74.60, which is a sign of underlying strengthening. Since it was followed by further bullish evidence seen in the wedge breakout, the initial pattern objective at the lower swing high of $94.34 needs to be considered as a potential upside target. But first the downtrend line needs to be broken through, along with the 100-day moving average near $89.65. Since resistance was seen during the recent advance near the 100-day moving average, it may again identify a resistance zone. A move through that area would therefore provide an important test of whether the recent breakout can develop into a broader recovery.
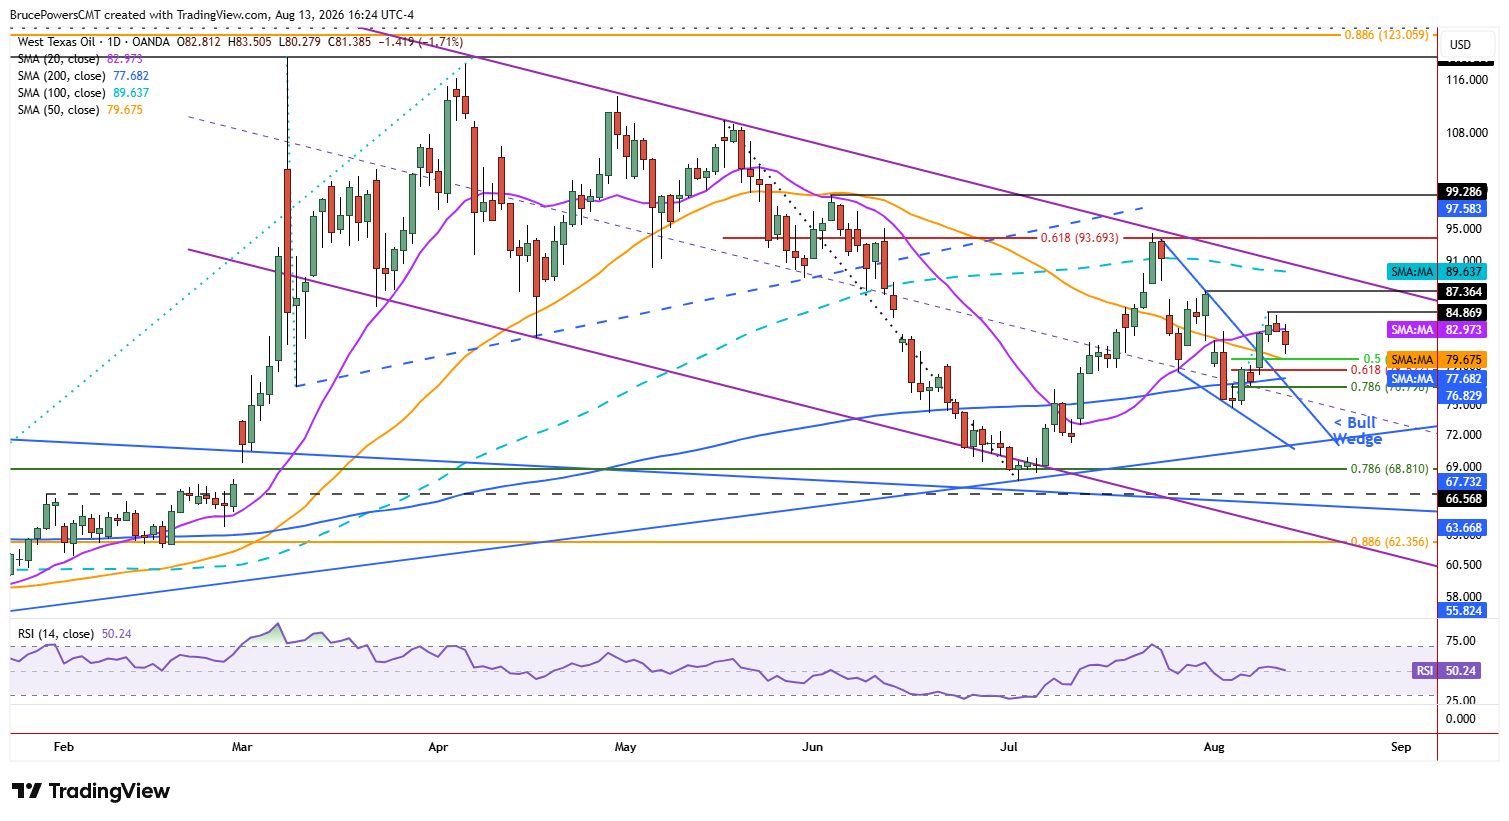
In addition, the 100-day moving average is close to converging with the downtrend line, adding to the potential significance of this resistance zone. It marks a significant pivot zone since a rally above the downtrend line and the 100-day moving average would be a sign of strength and could result in a recovery of the recent lower swing high at $94.34, which would further confirm strengthening. A sustained move above that swing high would provide another bullish confirmation and strengthen the case for a continued recovery.
200-Day Average Provides a Foundation
There is also the test of the 200-day moving average as support that occurred with the most recent decline. A reclaim of the 200-day average occurred during the last advance that followed the July swing low of $67.73. Confirmation of support at that long-term trend indicator supports a short-term bullish outlook. It also provides an important foundation for the current recovery.
A Larger Recovery Depends on Resistance
A decisive rise through the upper downtrend line would be a sign of strength. If sustained, it may result in a recovery of the July lower swing high. That would set the stage for a possible challenge to the resistance zone near recent highs that followed the sharp advance in March. In this context, the current pullback is important in that the wedge breakout could be the next stage of a larger recovery.