


200-Day Moving Average Gives Way
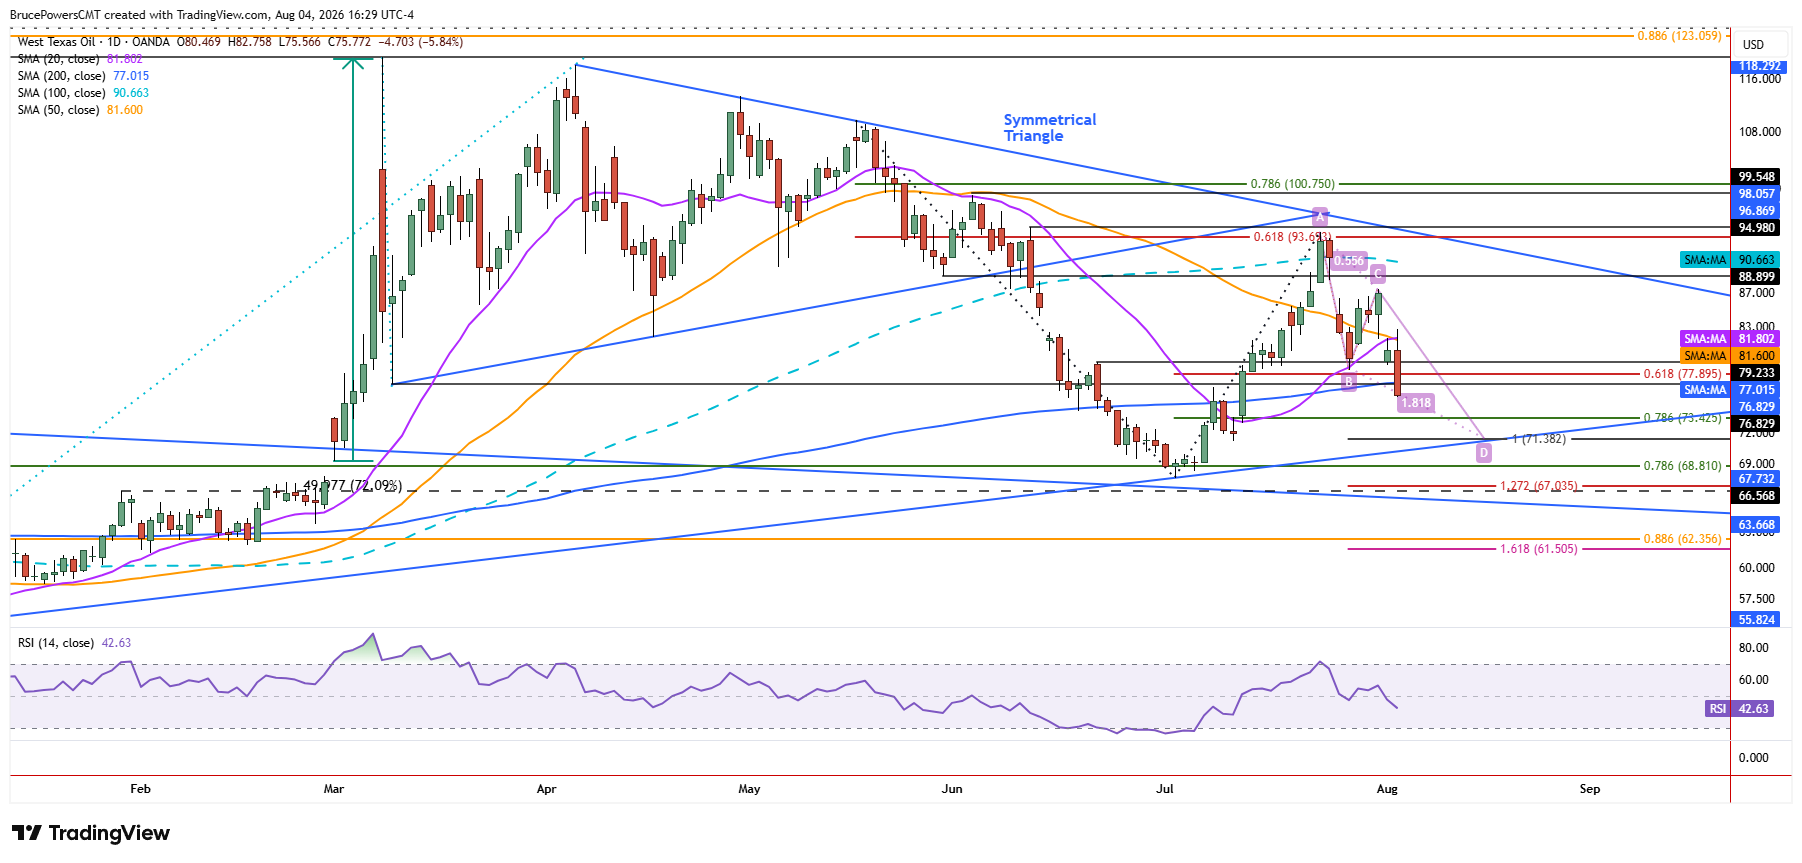
A pullback in WTI crude oil deepened on Tuesday, with a new low of $75.59 reached after a break below the 200-day moving average near $77.02. It looks likely that the session will end below that average, which would confirm that sellers are in control of price action. A small bearish flag pattern triggered during the decline and resistance near both the 20-day and 50-day moving averages was confirmed for the second day. Those averages near $81.60 can be viewed along with Tuesday’s high of $82.76 for resistance levels.

Lower Fibonacci Targets Come into View
Tuesday’s decline also fell below the 61.8% Fibonacci retracement of the prior advance at $77.90, opening the 78.6% Fibonacci retracement target at $73.43. A little lower is the 100% projected target for a falling ABCD pattern at $71.32. That level is also close to an uptrend line that connects to the prior swing low, also representing potential support.
A Triangle Keeps the Bigger Picture Intact
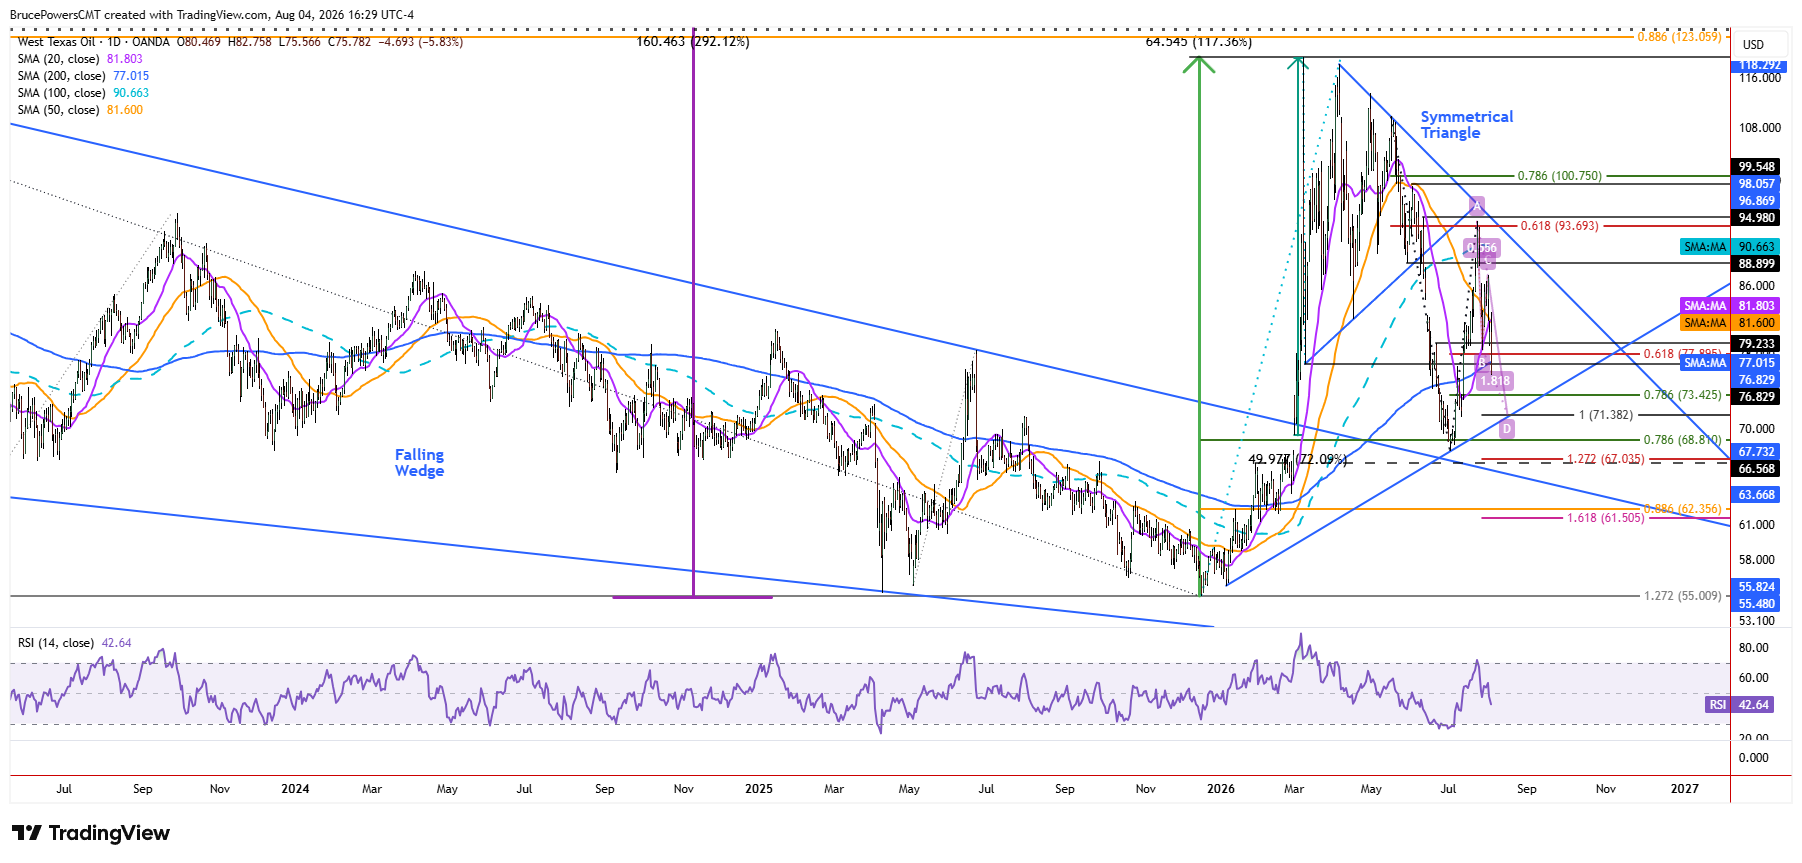
The larger pattern unfolding in crude oil is consolidation in the form of a large symmetrical triangle pattern. This suggests that the coming weeks may see additional swings within that larger pattern. Volatility looks likely to decline overall as the symmetrical triangle indicates that the trading range will likely contract in the coming weeks. Since the apex of the triangle is near November 10, a breakout of the triangle would occur before then.
Although the boundary lines of the triangle define key levels of the pattern, levels from structure include support at the recent swing low of $67.73 and resistance at the swing high of $94.34. Following consolidation, the expectation continues to be bullish given that crude oil broke out of a long-term bearish correction earlier in the year and may again challenge that high established following that breakout at $119.54.
If you’d like to know more about how to trade crude oil, please visit our educational area.


