
US stock futures edged higher during the Asian market session on Wednesday, February 4, steadying after the previous day’s sell-off. Market jitters about the AI space resurfaced, coinciding with fading bets on an H1 2026 Fed rate cut, weighing on demand for risk assets.
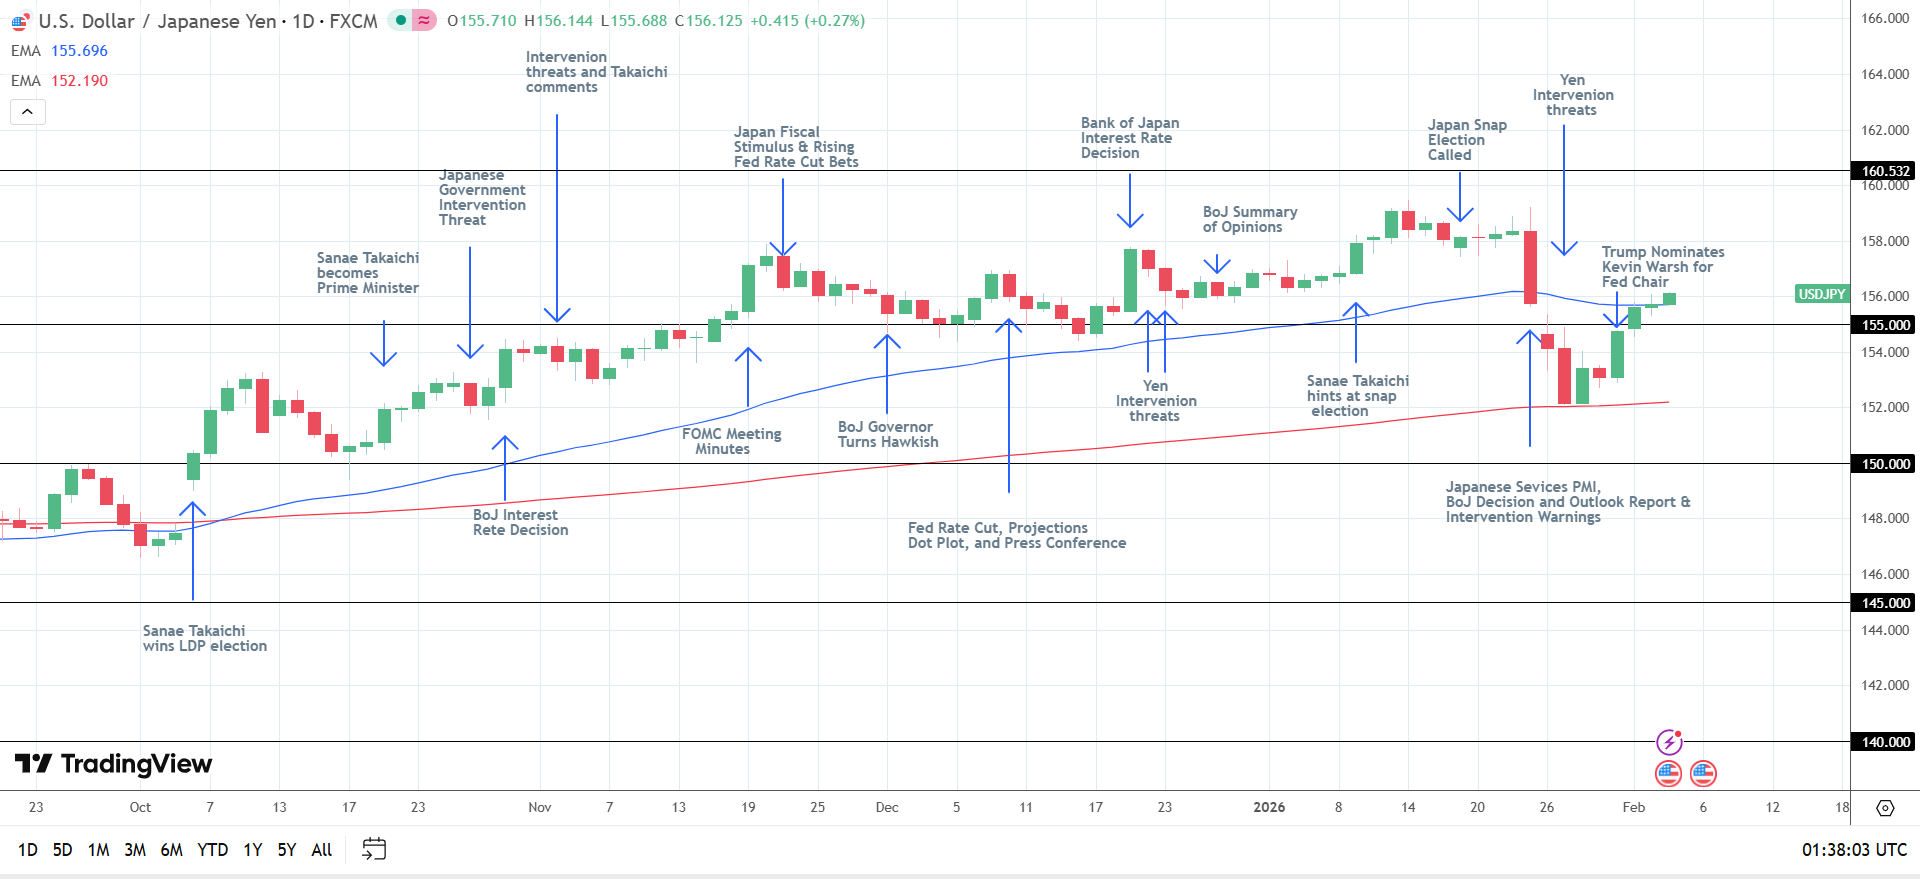
Meanwhile, stronger-than-expected Japanese economic data signaled a more hawkish BoJ policy stance, weighing on Japanese stocks. The Nikkei dropped 0.74% in morning trading. However, the data failed to strengthen the yen, bolstering buying interest in US index futures. Notably, USD/JPY climbed 0.27% to 156.125 in morning trading.
A choppy start to the week reflected market tension as upbeat US economic indicators signaled a more hawkish Fed rate path. Nevertheless, robust US corporate earnings, a strong US economy, and expectations of multiple 2026 Fed rate cuts support a cautiously bullish outlook for the US index futures.
Below, I’ll outline the key market drivers, the medium-term outlook, and the technical levels traders should watch.

Japanese Services PMI Signals Strong Economic Momentum
Japanese economic indicators aligned with the Bank of Japan’s upward revision to its 2026 GDP forecast. The S&P Global Japan Services PMI increased from 51.6 in December to 53.7 in January, up from a preliminary 53.4. According to the PMI survey, new business increased at a sharper pace, with service providers increasing employment. Despite input price inflation cooling, selling price inflation rose to a seven-month high, signaling wider profit margins.
Typically, wider margins and increasing new business enable firms to increase employment and raise wages. Higher wages would boost consumer spending and fuel demand-driven inflation, supporting a more hawkish BoJ rate path. Rising bets on an H1 2026 BoJ rate hike would narrow the US-Japan rate differential, curbing demand for US risk assets. These dynamics expose US stock futures to a choppy session ahead of the US market opening bell.
Dow Jones Price Forecast
Every new Dow Jones analysis as it publishes, today's technical signal and key levels, live price — on one page.
See all Dow Jones forecastsUS Services, the Fed, and Earnings in Focus
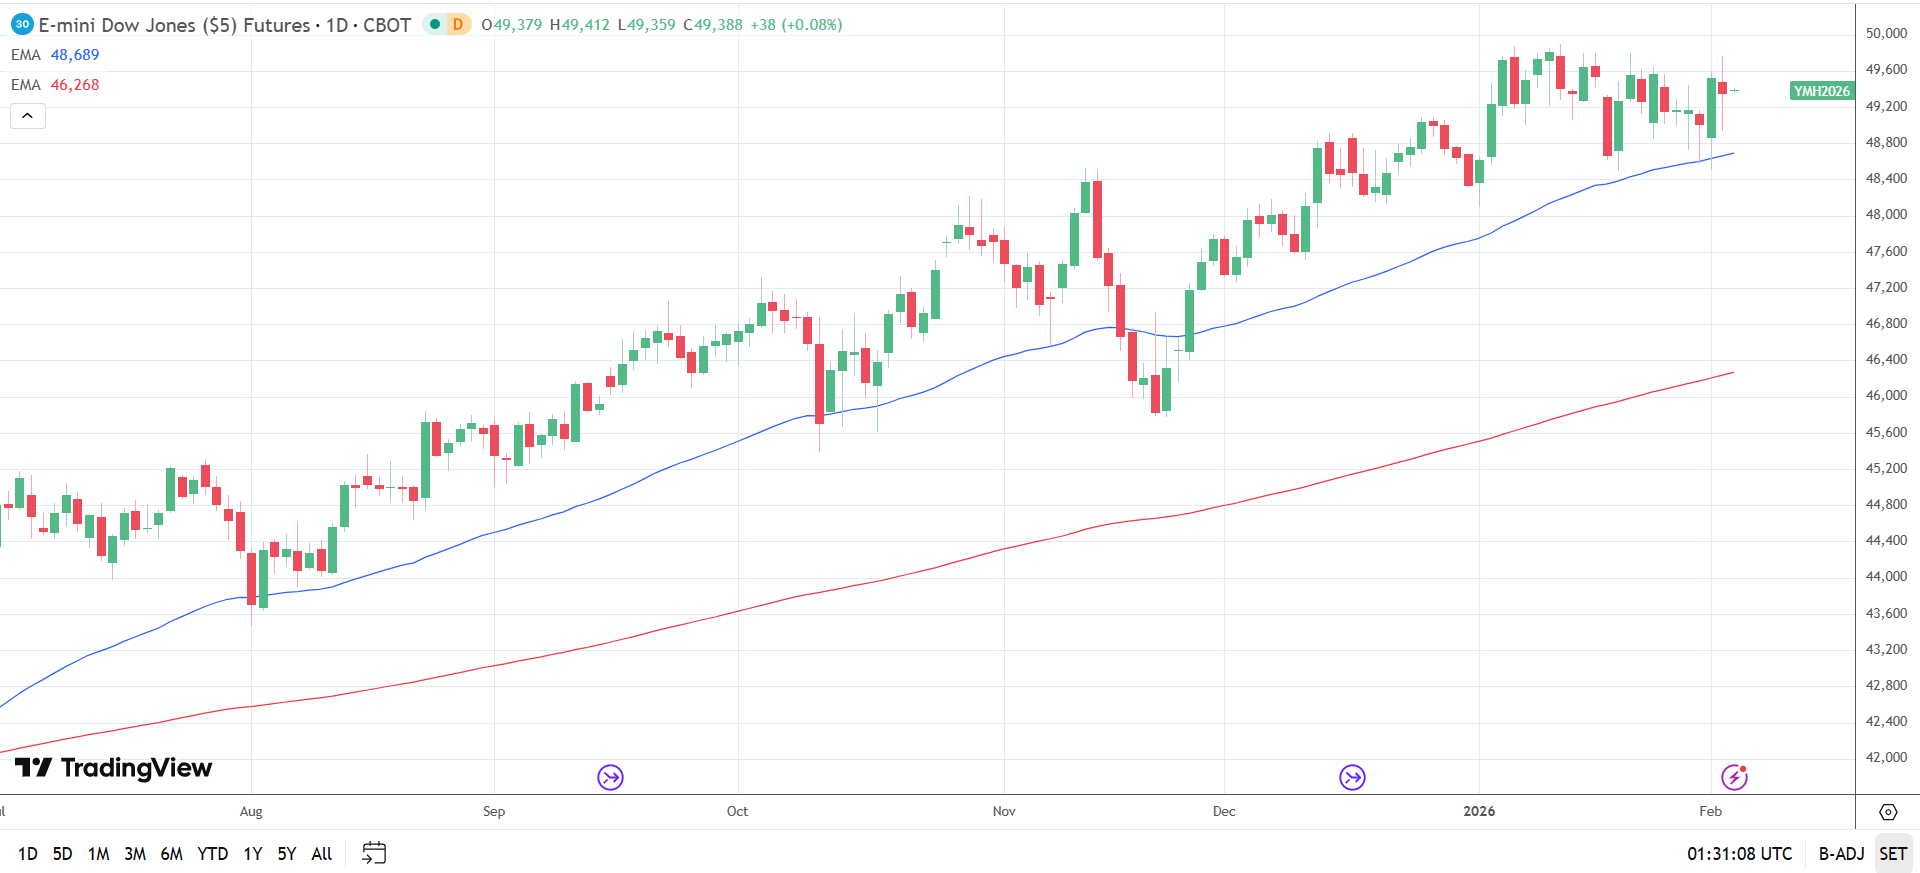
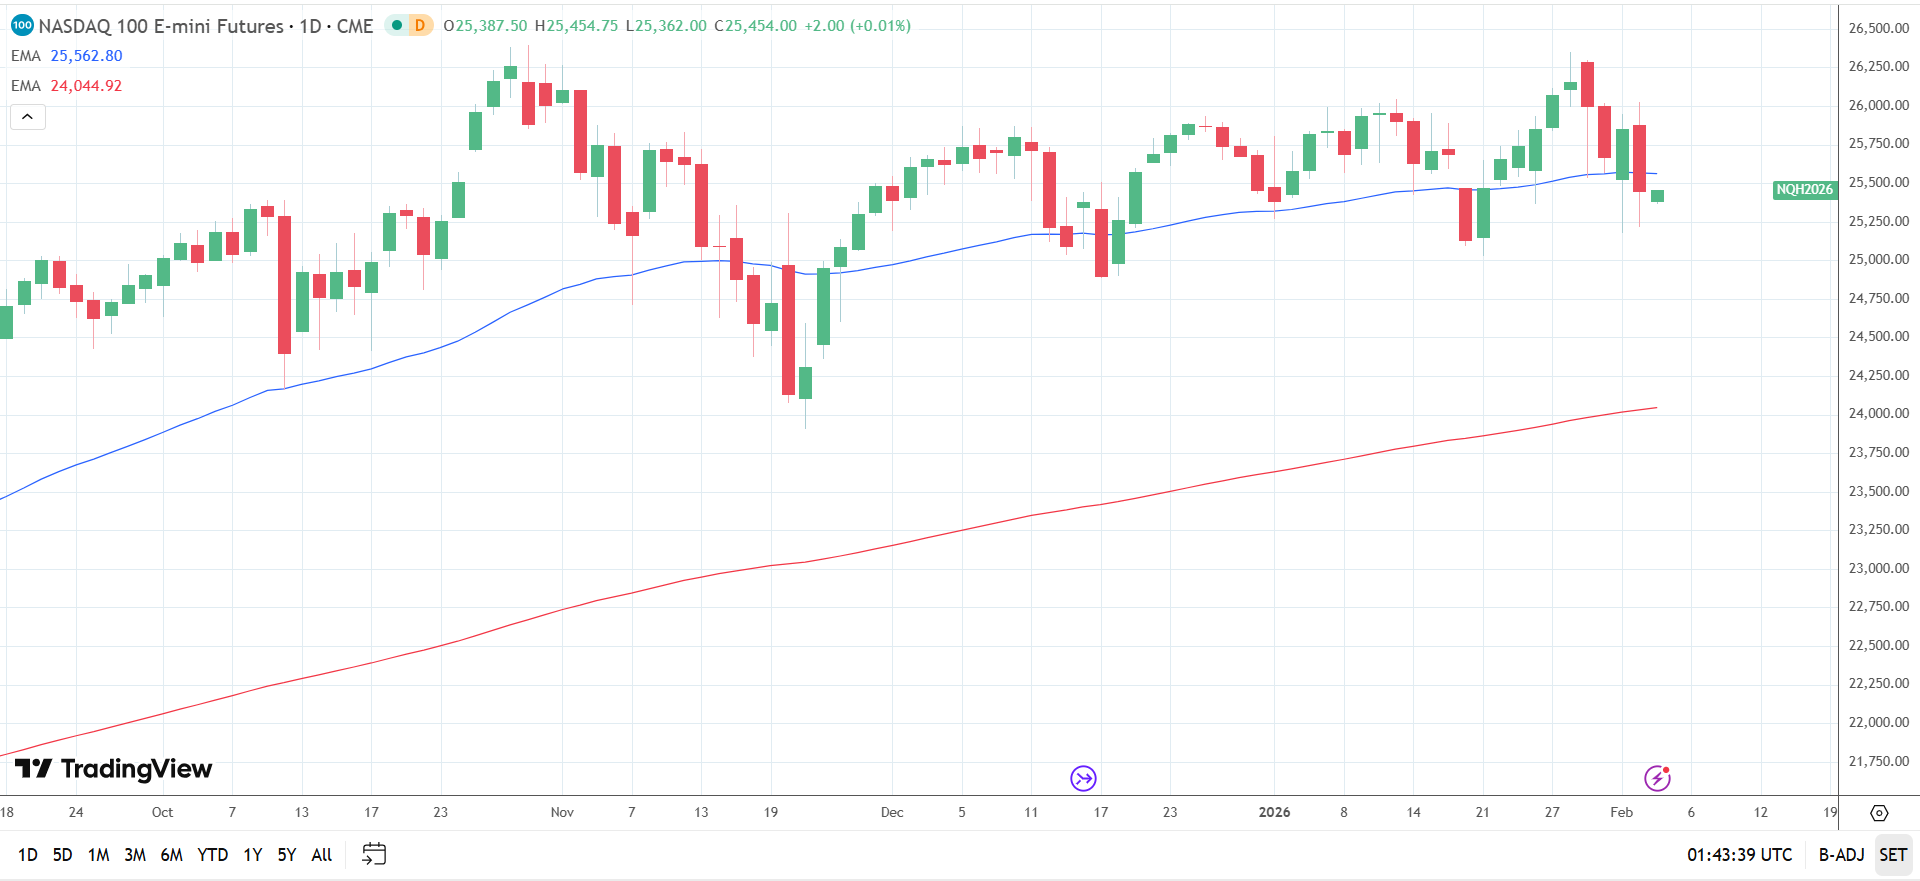
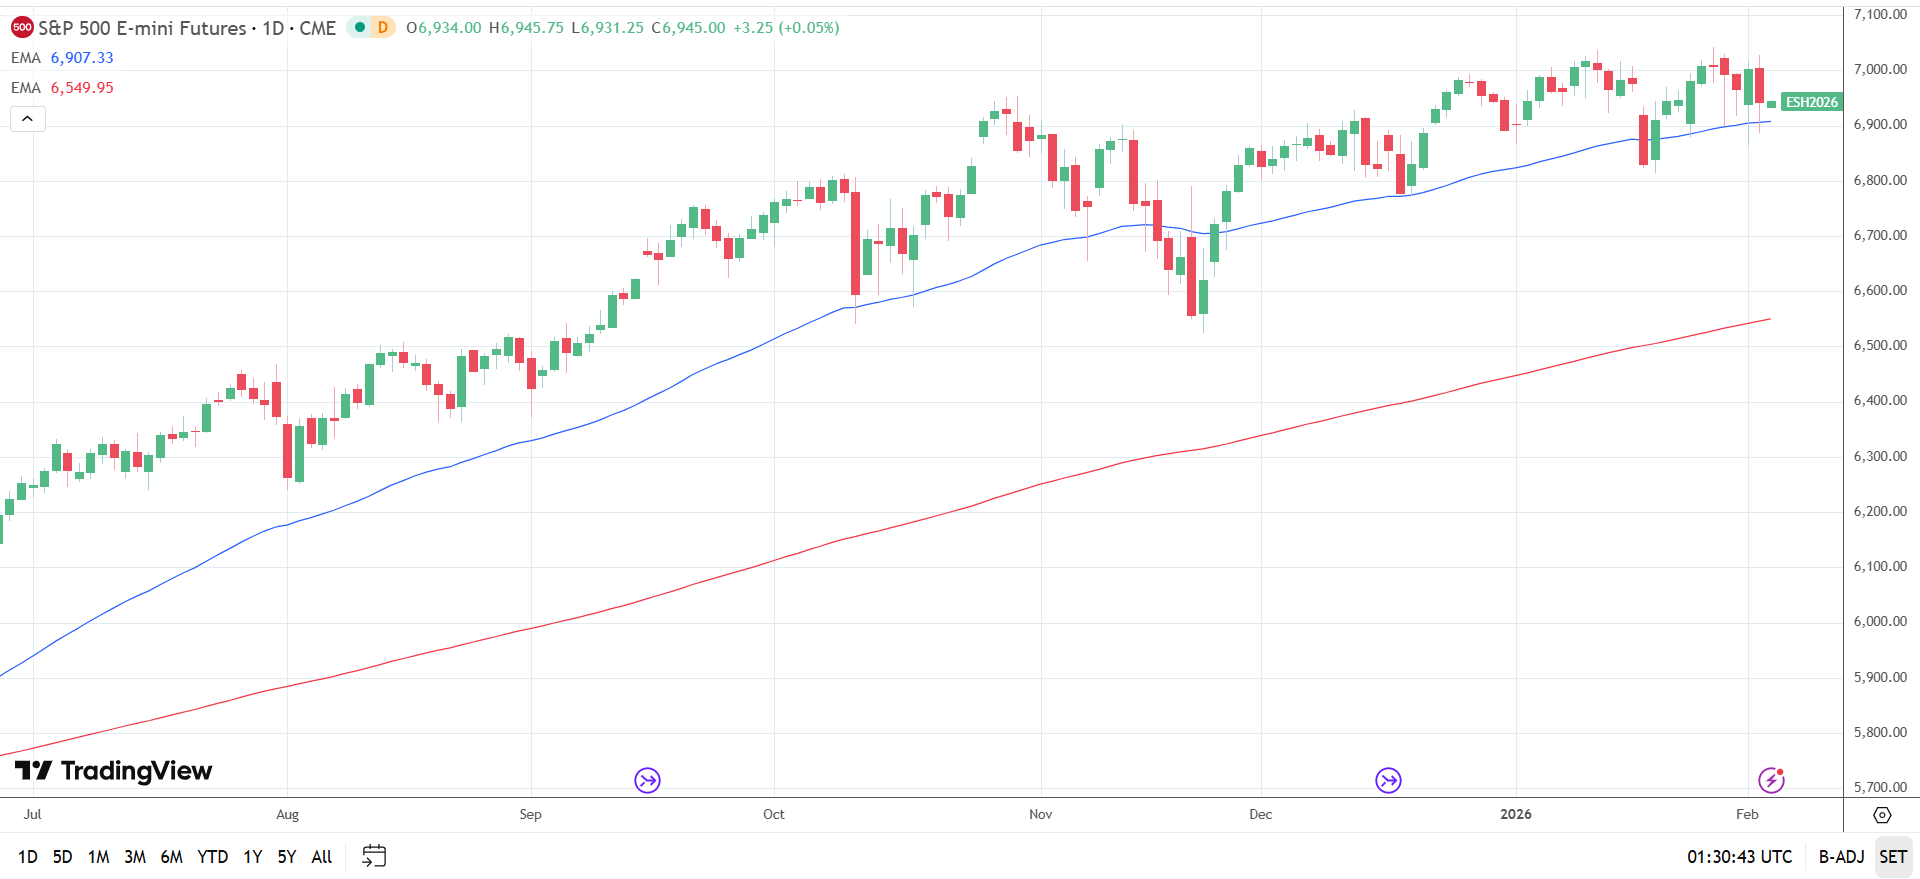
US futures trended higher during the Asian session on February 4. The Dow Jones E-mini climbed 38 points, while the Nasdaq 100 E-mini and the S&P 500 E-mini gained 2 points and 3 points, respectively.
Later on Wednesday, the US ISM Services PMI will influence market bets on an H1 2026 Fed rate cut. Economists expect the ISM Services PMI to drop from 54.4 in December to 53.5 in January. A lower-than-expected PMI reading would signal a loss of economic momentum, given that services contribute around 80% to US GDP.
However, traders should consider the ISM Prices PMI, given the Fed’s concerns about elevated inflation. Economists forecast the ISM Prices PMI will fall from 64.3 in December to 64.0 in January. Softer prices would signal cooling inflationary pressures, supporting a more dovish Fed rate path. Rising bets on an H1 2026 Fed rate cut would lift sentiment.
Beyond the data, traders should closely track FOMC members’ speeches. Views on the labor market, inflation, and monetary policy would also influence sentiment.
However, corporate earnings results will continue to dictate near-term market trends, with Amazon.com’s earnings results looming.
Despite ongoing concerns about AI-linked stocks and returns on investment, robust earnings and slower service sector activity would support a cautiously bullish short-term and positive medium-term outlook for US stock futures.
Key Technical Levels for Dow Jones, Nasdaq 100, and S&P 500
Tuesday’s pullback left the Nasdaq 100 E-mini trading below its 50-day EMA, while holding above the 200-day EMA. The EMA positions signaled a bearish near-term, but bullish longer-term outlook. Meanwhile, the Dow Jones E-mini and the S&P 500 E-mini held above their 50-day and 200-day EMAs, indicating a bullish bias, aligning with positive fundamentals.
Near-term trends will hinge on geopolitical risks, earnings, US economic indicators, and central bank rhetoric. Key levels to monitor include:
Dow Jones
- Resistance: the January 13 record high of 49,901 and then 50,000.
- Support: 49,000 and then the 50-day EMA (48,689).
Nasdaq 100
- Resistance: the 50-day EMA (25,563), 26,000, and then the October 30 record high of 26,399.
- Support: 25,000 and then 24,500.
S&P 500
- Resistance: the January 13 high of 7,036, followed by 7,500.
- Support: the 50-day EMA (6,907) and then 6,500.
Outlook: Rate Cut Bets and Earnings Support Bullish Sentiment
In my opinion, the short-term price outlook remains cautiously bullish. Expectations of an H1 2026 Fed rate cut and positive sentiment toward Q4 earnings affirm the bullish medium-term outlook. These fundamentals align with longer-term technicals for US index futures.
However, several factors would test the bullish medium-term outlook, including:
- Rising geopolitical risks.
- The Bank of Japan announces a higher-than-expected neutral interest rate (potentially 1.5%-2.5%). A narrower-than-expected US-Japan rate differential may trigger a yen carry trade unwind. Such an event would invalidate the short-term outlook.
- Fed chatter and US economic data cool bets on multiple Fed rate cuts in 2026.
- Corporate earnings and outlooks disappoint.
Conclusion: Constructive Bias Intact
In summary, the resilient US economy, expectations of Fed rate cuts, strong earnings, and a cautiously hawkish BoJ reinforce the short- and medium-term outlooks for US stock futures.
However, traders should monitor BoJ policy cues, threats of yen intervention, and USD/JPY trends. Hawkish BoJ chatter, a dovish Fed rate path, and more intervention warnings could send USD/JPY toward 150, potentially triggering a yen carry trade unwind.
Despite risks of a yen carry trade unwind, US stock futures are likely to test new highs if US economic data raise bets on a June Fed rate cut. Fed rate cuts are likely to counter yen carry trade risks, given the longer-term effects of lower borrowing costs on company earnings and equity valuations.
Follow our live coverage and consult the economic calendar for real-time market updates.