As investors analyze these currency pairs amidst evolving economic indicators, the forthcoming U.S. data, alongside German 10-year Bond Auction results and Industrial Production m/m figures for the Eurozone, are poised to offer fresh insights.
US Dollar Index (DXY)
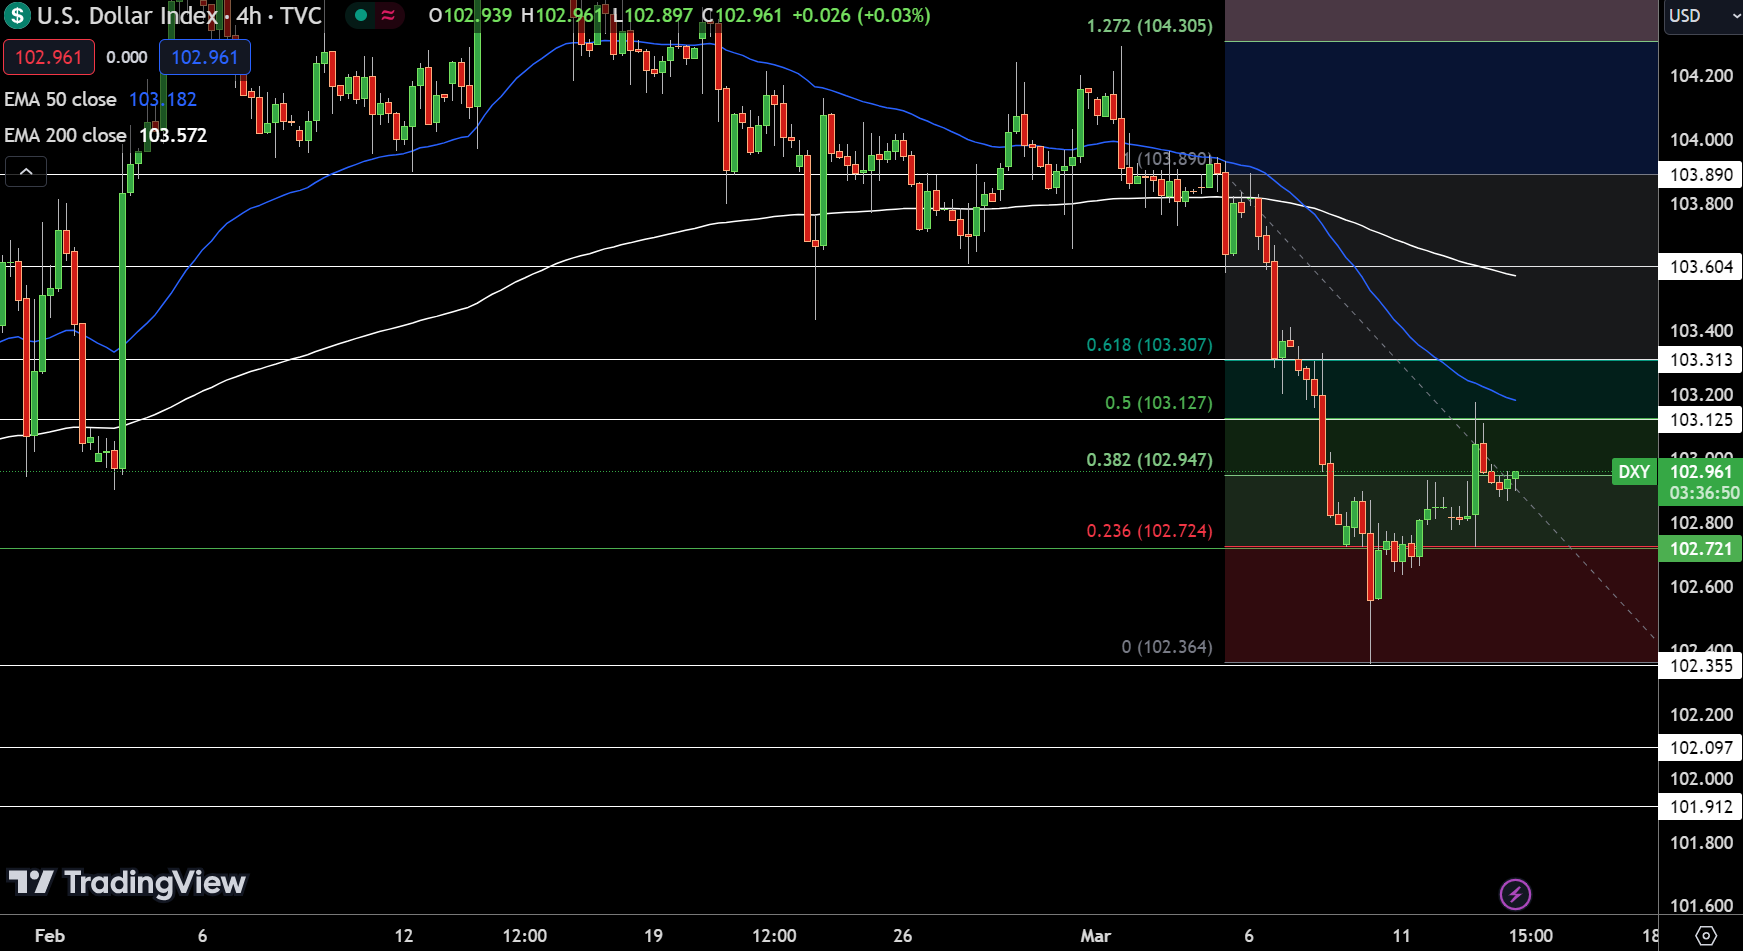
The Dollar Index, a measure of the U.S. dollar against a basket of major currencies, experienced a slight increase of 0.06%, reaching 102.98. Technical analysis indicates the index is currently positioned above its pivot point at 102.72, suggesting a bullish outlook.
Immediate resistance levels are observed at 103.13, 103.31, and 103.60, which could cap further gains. Conversely, support levels at 102.36, 102.10, and 101.91 provide a safety net against potential declines.

The 50-day and 200-day Exponential Moving Averages at 103.18 and 103.57, respectively, reinforce the bullish sentiment, yet a dip below the pivot could prompt a bearish shift.
EUR/USD Technical Forecast
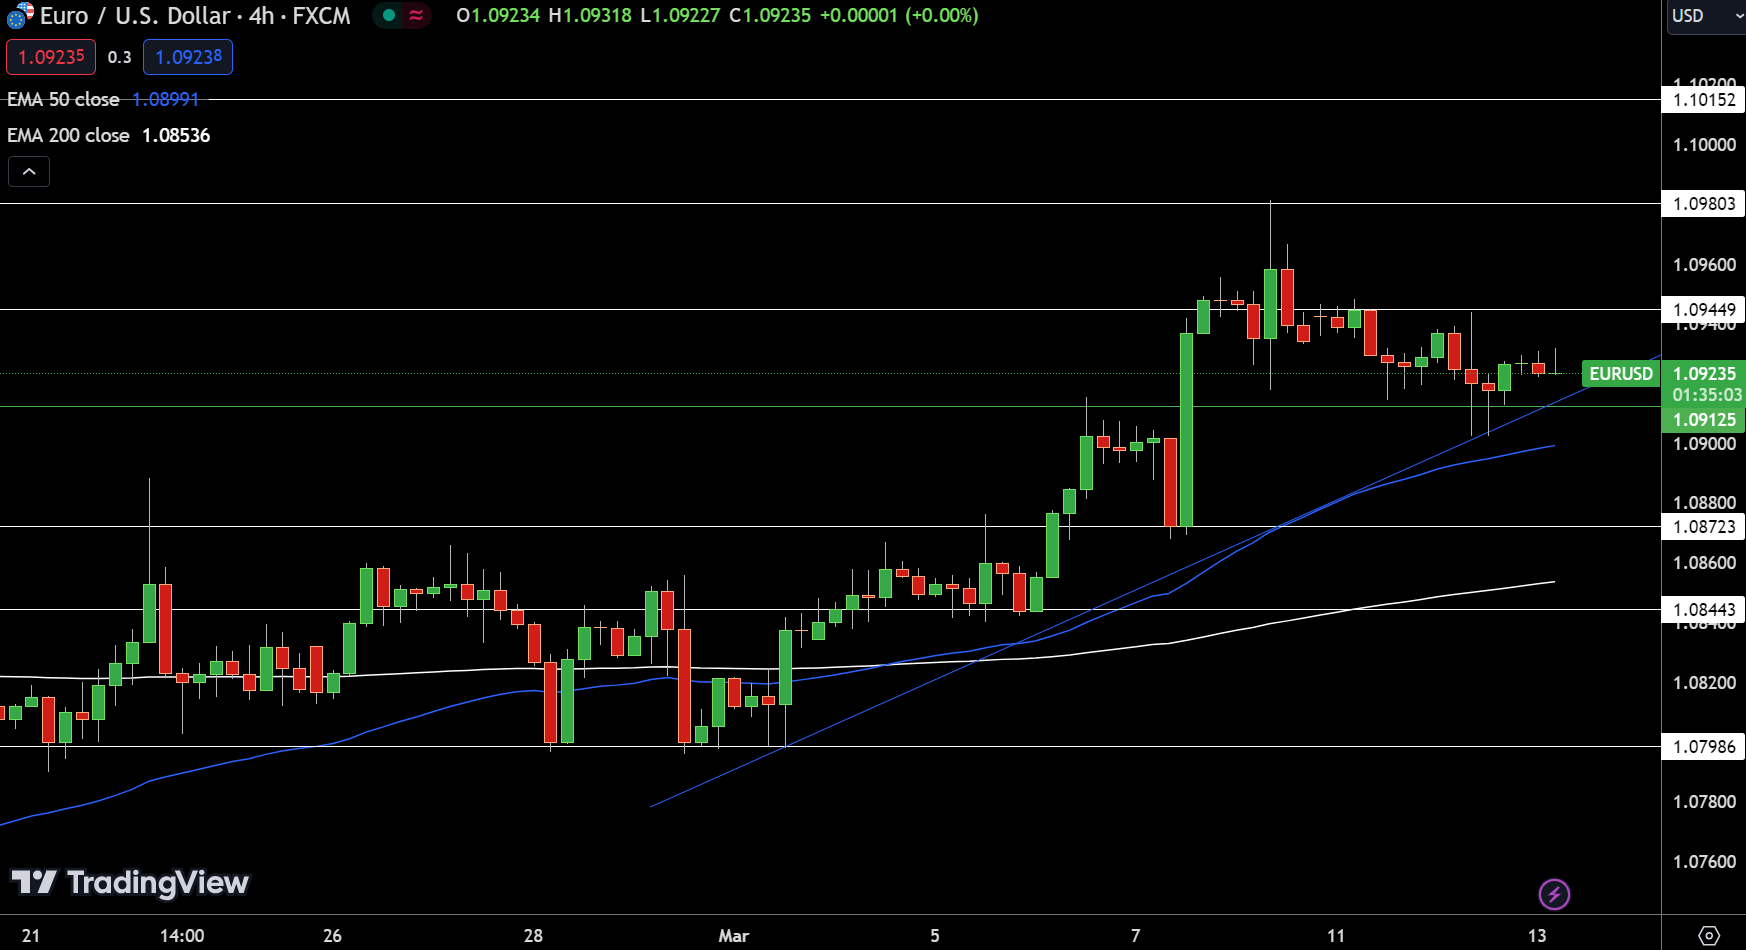
The 50-day and 200-day Exponential Moving Averages, positioned at 1.08991 and 1.08536 respectively, underpin a bullish sentiment. However, a move below the pivot could signify a trend reversal, indicating the importance of the 1.09125 level for future direction.
GBP/USD Technical Forecast
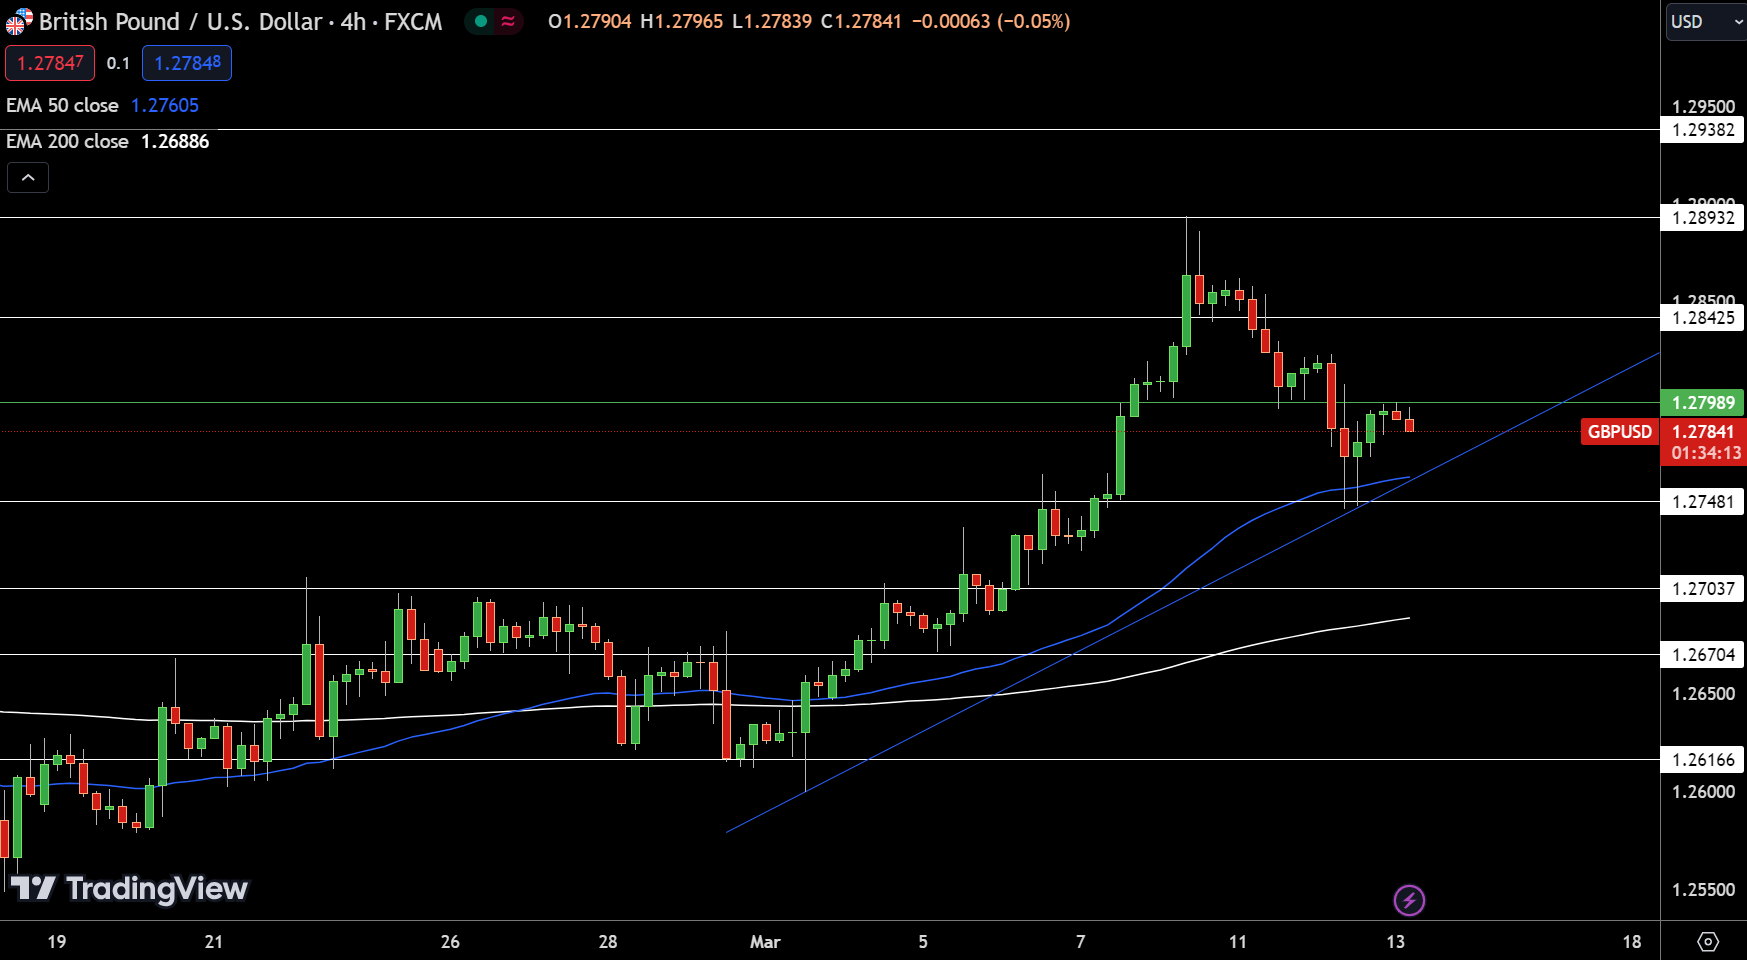
The GBP/USD pair experienced a slight decrease of 0.08%, positioning it at 1.27837. Currently trading just below the pivot point of 1.27989, the pair is at a crucial juncture that could dictate its short-term direction.
Resistance levels identified at 1.28425, 1.28932, and 1.29382 indicate potential challenges for upward movements, while support levels at 1.27481, 1.27037, and 1.26704 provide buffers against further declines. The 50-day and 200-day Exponential Moving Averages, at 1.27605 and 1.26886 respectively, hint at a bearish sentiment below the pivot.
However, surpassing the pivot point could signal a shift towards a more bullish trend, emphasizing the importance of the 1.27989 threshold for future market dynamics.
For a look at all of today’s economic events, check out our economic calendar.