
GBP/USD Video 15.07.20.
British Pound Rebounds After Sell-Off
GBP/USD did not manage to settle below the 20 EMA at 1.2530 and rebounded closer to 1.2600 as the U.S. dollar continued to lose ground amid hopes for a vaccine against COVID-19.
A report in the New England Journal of Medicine stated that Moderna‘s vaccine produced antibodies to COVID-19 in all patients who were taking part in the ongoing phase 1 trial.
A successful vaccine against coronavirus would be a game-changer for the world so markets are very sensitive to vaccine news.
Following the report, the U.S. Dollar Index, which measures the strength of the U.S. dollar against a broad basket of currencies, continued its downside move and declined closer to the 96 level.
A move below this level could lead to increased downside momentum for the American currency and provide additional support to GBP/USD.
The UK has just reported Inflation Rate and Core Inflation Rate for June. Inflation Rate was 0.1% month-over-month compared to analysts’ consensus of 0%. Core Inflation Rate was 0.2% month-over-month while analysts expected that it will remain in the negative territory. On a year-over-year basis, Inflation Rate was 0.6% while Core Inflation Rate was 1.4%.
A similar picture was seen in the U.S. where Inflation Rate and Core Inflation Rate were also a bit higher than the analyst consensus. On a month-over-month basis, the U.S. Inflation Rate was 0.6% while Core Inflation Rate was 0.2%. Stronger inflation suggests a quicker-than-expected rebound in consumer activity.

Technical Analysis
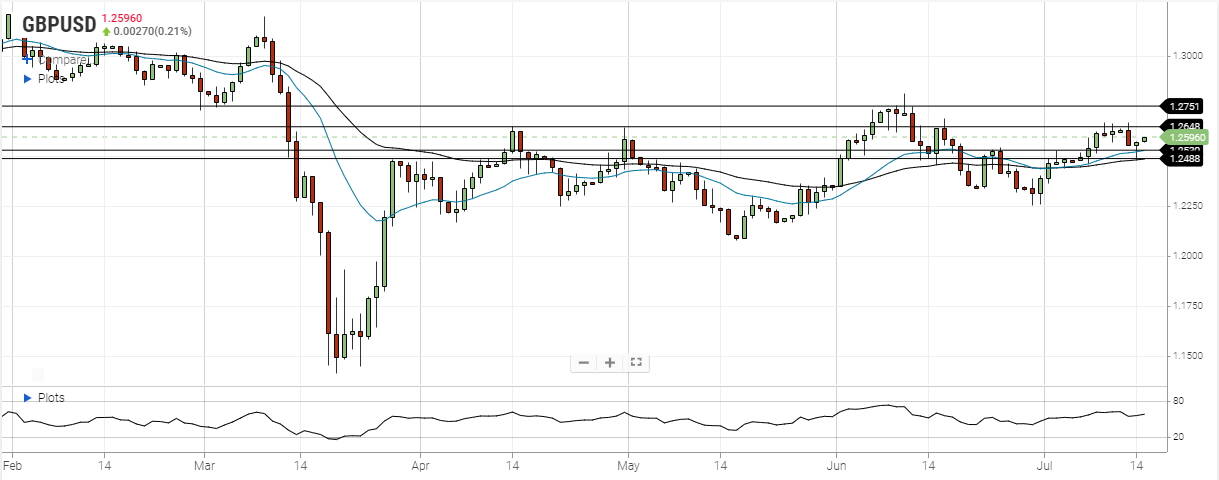
GBP/USD received support at the 50 EMA at 1.2490 and quickly rebounded above the 20 EMA at 1.2530. The nearest resistance level for GBP/USD is located at the high end of the current trading range at 1.2650.
This level has already been tested many times, and GBP/USD failed to develop additional momentum above 1.2650. In case GBP/USD manages to get above this level, it will head towards the next resistance at 1.2750.
On the support side, the nearest support level for GBP/USD is located at the 20 EMA at 1.2530, while the main support is at the 50 EMA at 1.2490. A move below the 50 EMA will signal a change of a near-term trend.
US Dollar Index Price Forecast
Every new US Dollar Index analysis as it publishes, today's technical signal and key levels, live price — on one page.
See all US Dollar Index forecastsFor a look at all of today’s economic events, check out our economic calendar.