
Gold Is Lower Because the Long Bond Is Winning the Argument
Spot Gold is down Tuesday even with the dollar sitting near multimonth lows. The long end of the Treasury curve is overriding the softer currency. The 30-year yield hit a fresh 19-year high before easing to 5.305% and the 10-year is holding near 4.72%. That is the side of the rate trade that matters today. September hike odds have dropped near 35% after weaker data, but the long bond is not buying the same story the front end is selling.
Brent crude is back above $91 with the Strait of Hormuz still effectively closed. That keeps the inflation argument alive for every bond seller watching the fiscal numbers. Gold has been unable to clear the resistance zone that has capped the rally for six straight sessions and the pressure from long yields is the reason.
At 14:35 GMT, Spot Gold (XAUUSD) was trading $4,392.68, down $24.00 or 0.54%.

The Dollar Gave Gold Room and Gold Could Not Use It
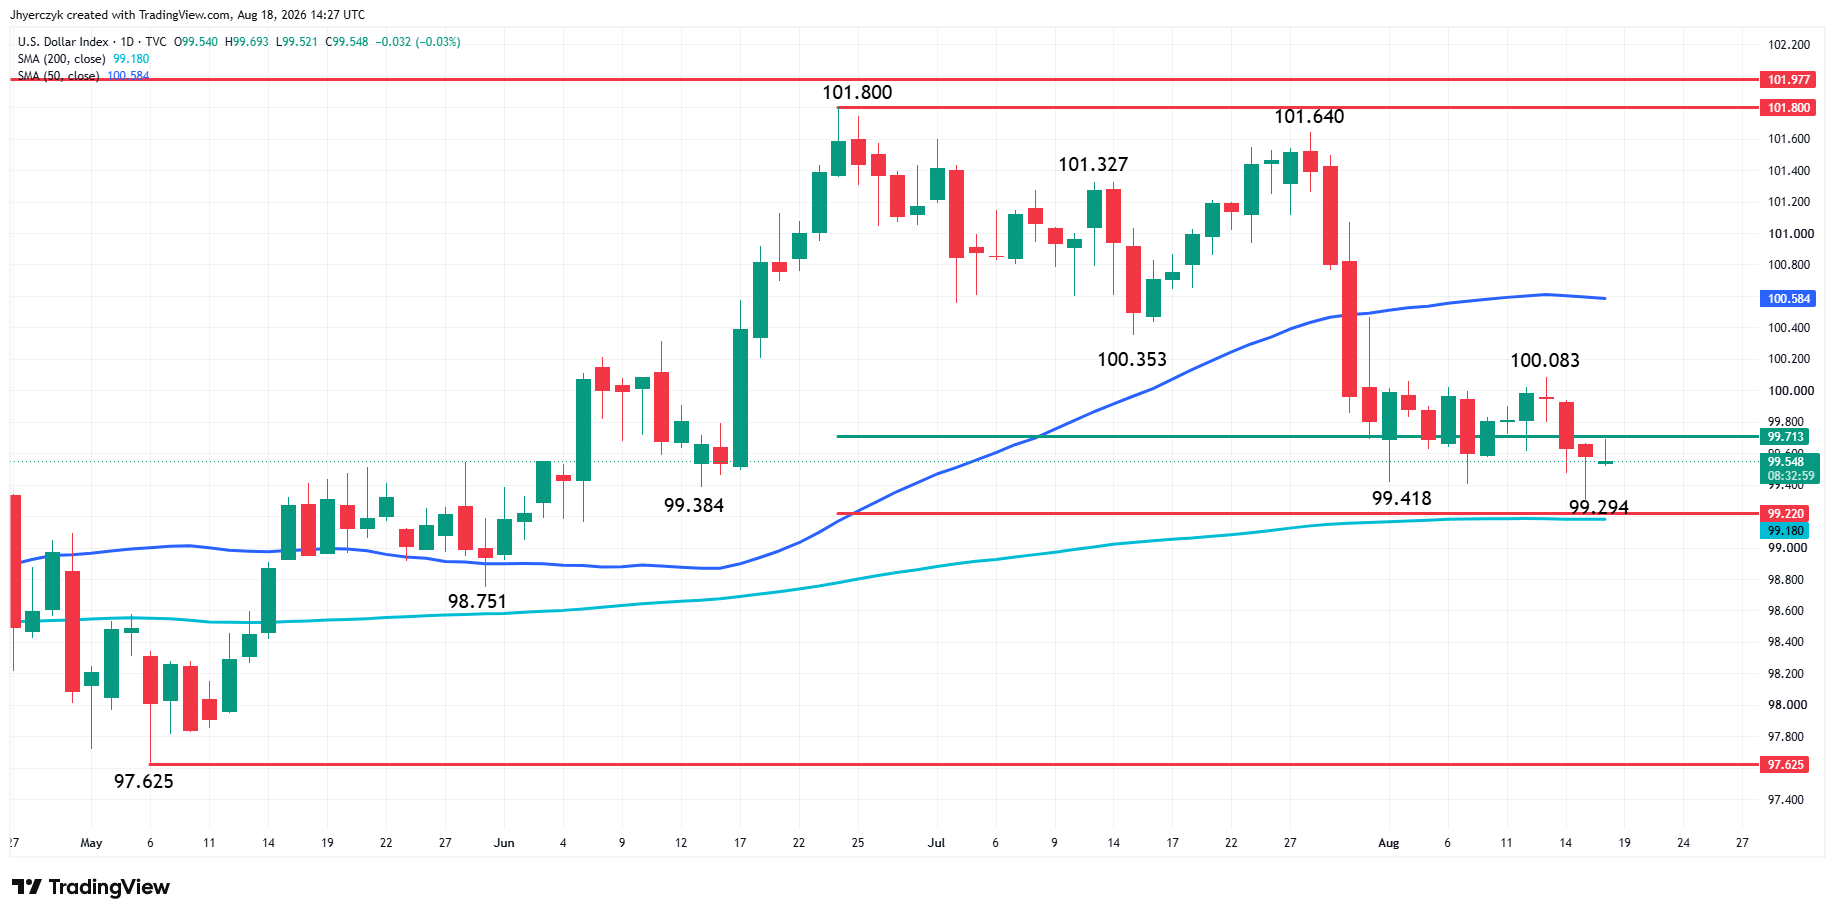
The dollar index rose about 0.1% Tuesday to 99.62 after falling to multimonth lows on the back of weaker payrolls, contained CPI, flat PPI and soft retail sales. The euro eased from Monday’s two-month high near $1.161 and traded around $1.157. Sterling slipped about 0.1%. The yen also lost ground.
The currency is not strong in the larger picture. Traders cut September hike odds from 52% a week ago to about 35%. Five reports in a row came in softer than expected. Gold should be running with that backdrop and it is not. The dollar has not broken down with conviction. It is near the lower end of its range but safe-haven flows tied to the Middle East are keeping a bid underneath it.
Monday gave gold the dollar and yields moving together. Tuesday took the yield side away. One without the other has not been enough to push the metal through resistance.
The Fiscal Numbers Are Why the Long Bond Will Not Cooperate
The U.S. fiscal deficit reached $432.3 billion in July, the highest monthly total since March 2021. The year-to-date shortfall is nearing $1.8 trillion. Interest on the nearly $40 trillion national debt has already cost the government about $1.2 trillion this year.
Gold Price Forecast
Every new Gold analysis as it publishes, today's technical signal and key levels, live price — on one page.
See all Gold forecasts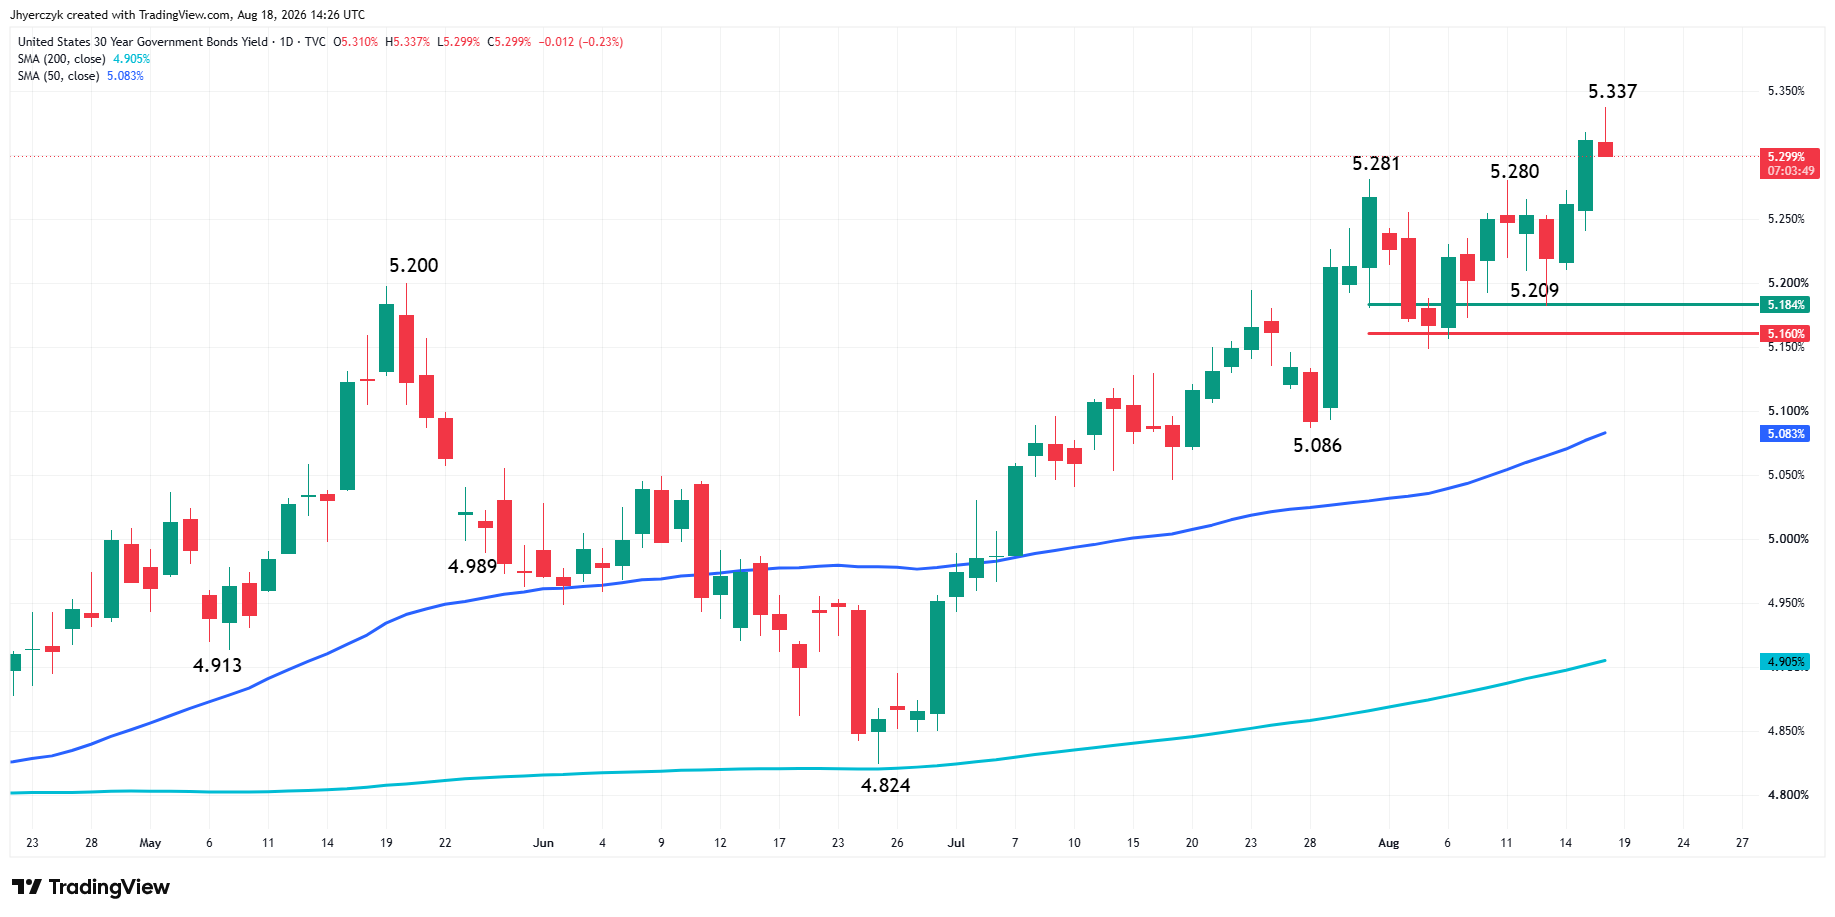
The 30-year yield is pricing those numbers. Treasury buyers want more compensation and they are also competing with corporations raising debt for AI data centers, power infrastructure and chip purchases. The market has a wall of long-term paper to absorb and it is demanding a higher yield to take it.
The two-year is tracking the softer data and lower hike odds. The 30-year is tracking deficits, issuance and inflation above target. Gold got the front end of the curve it wanted. The long end is taking it away.
Crude Above $91 Keeps the Inflation Risk on the Table
Brent crude rose to around $91.10, its strongest level since July 30. The Strait of Hormuz remains effectively closed. The ceasefire has ended. Iran is threatening a fully offensive military stance and Washington is not extending the arrangement.
July’s CPI and PPI came in friendly because gasoline prices had fallen earlier in the collection period. The next round of data has a better chance of capturing higher fuel costs. Gasoline is still above $4 per gallon and crude is climbing, not settling. That gives long-bond sellers another reason to stay active and it gives the Fed a reason to keep the door open even if the growth data is softening.
Gold is caught between the weaker growth numbers and an oil market that can rebuild the inflation case in one move.
FOMC Minutes Wednesday Are the Next Risk
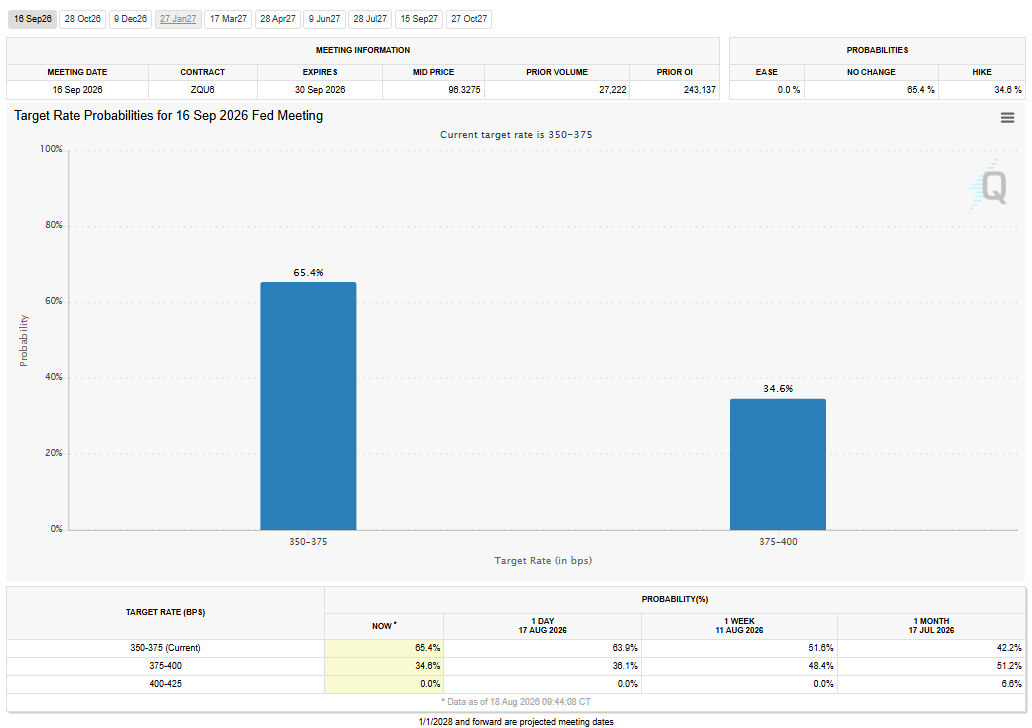
Hammack, Kashkari and Logan voted for a hike in July. The rest held. Wednesday’s minutes will tell gold traders how close that 9-3 became something worse. Three dissents on a hold is already a wide split. If the minutes show a fourth or fifth official leaning the same way, the 35% September odds move higher fast.
Jackson Hole is right behind it. The long bond is already telling the Fed that softer payrolls and one contained CPI do not settle the inflation question when crude is back above $91 and deficits are running at this pace. Gold traders will be watching whether policymakers push back on that message or confirm it.
Daily Spot Gold (XAUUSD) Technical Analysis
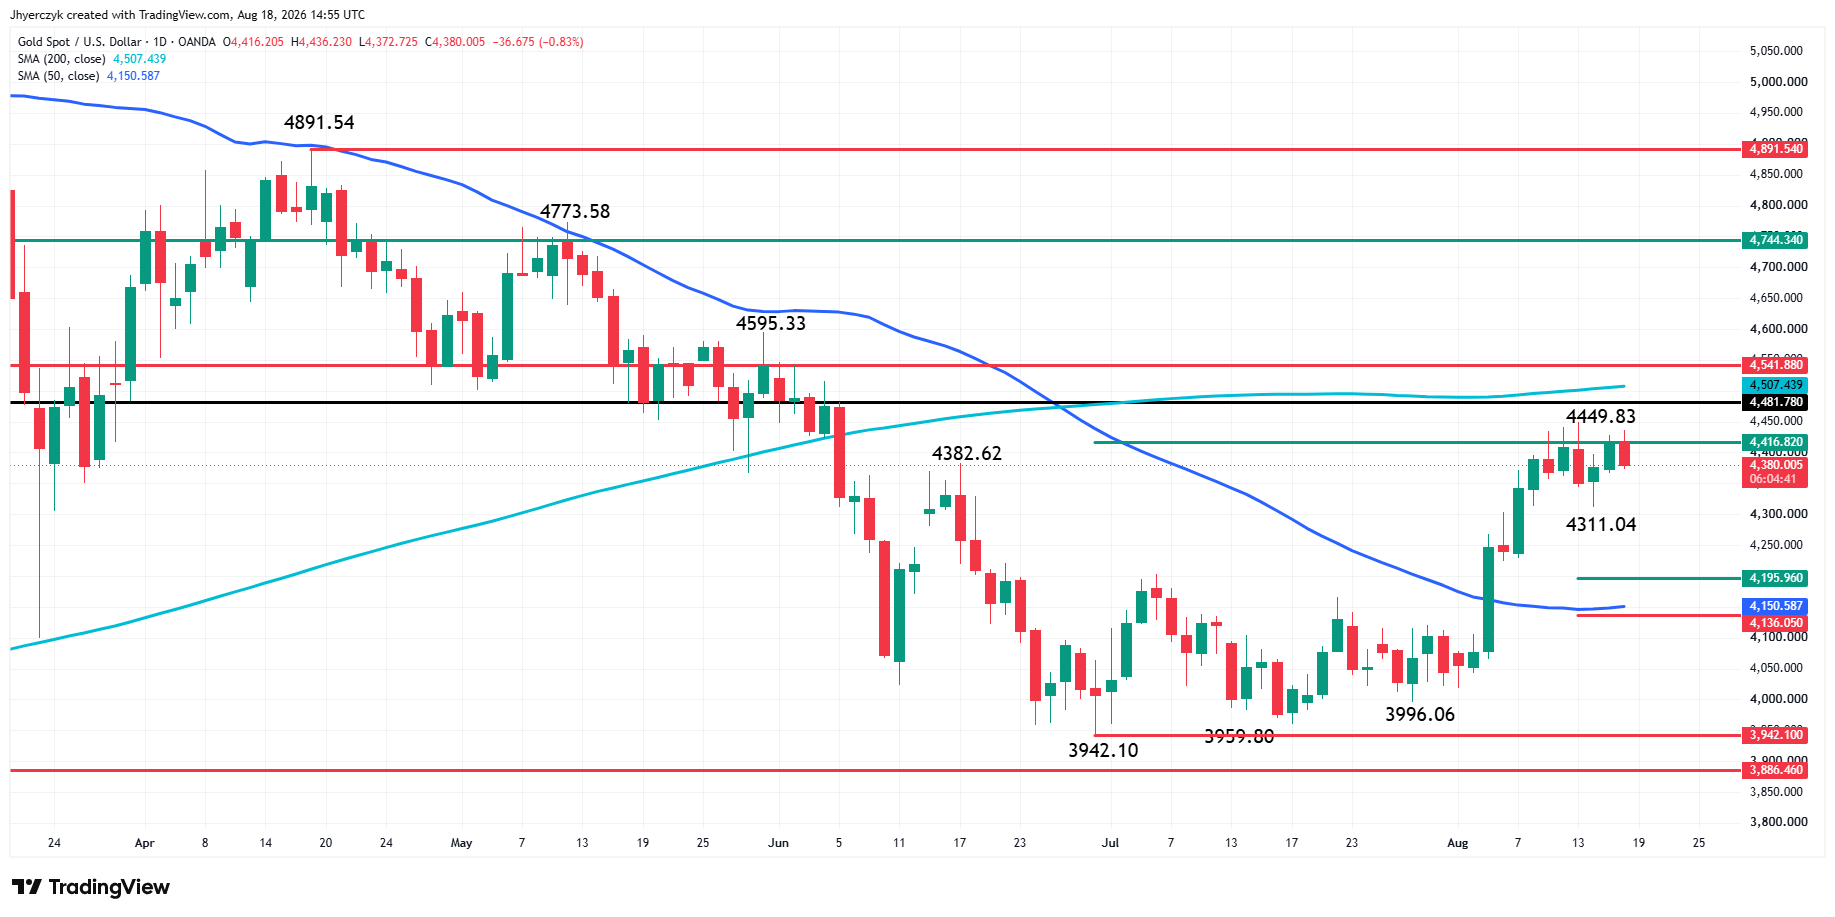
Daily Spot Gold (XAUUSD) is edging lower on Tuesday. The main trend is up, but traders are struggling to take out $4449.83 to reaffirm the uptrend. The trend will turn down on a move through the last swing bottom at $4311.04.
The long-term range is the April 17 main top at $4891.54 and the June 30 main bottom at $3942.10. Its 50% level at $4416.82 has been providing resistance for six straight sessions. Additional resistance is the 200-day moving average at $4507.45. The longer-term bulls are hoping for a breakout over this indicator in order to draw in the institutions.
The short-term range is $3942.10 to $4449.83. If the trend changes to down then its retracement zone at $4195.96 to $4136.05 along with the 50-day moving average at $4150.57 will become the primary target zone.
What to Watch
The long bond is running this trade. Gold has the softer dollar and the lower hike odds and neither one has been enough to push through six sessions of resistance. Crude back above $91 is feeding the same fiscal and inflation story that has the 30-year at a 19-year high. FOMC minutes Wednesday can either confirm that the three July dissenters were alone or show the committee is more worried than the vote suggested.
Gold is stuck between a front end that favors buyers and a long end that will not let them through. The 200-day overhead is where the trade changes. The swing bottom below is where it breaks. The bond market picks the direction.
If you’d like to know more about how to trade gold, please visit our educational area.