
Gold Trims Wednesday’s Rally as Yields Recover and the Fed Stays Hawkish
Spot Gold is lower Thursday after Wednesday’s Treasury-driven surge ran into profit-taking and a bond market that started moving the other direction overnight. The 4% rally was the strongest single-session move in weeks. Thursday’s pullback landed before the metal could test the 200-day moving average, which has been the level the market has been reaching for since the June bottom.
Yields are recovering. The FOMC minutes reminded the market that several officials are still prepared to raise rates if inflation does not cool. Crude oil near multi-week highs is keeping the inflation argument in front of every Fed official watching the data. Wednesday gave gold the Treasury buyback, lower yields and a weaker dollar all at once. Thursday is taking the yield side away.
At 11:56 GMT, Spot Gold (XAUUSD) was trading at $4,471.03, down $52.02 or 1.15%. The metal reached a session high of $4,523.86 and a low of $4,465.89.

The Bond Market Took Back What Treasury Gave
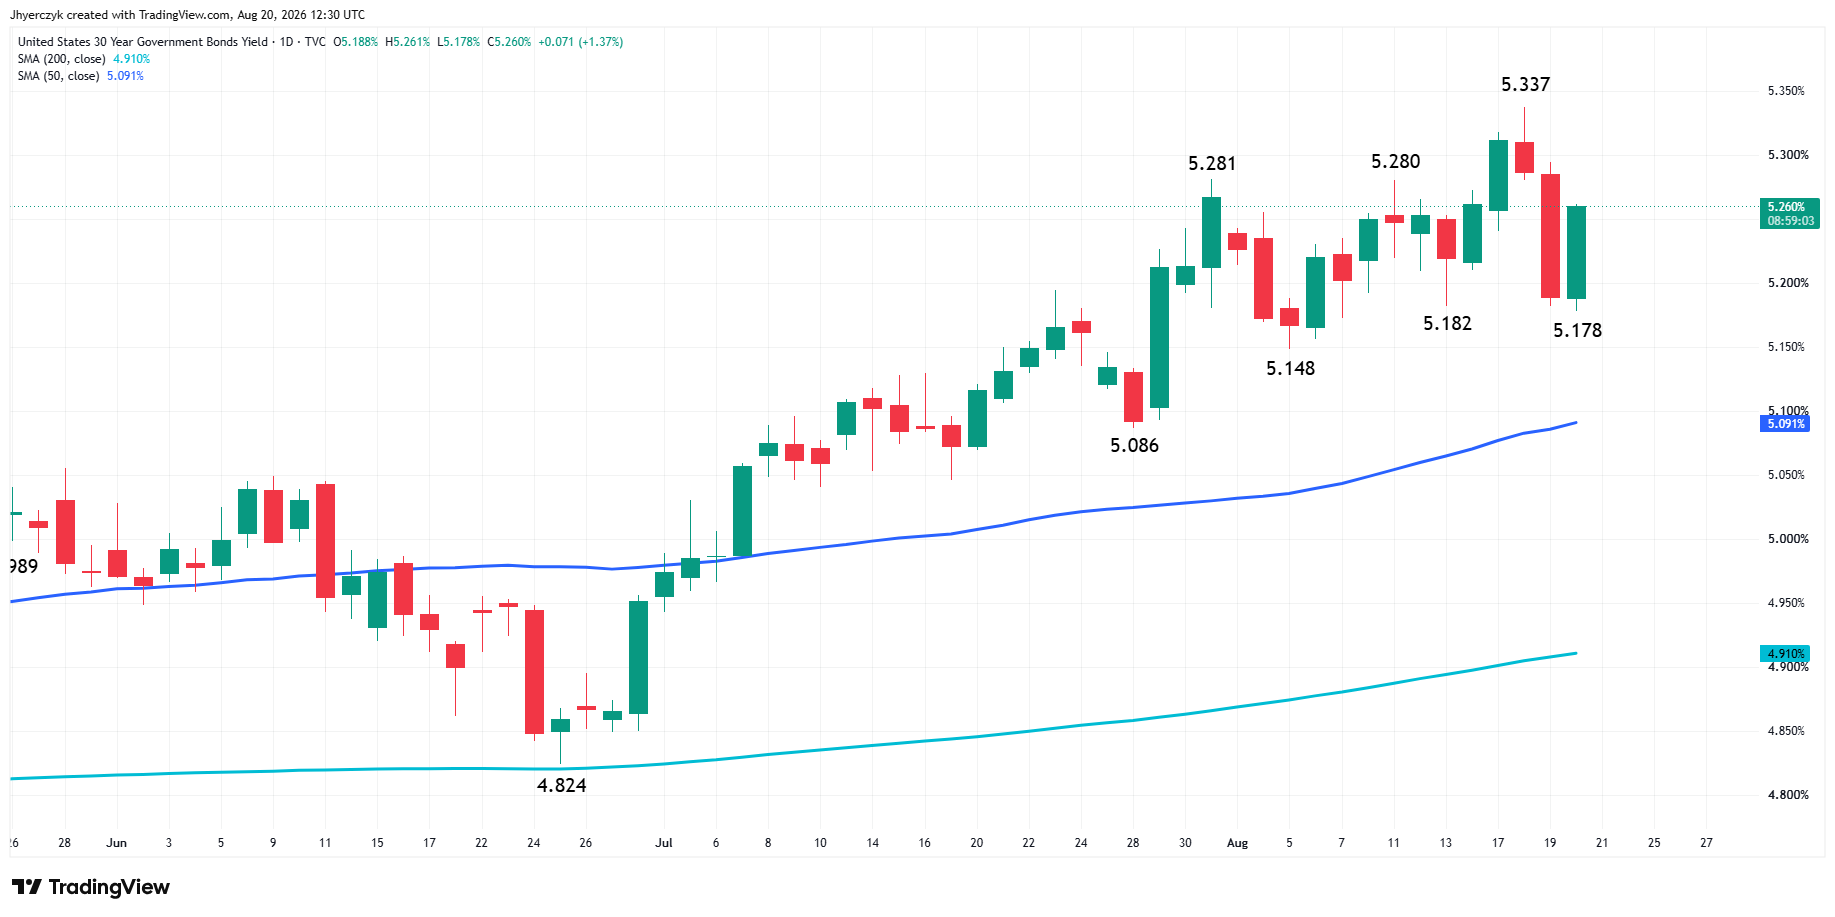
Treasury yields started recovering Thursday after Wednesday’s sharp drop on the buyback announcement. The 30-year had fallen hard on the news that Treasury would double the size of its longer-dated buyback operations. Thursday’s bounce says the announcement interrupted the yield rally. It did not end the forces driving it.
The fiscal deficit, heavy issuance and corporate borrowing are still there. The buyback program does not start until September 9. Between now and then, the bond market has to absorb the same supply of long-dated paper that pushed the 30-year to a 19-year high earlier in the week.
Wednesday’s rally needed yields to keep falling. They stopped. The metal had already made the big move and once the bid underneath bonds weakened, traders who bought the dip had a reason to take profits at higher prices. The dollar remains softer than it was earlier in the summer but a rebound in yields alone was enough to bring sellers into gold after the advance.
The Fed Minutes Were Not What Gold Buyers Wanted to Hear
The FOMC minutes from the July meeting showed several officials still concerned about inflation. Some were prepared to consider raising rates further. The vote was 9-3 to hold, but the internal discussion read more hawkish than the market had been pricing.
Gold Price Forecast
Every new Gold analysis as it publishes, today's technical signal and key levels, live price — on one page.
See all Gold forecastsSeptember hike odds are near one in three. The recent data had been moving in gold’s favor. Payrolls weakened. CPI was contained. PPI was flat. Retail sales fell. That sequence had been pulling hike expectations lower and giving gold buyers room to work. The minutes pushed back against the idea that the committee was comfortable standing pat.
Gold had been trading the data. The minutes told the market the Fed is still trading the inflation side of the ledger. One contained month of price reports did not settle the debate inside the committee.
Crude Oil Is Making the Fed’s Problem Worse
Oil near multi-week highs is the other force working against gold. Brent stayed above $93 Thursday. The Strait of Hormuz remains restricted. The UAE cut financial ties with Iran. No talks are scheduled between Washington and Tehran.
The conflict creates a backdrop that could support precious metals on the breaks. Thursday’s trade is showing the other side again. Elevated crude keeps fuel costs high. Gasoline is still above $4 per gallon. The next round of inflation data has a better chance of capturing the recent move in energy prices than July’s reports did.
That gives the Fed a reason to stay cautious even as the growth data softens. Gold is caught between weaker consumption numbers and an oil market that can rebuild the inflation case before the September meeting.
Daily Spot Gold (XAUUSD) Technical Analysis
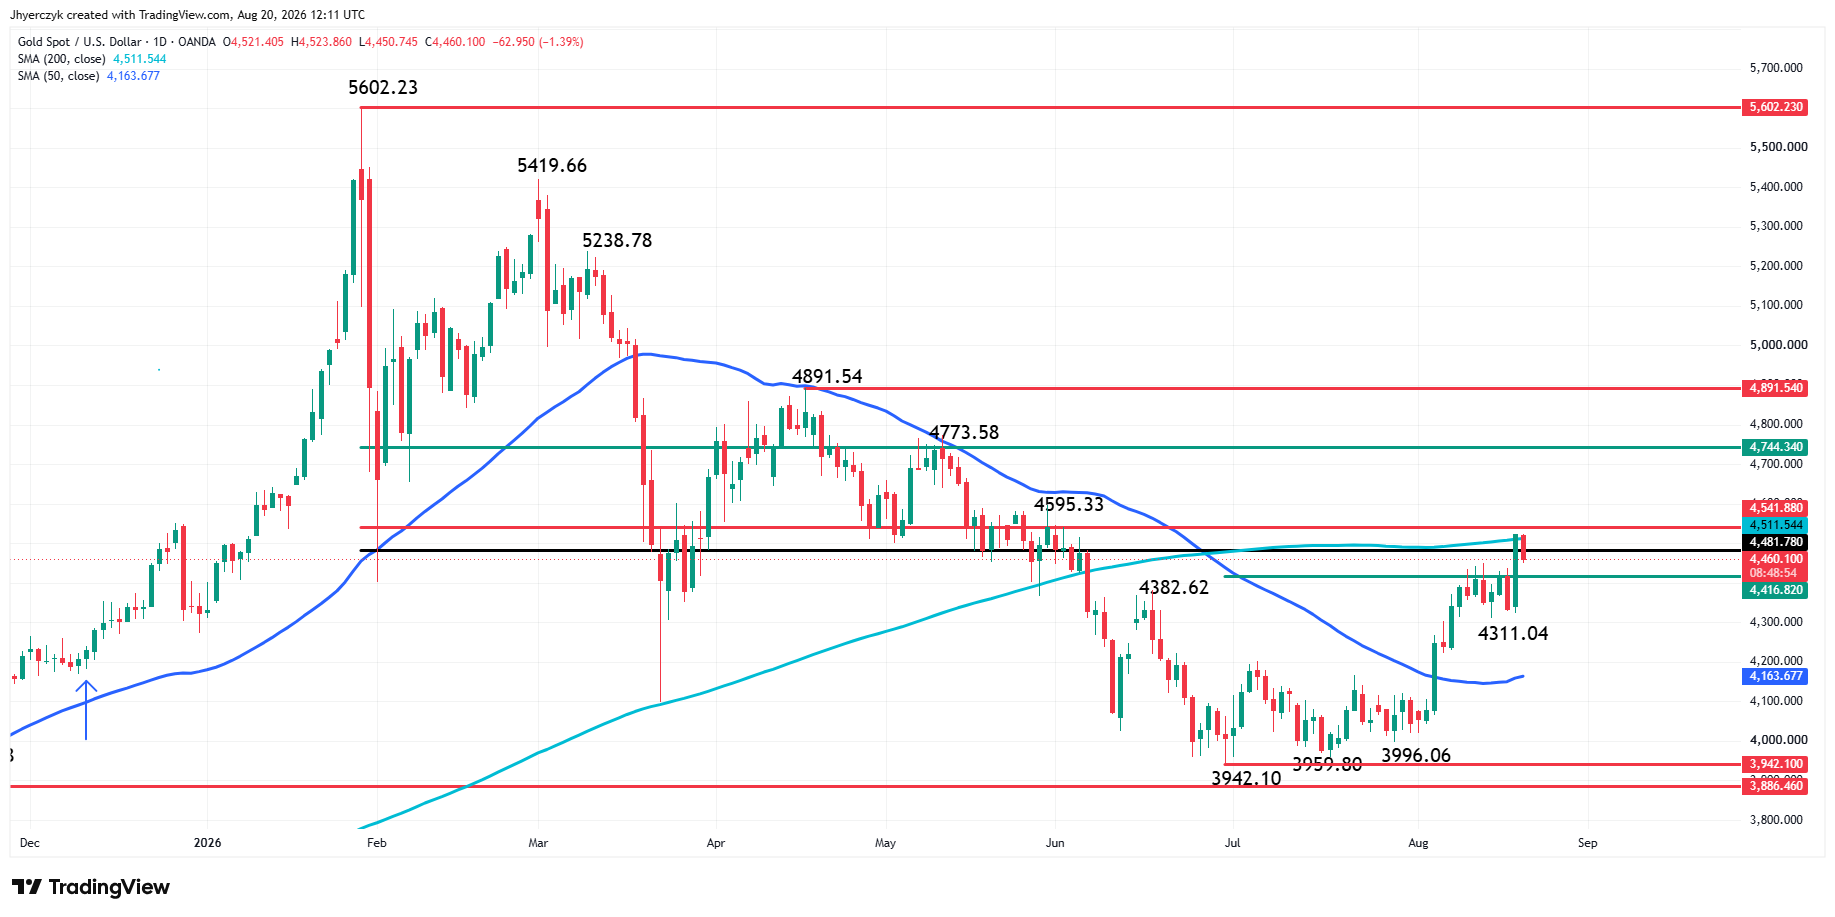
Spot Gold is edging lower on Thursday after failing to follow through to the upside following yesterday’s high at $4524.34. The 200-day moving average at $4511.57 is also a factor preventing the continuation of the rally.
The main range by my calculations is $3886.46 to $5602.23. Its 50% to 61.8% retracement zone is $4744.34 to $4541.88. Once the market overcomes the 200-day MA with conviction, the first upside target is this zone.
Today’s weakness has also put the market back under $4481.78 and back into bear market territory.
The nearest support is a minor 50% level at $4416.82. Spot gold spent about two weeks testing this level prior to Wednesday’s rally. It may prove to be strong support if tested today. If it fails, then we could see a test of the swing bottom at $4311.04. Momentum could shift back to the downside if this level doesn’t hold as support.
While the 200-day MA is acting like resistance, the 50-day moving average at $4163.69 is starting to hook up, which could develop into a strong near-term bullish signal.
What to Watch
Wednesday’s Treasury rally lost momentum overnight and yields found buyers again. The FOMC minutes added selling pressure by putting another rate increase back into the discussion. Crude above $93 is keeping the inflation risk alive and giving the Fed a reason to stay cautious regardless of what the growth data shows. Gold needs yields to resume their decline and the dollar to stay soft. Thursday has one of those conditions and not the other.
The metal failed just short of the 200-day moving average at $4511.57 and dropped back under the bear market threshold at $4481.78. The two-week support at $4416.82 is the first level where buyers showed up before Wednesday’s rally. Below that, the swing bottom at $4311.04 is where the trend changes. The 50-day is starting to hook higher, which is a signal the bulls want to see develop. The 200-day overhead remains the line that separates the current range from a move that draws institutional money back into gold.
If you’d like to know more about how to trade gold, please visit our educational area.