



Additionally, speeches from Fed officials Barr, Harker, Mester, and Bostic are anticipated. Despite the potential for hawkish commentary boosting the USD, which could cap gold’s upside, the overall sentiment remains supportive for gold.
Inflation and Retail Sales Data
In April, the US Consumer Price Index (CPI) increased by 3.4% year-over-year (YoY), down from 3.5% in March. Monthly CPI rose by 0.3%, below the expected 0.4%.
Core CPI, excluding food and energy, increased by 3.6% YoY, easing from 3.8% in March. Retail sales were flat in April, following a 0.6% rise in March, underperforming the forecasted 0.4%.
Central Banks Boost Gold Demand
According to the World Gold Council’s Q1 2024 report, global gold demand increased by 3% to 1,238 tonnes, the strongest first quarter since 2016. Central banks, including the People’s Bank of China, are increasing gold holdings while reducing exposure to US Treasury securities.
Julius Baer noted that this shift, driven by political motivations, supports structurally high gold prices without necessarily driving them higher.
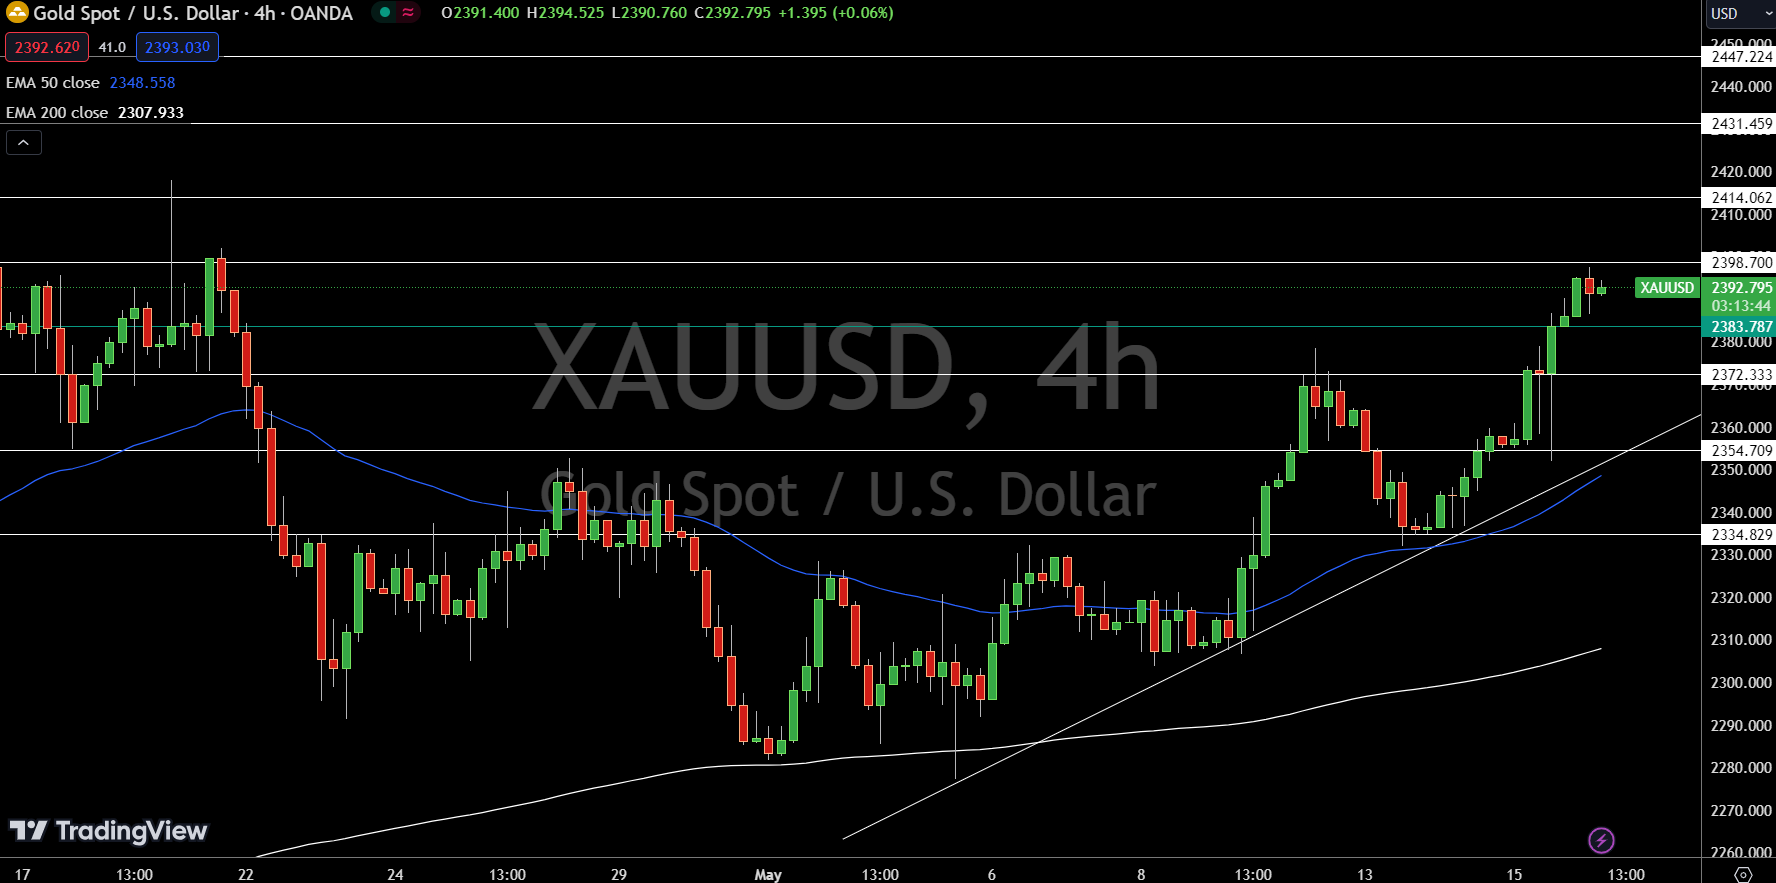
Technical indicators show mixed signals. The 50-day Exponential Moving Average (EMA) is at $2348.56, and the 200-day EMA is at $2307.93, both suggesting a bullish trend above these levels. However, a double top pattern around the $2398 level indicates potential bearish pressure.
In conclusion, gold’s outlook is bearish below $2398. A break above this level could boost bullish momentum, while a break below the pivot point at $2383.79 may drive a bearish correction towards $2373.


