$4,450 Rejection Raises Pullback Risk
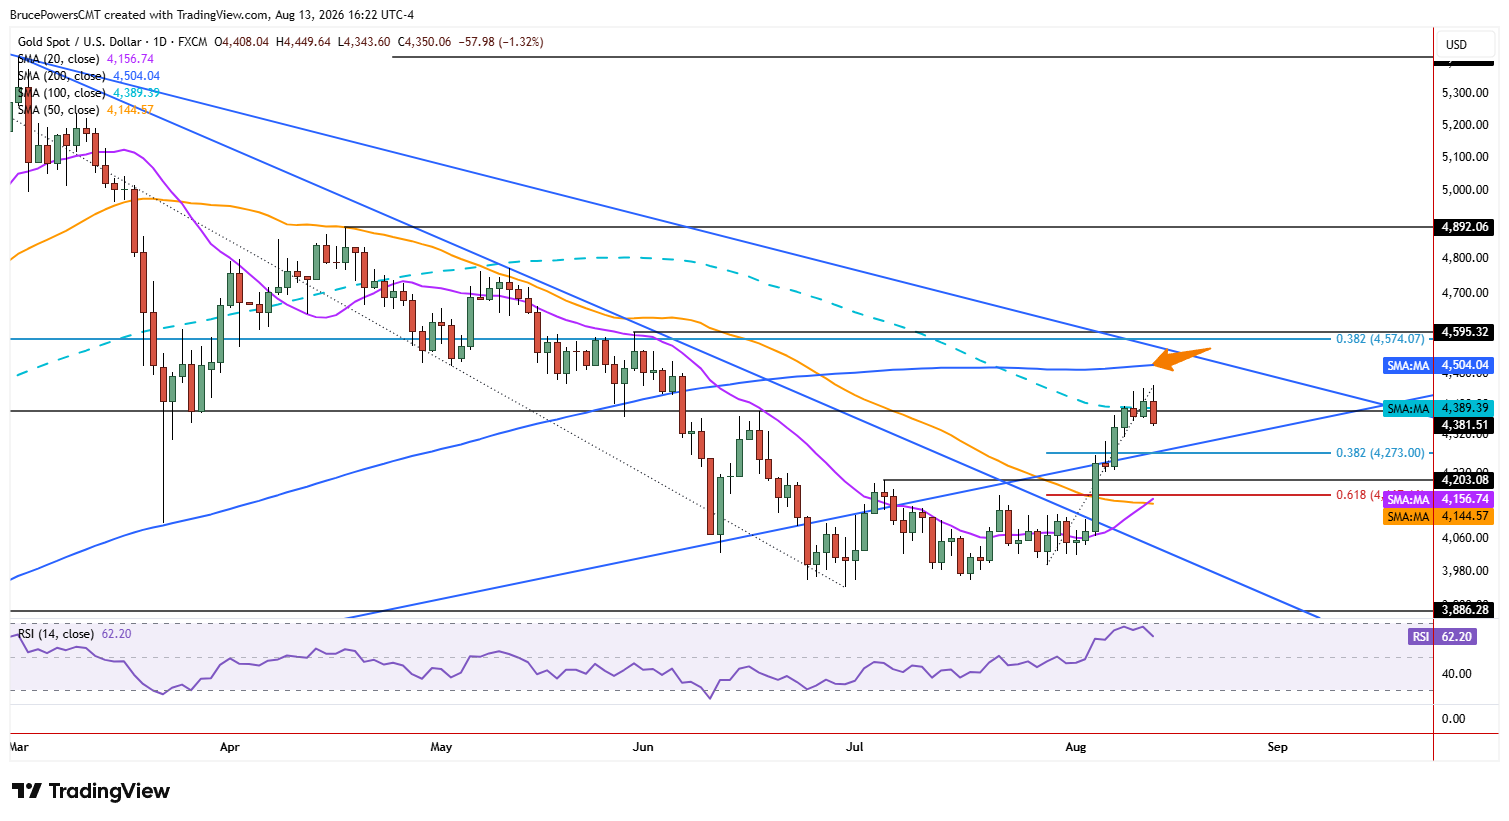
Gold showed signs of weakening on Thursday that could lead to a pullback. A bearish outside day developed following a failed attempt to extend the short-term bull trend. Earlier in the session, a slightly new high of $4,450 was reached before sellers took back control, resulting in a bearish intraday trend that looks set to end near the lows of the session. A daily close below $4,357 would confirm a two-day bearish reversal. That would strengthen the case for a short-term correction after the recent advance, particularly given the resistance that has emerged near $4,382-$4,389.

Resistance Cluster Challenges Recovery
Resistance has held near the confluence of a lower swing high near $4,382 and the 100-day moving average around $4,389. The lower swing high is joined by a more significant earlier peak of $4,382 in October 2025. This clustering of resistance adds significance to the current failure to extend the advance and increases the importance of the $4,357 level for confirming further weakness.
An initial potential support area for a deeper pullback would be around the 38.2% Fibonacci retracement, along with the uptrend line. That trendline failed as support in late June but it subsequently recovered the line without gold falling very far below it. A successful test of that support would therefore help preserve the broader recovery structure despite near-term weakness.
How Deep Could a Pullback Go?
Certainly, there are lower potential targets if support fails at the trendline, with trading above the uptrend line showing greater underlying strength of the recovery than if lower levels are tested. Nonetheless, a typical pullback may test support near the lower swing high near $4,203 or the 50-day moving average around $4,145. Each of those levels is below the uptrend line. Taken together, another decline below the rising trendline should not necessarily be a concern for the bulls given potential dynamic support represented by the 50-day moving average, as well as the 20-day moving average near $4,157. However, a decisive break below both moving averages would weaken the short-term bullish structure and increase the probability of a deeper retracement.
Weekly Chart Adds Another Warning
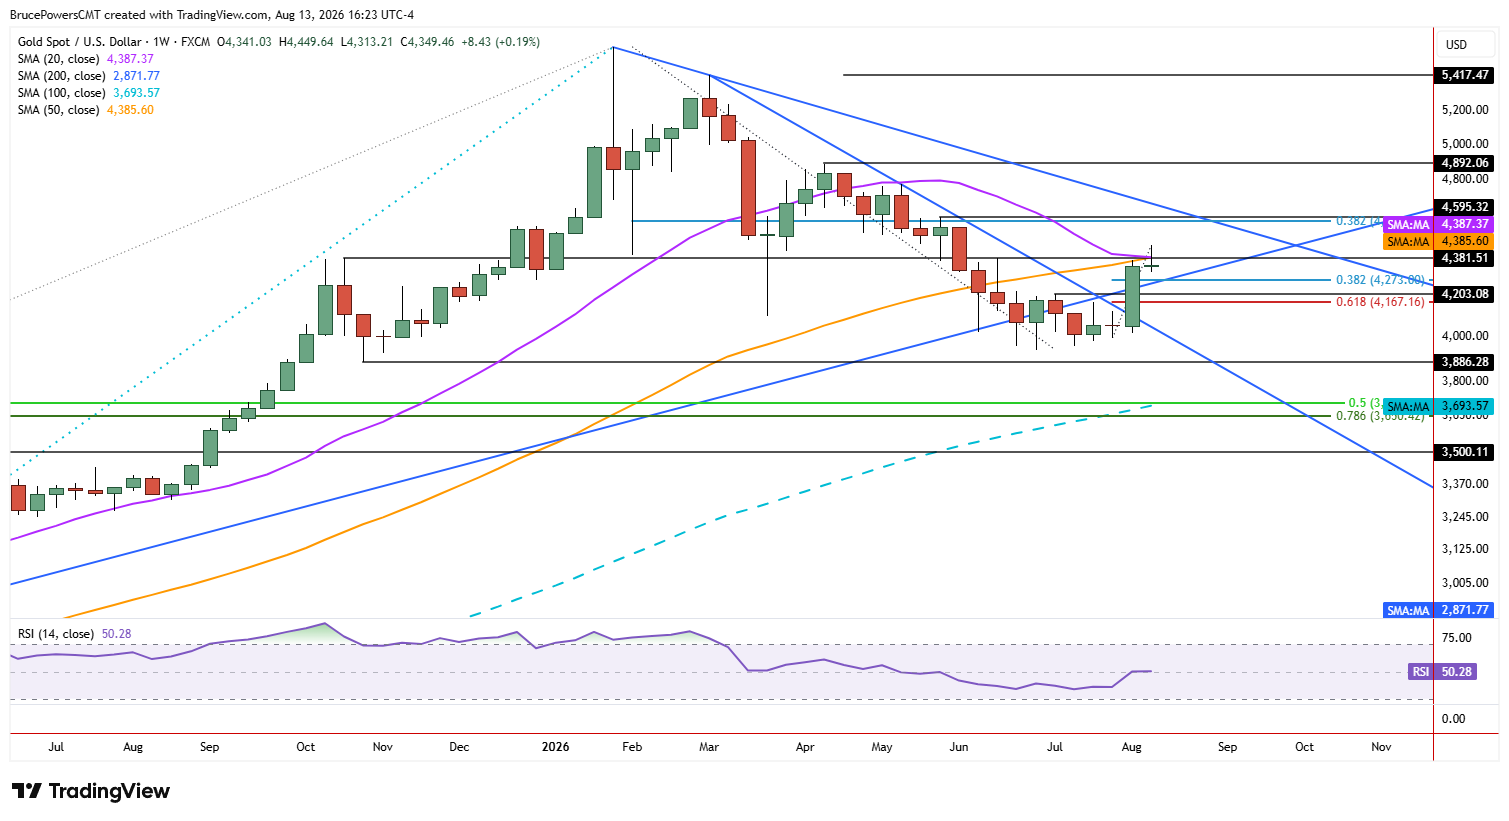
Further, with one day left to the week, gold is at risk of generating a bearish candlestick pattern and setting up a potential one-week bearish reversal on a drop below this week’s low. In addition, the weekly chart confirms strong resistance near this week’s highs as the 20-week and 50-week moving averages have converged near this week’s highs. That longer-term resistance reinforces Thursday’s bearish warning. If support holds, the recovery remains intact; a break would signal a deeper correction.
Gold Price Forecast
Every new Gold analysis as it publishes, today's technical signal and key levels, live price — on one page.
See all Gold forecastsIf you’d like to know more about how to trade gold and silver, please visit our educational area.