


Gold Breakout Puts Bulls Back in Control
Gold advanced to a high of $4,166 on Wednesday, triggering a bullish reversal signal on the weekly chart and rising above key trend indicators on the daily timeframe. The advance extended the strength seen during Tuesday’s session and further confirmed the bullish indications. A breakout above both a downtrend line and the 20-day moving average was confirmed.
Since the two indicators were aligned on the breakout day, the pivot zone has slightly greater significance. The ability to hold above this newly reclaimed support area will now be important in determining whether the recent breakout can develop into a broader reversal.
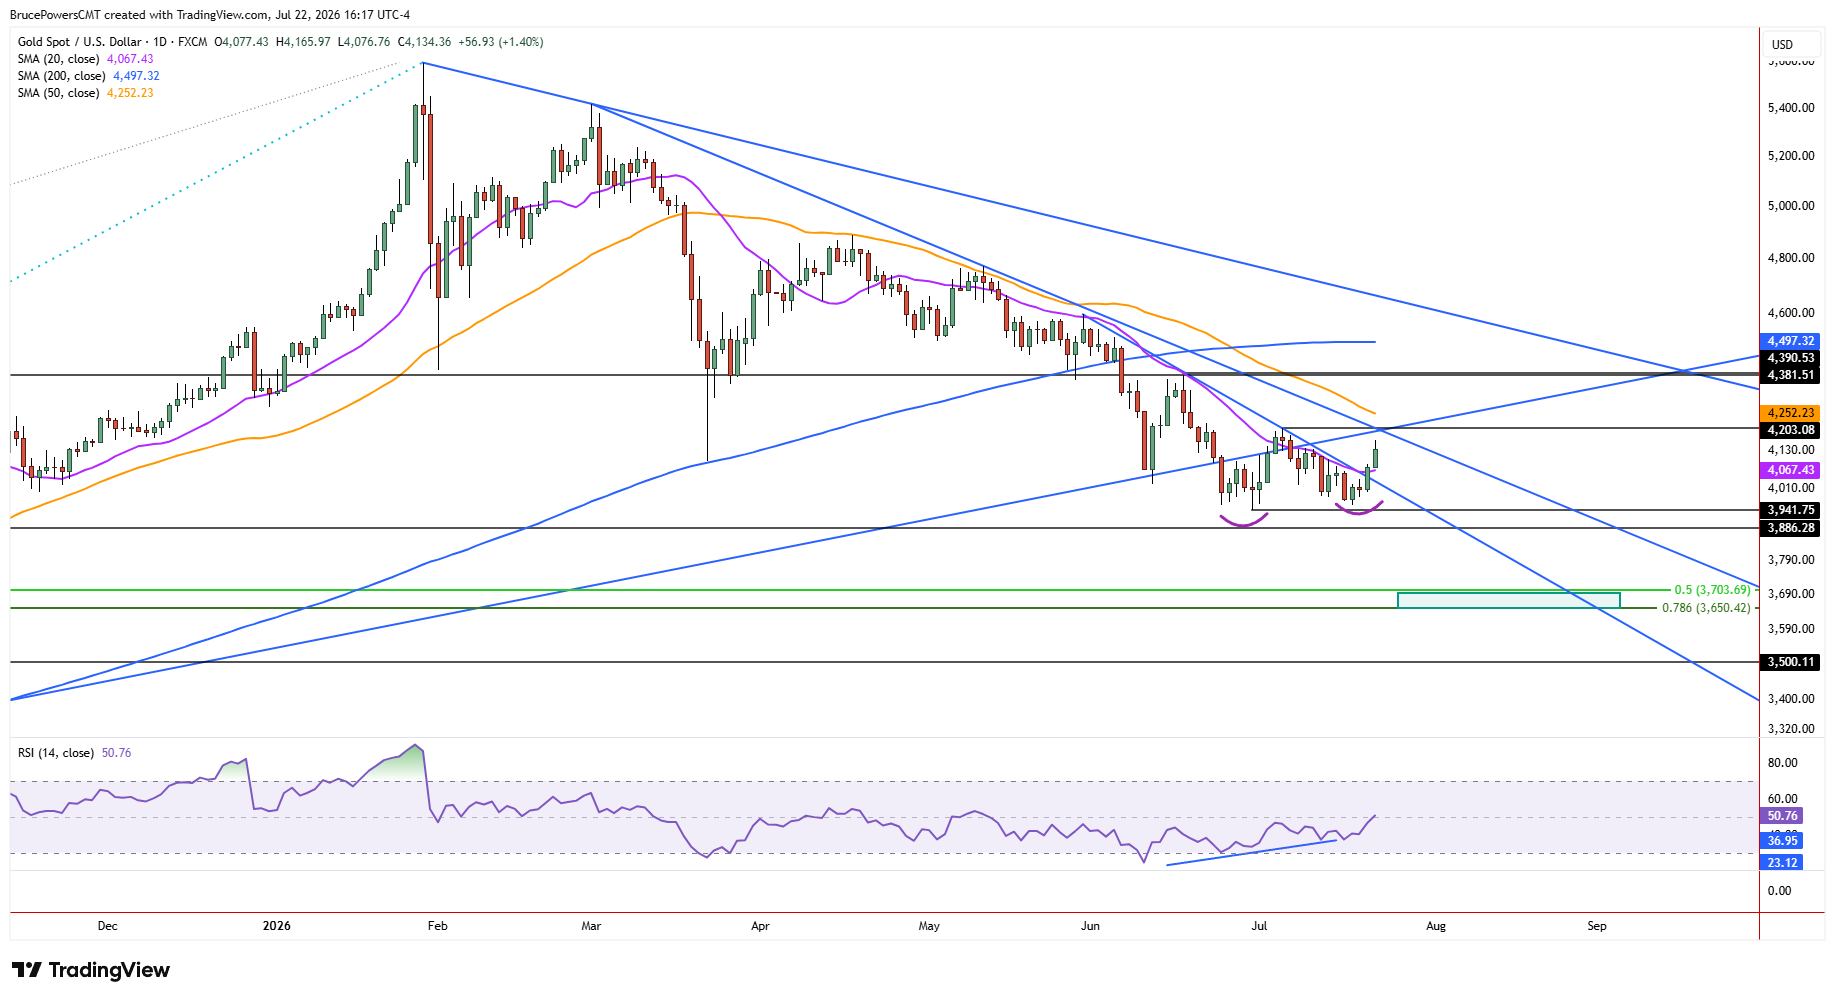
The $4,203 Test Could Change the Trend
Nonetheless, there are areas of potential resistance nearby, and gold needs to continue to show signs of strength to provide a clearer indication of where the strength seen in the past two sessions could lead. For gold to have a chance to continue to advance, it first needs to signal a trend reversal of the short-term downtrend by moving above the recent swing high at $4,203. That would also trigger a bullish double bottom pattern. However, a downtrend line and an uptrend line are showing potential resistance in a similar price zone, along with the falling 50-day moving average at $4,252,
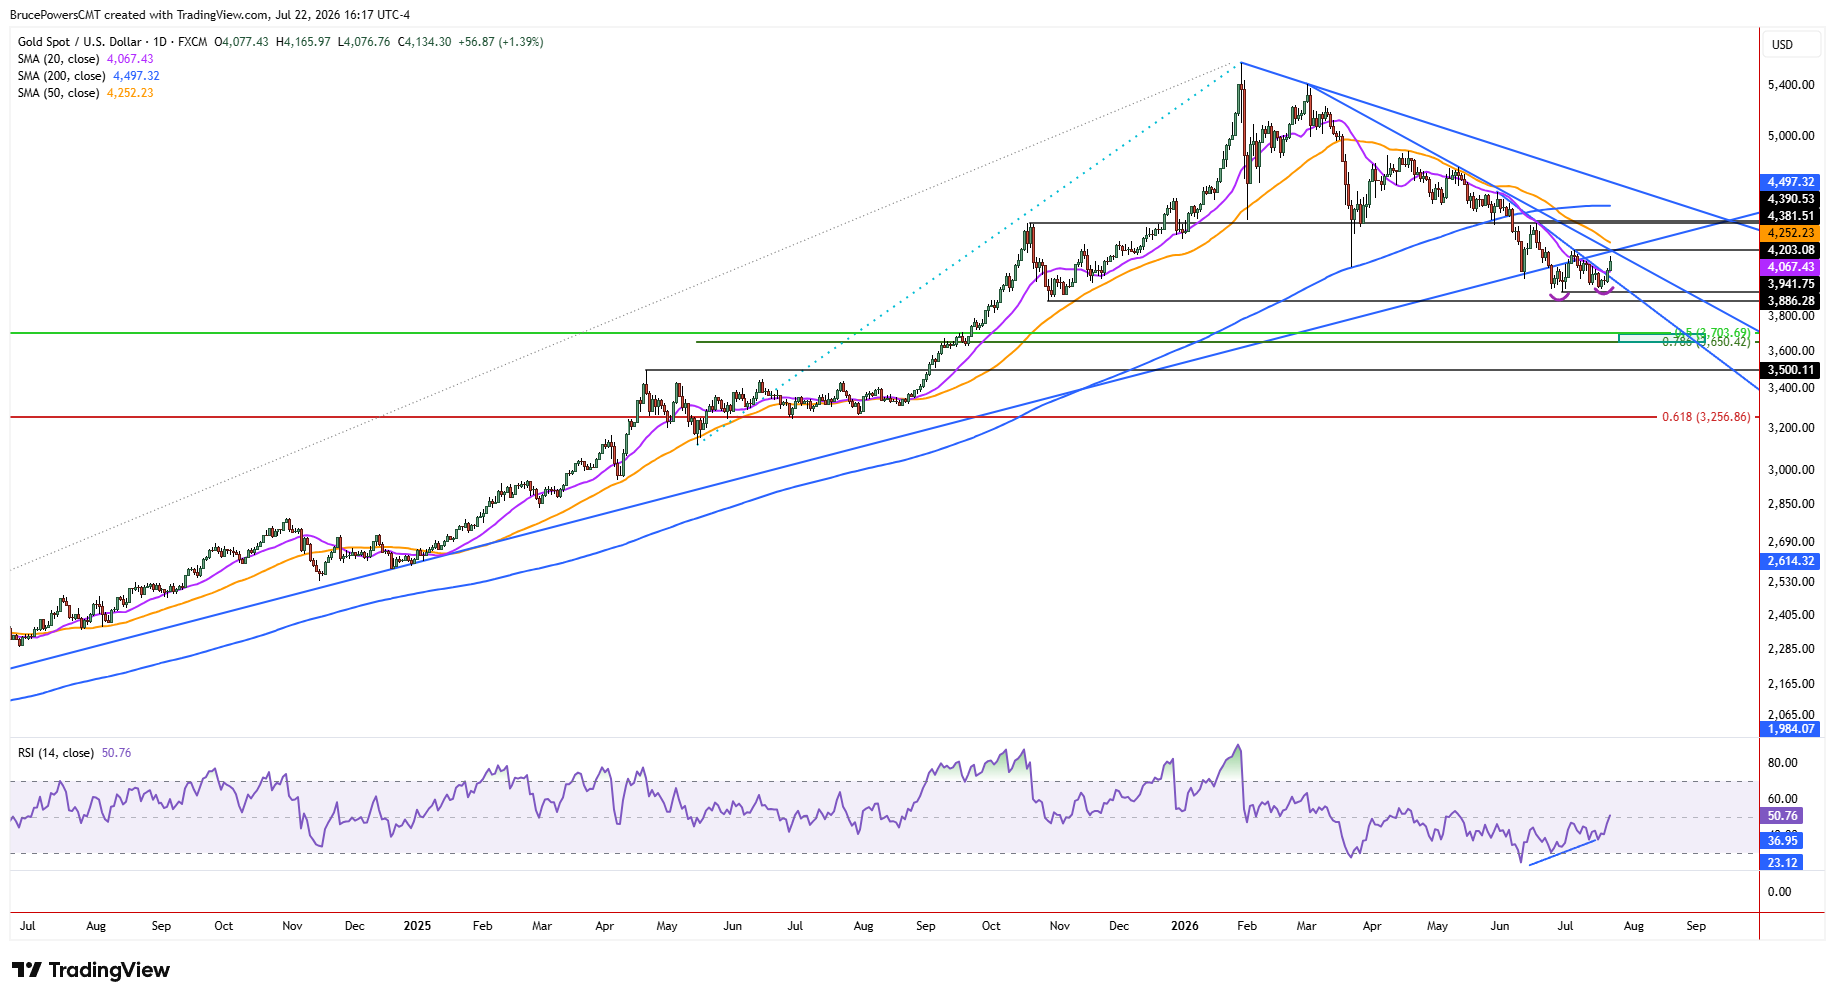
Resistance Converges Above the Market
Since the 50-day moving average is falling closer to the swing high, it represents a stronger resistance zone as the levels converge. This would also allow for a decisive breakout above $4,203 to reclaim the 50-day moving average on the same move. Gold would need to reclaim the 50-day moving average to show further signs of strength that could lead to higher prices. It has represented an area of dynamic resistance since gold broke below it in mid-March. Therefore, a sustained move above the $4,203 swing high and the 50-day moving average would provide a more convincing confirmation that the recent bullish momentum is extending beyond a short-term rebound.
Higher Targets Await a Confirmed Reversal
A higher initial upside target for gold lies near the prior trend high at $4,382, followed by the 200-day moving average near $4,497. The 200-day moving average was key dynamic support for the prior uptrend, and this first pullback to test it as support would typically be met with resistance, at least initially. That potential resistance makes the ability to reclaim the 50-day moving average even more important, as it would strengthen the case for gold to eventually challenge the higher targets.
If you’d like to know more about how to trade gold and silver, please visit our educational area.