Gold’s Best Week of the Year Came From the Rate Trade
Spot gold posted its strongest weekly gain since January after July payrolls contracted and the September rate-hike case fell apart. The rally was not about geopolitics or safe-haven flows. It was about Treasury yields dropping, the dollar weakening and the Fed losing its labor market argument for another tightening. That is the trade that sent gold from $4,019 to $4,371 in five sessions.
The market is pressing against the 52-week moving average at $4,349.82 early Monday and how traders handle that level sets the tone for the week. CPI lands Wednesday and PPI follows Thursday. Both reports can either confirm last week’s repricing or reverse it in a single session. Gold ran on the rate trade and the rate trade is not settled yet.
Spot gold closed the week at $4,341.94, up $296.77 or 7.34%. On Monday at 11:14 GMT, the metal was trading at $4,330.36, down $11.57 or 0.27%.

The Payroll Miss Did All the Heavy Lifting
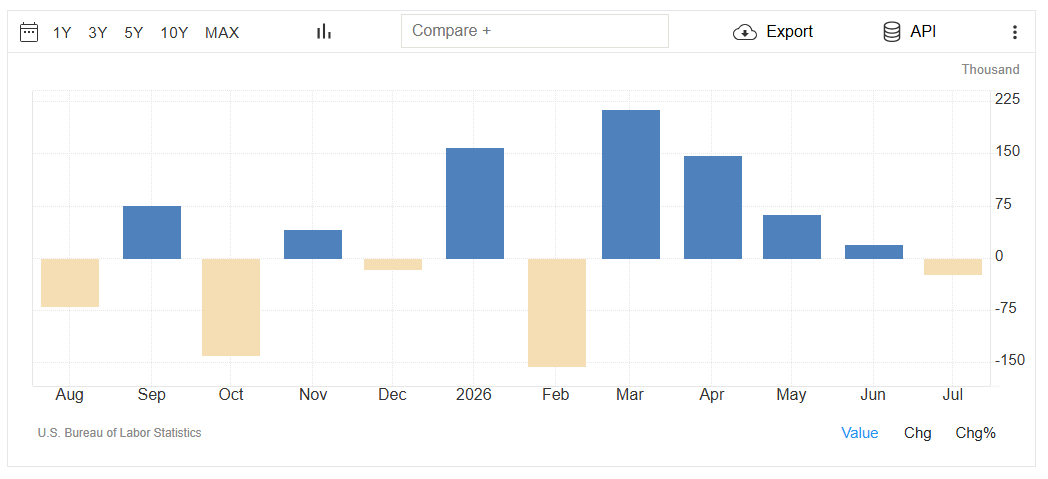
July payrolls fell by 23,000 when the Street expected a gain near 80,000. Prior months were revised lower. Wages came in at 3.2%, missing the 3.5% estimate. That combination pulled September hike probability from 67% a week ago down to about 44%. Treasury yields followed and the dollar gave back ground across the board.
Gold ran because the cost of holding it dropped. The weak labor data took pressure off the Fed and the market immediately repriced the rate path in gold’s favor. The rally accelerated Friday and carried through the close. The question now is whether Wednesday’s CPI lets that repricing stand.
Lower Oil Removed the Fed’s Inflation Excuse
Crude oil fell sharply last week on expectations of a Hormuz agreement and that gave gold a second tailwind. Lower oil pulled energy costs out of the inflation debate right when payrolls were pulling the labor argument out from under the hawks. Both legs of the rate-hike case weakened in the same week and gold priced it.
Gold Price Forecast
Every new Gold analysis as it publishes, today's technical signal and key levels, live price — on one page.
See all Gold forecastsThe risk is that oil is back above $79 Monday morning after Iran denied direct Hormuz negotiations over the weekend. If crude keeps climbing and rebuilds inflation expectations, that puts pressure back on the Fed and takes away part of the support that drove gold through $4,300. The Hormuz story is not gold’s story directly, but it runs straight through oil and inflation into the rate outlook that gold is trading.
CPI and PPI Will Decide Whether the Rally Extends or Corrects
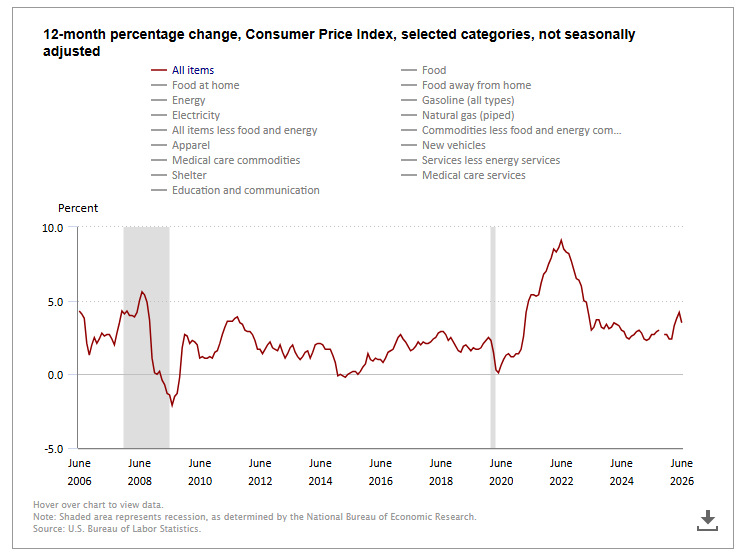
Headline CPI is expected at 3.4% year-over-year Wednesday. Core at 2.5%. PPI follows Thursday. Retail sales close the week Friday. Gold just rallied 7% on a single repricing of the rate outlook and now the inflation data tells the market whether that repricing was right.
A soft CPI print reinforces the idea that the Fed can hold in September. That keeps yields under pressure and gives gold room to push through the 52-week moving average and run toward the next resistance. A hot number brings hike odds back immediately, sends the dollar higher and puts last week’s entire rally under stress. Gold is not trading the geopolitical calendar this week. It is trading the inflation calendar.
Weekly Spot Gold (XAUUSD) Technical Analysis
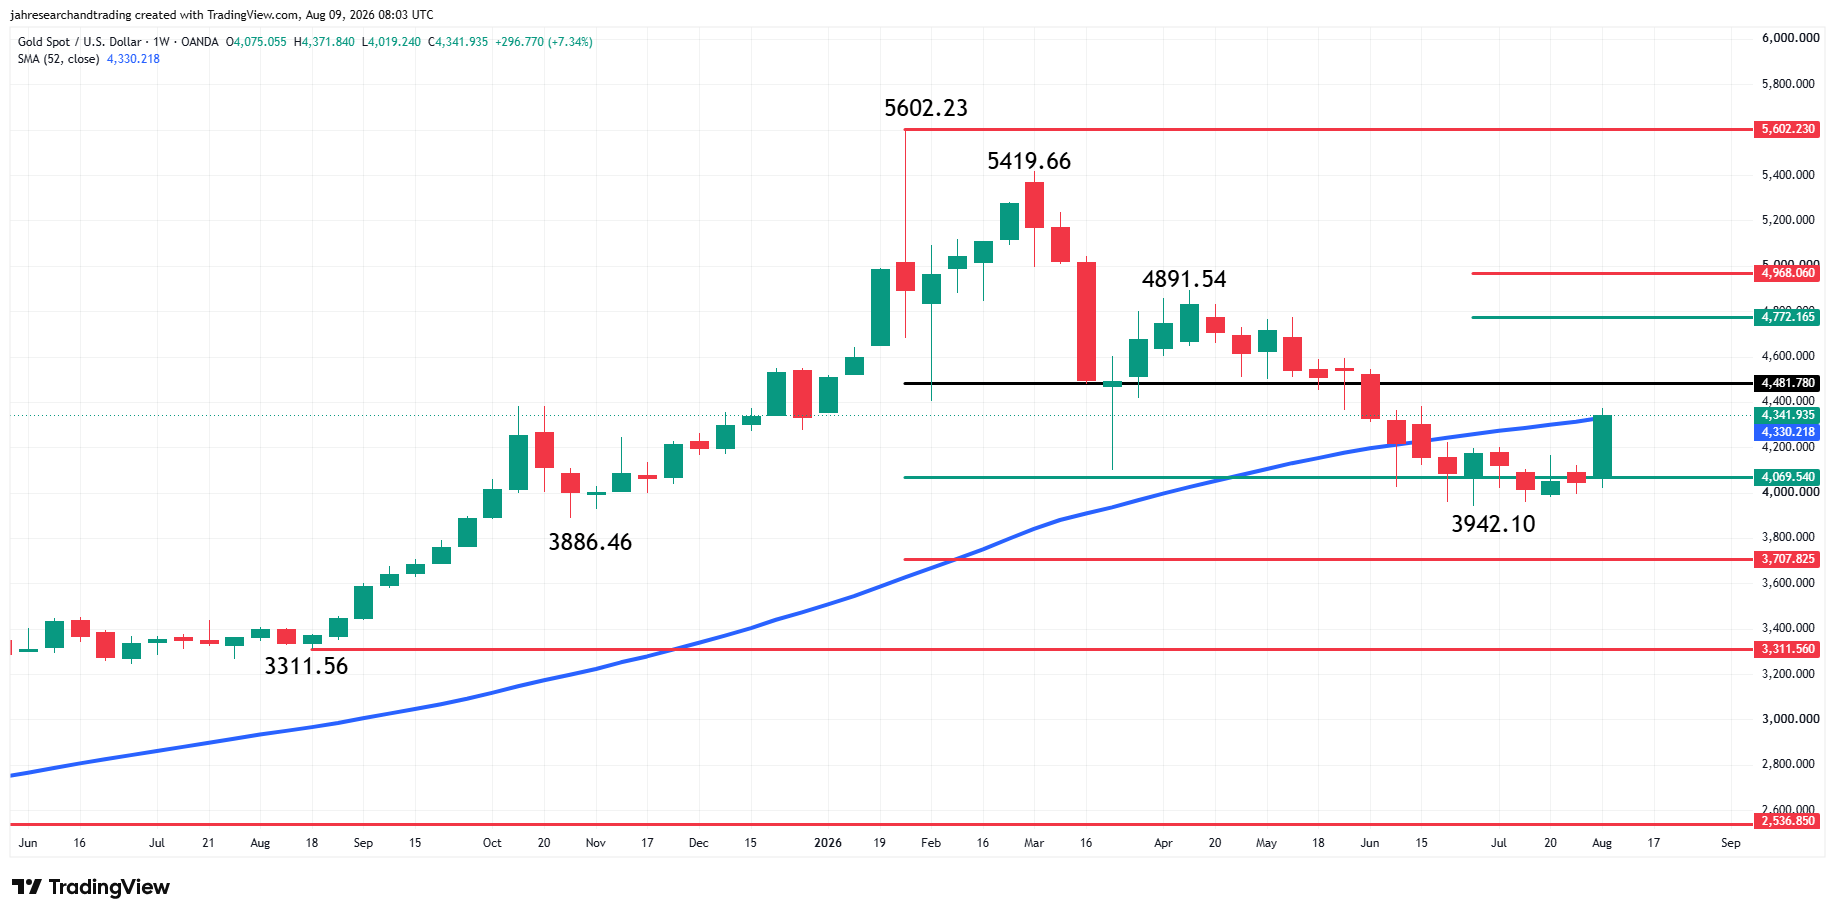
Spot Gold (XAUUSD) is edging lower early Monday after posting a strong rally last week. The market is currently testing the 52-week moving average at $4,349.82. Trader reaction to this indicator will likely set the tone for the week.
Last week’s rally was impressive and it may not have been a one-time event. A number of factors contributed to the rise, with the key being a solid support base across a long-term 50% level at $4,069.54. Additionally, it may have taken a while, but the base began building after a closing price reversal bottom at $3,942.10.
Traders will be watching the 52-week moving average this week because it can be both solid resistance or a potential trigger point for an acceleration to the upside.
If traders decide to sell into it, we could see a near-term pullback into the long-term 50% level at $4,069.54. Buyers could return on a pullback to this level, while defending against a breakdown under $3,942.10.
A breakout over the 52-week MA will indicate that the buying is getting stronger. The first target will be $4,481.78. This is an unusual target because it represents 20% down from the all-time high at $5,602.23. In other words, it’s the level that according to conventional analysis, turned the bull market into a bear market.
Overcoming $4,481.78 will indicate the buying is getting stronger. If this creates enough upside momentum then look for a surge into the retracement zone at $4,772.17 to $4,968.06. This is 50% to 61.8% of the break from $5,602.23 to $3,942.10.
Longer-term traders should keep an eye on the 52-week moving average this week.
Weekly Forecast
Last week’s rally ran on one trade. Payrolls contracted, hike odds dropped and gold repriced the rate path in five sessions. CPI Wednesday and PPI Thursday decide whether that repricing holds or gets walked back.
A soft pair of inflation reports and gold has the momentum to clear the 52-week moving average at $4,349.82 and target the bear market threshold at $4,481.78. A hot CPI sends yields and the dollar higher and pulls the bid out from under a metal that just gained 7% on one data point.
Oil back above $79 is the complication. If crude keeps climbing on stalled Hormuz talks, inflation expectations rebuild and the Fed’s case for September gets harder to dismiss. Gold needs lower oil, lower yields and inflation data that cooperates. It got the first two last week. This week it finds out about the third.
If you’d like to know more about how to trade gold, please visit our educational area.