


NASDAQ 100 Technical Analysis
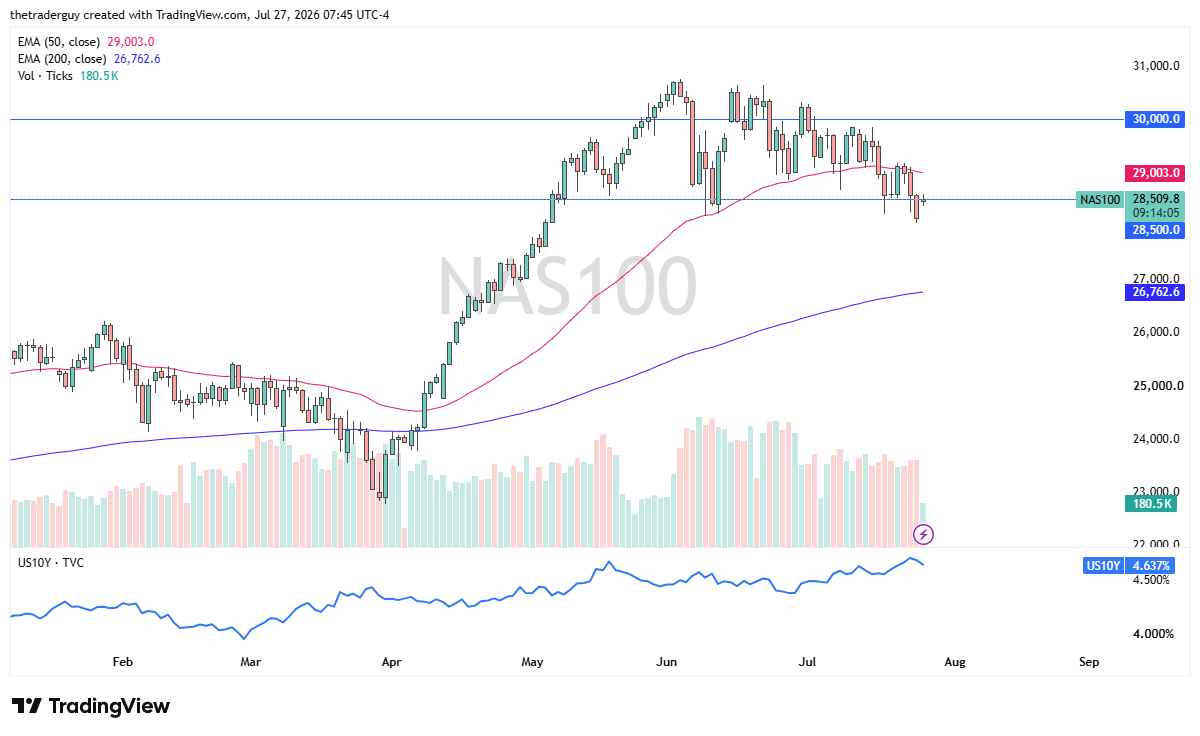
The Nasdaq 100 has gapped higher to kick off the trading session here on Monday as traders are excited about the idea that missiles are not flying in the United States-Iran conflict, but how long will that last? And the answer is probably not very. But as long as there is hope of a resolution to the conflict, there are buyers out there willing to get involved. The real question will be whether or not the Americans agree.
These overnight markets are a bit thin, so I’ll be watching the 50-day EMA at 29,000 to see if that offers resistance. Ultimately, we still have all of the same issues, just slightly lower interest rates.
Dow Jones 30 Technical Analysis
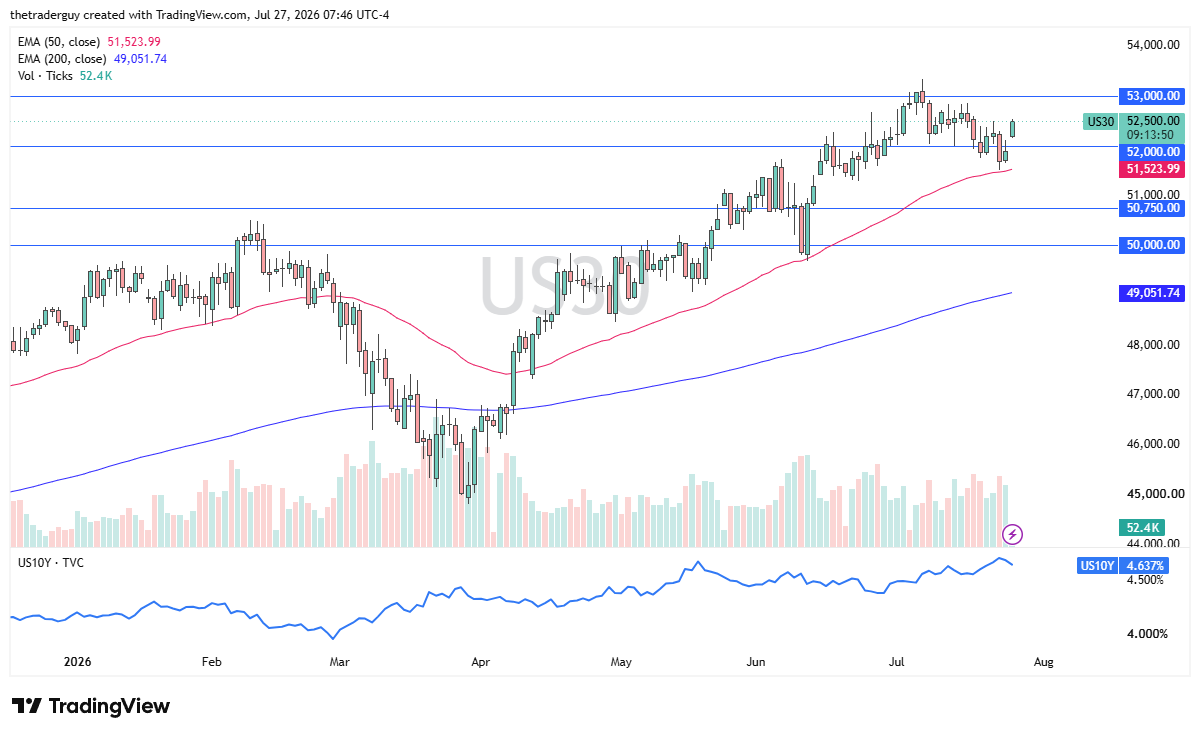
The Dow Jones 30 has taken off to the upside during trading in pre-market Monday, but it looks like it’s reaching an area right around 52,500 that’s been difficult previously. Breaking above there would be a strong sign. It could send the market looking to reach the 53,000 level, an area that previously had been resistant. The Dow Jones 30 could benefit from the resumption of global trade being open right away due to the fact of the size of the companies, and it is worth noting that it used the 50-day EMA as a trend line a couple of times. That being said, again, it has the same problem as the Nasdaq 100. It’s only a matter of time before the missiles fly again.
S&P 500 Technical Analysis
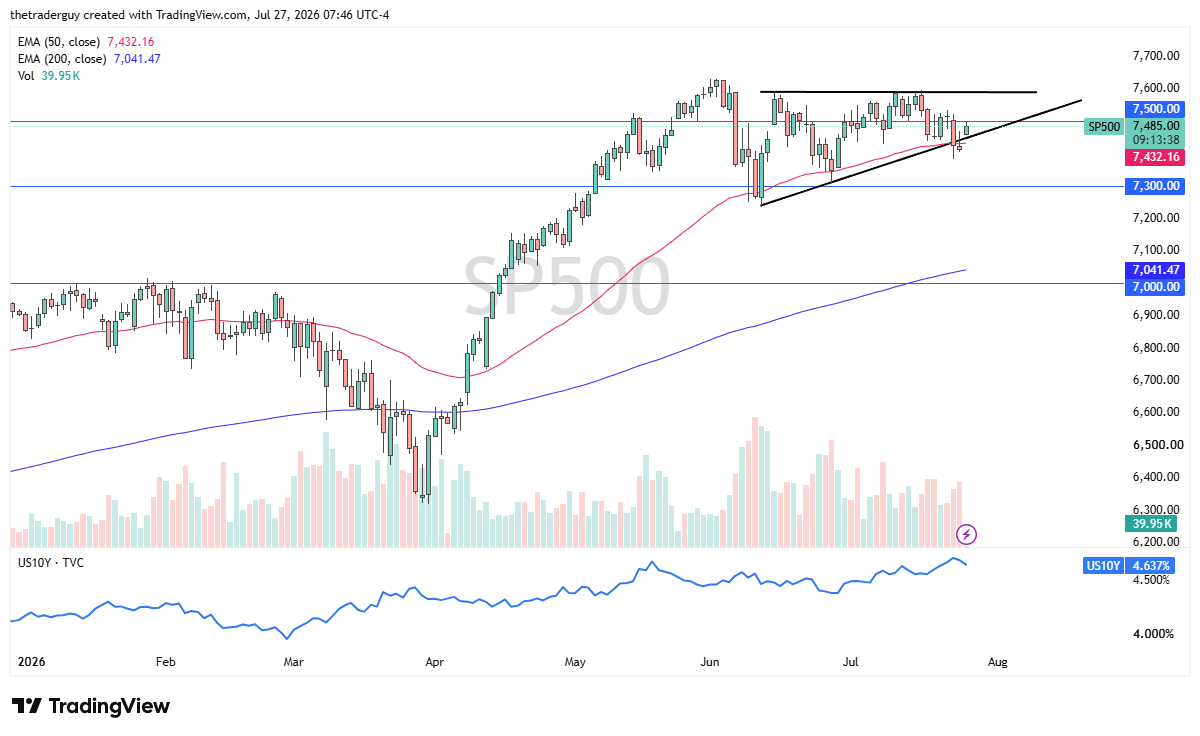
The S&P 500 has rallied a bit during the early part of the session after gapping higher. It tested the 7,500 level in pre-market trading but then pulled back a bit. Ultimately, this is a market that continues to see a lot of choppiness, and it is in the midst of trying to form a bit of an ascending triangle. We’ll have to see if that holds, but as we are in earnings season, that’s the other major catalyst for these indices. But the way we are acting, it seems like the war headlines are the biggest story because it’s moving the bond market. So, falling yields should help, but we’ll see how long this lasts.
If you’d like to know more about chart patterns and how to trade them, please visit our educational area.


