
Falling Crude Gives Growth Stocks a Bid
U.S. stock index futures are pointing toward a higher opening after crude oil broke sharply lower overnight. President Trump canceled a planned strike on Iran and said he expects negotiations to restart, and the oil drop pulled Treasury yields down with it. The 10-year fell toward 4.68%, the 30-year eased to about 5.23% after hitting its highest level since 2007 last week, and growth stocks caught the move before the bell.
Iran says there are no immediate plans for direct talks with Washington and claims the Hormuz discussions are with Oman only. The market is trading a diplomatic headline, not a deal. If that story reverses, crude bounces, yields turn higher and the bid gets tested.
Dow futures are up 333 points or 0.63%. S&P 500 futures are gaining 0.49% and Nasdaq-100 futures are ahead 0.53%.
Daily September E-mini Nasdaq-100 Index Futures Technical Analysis
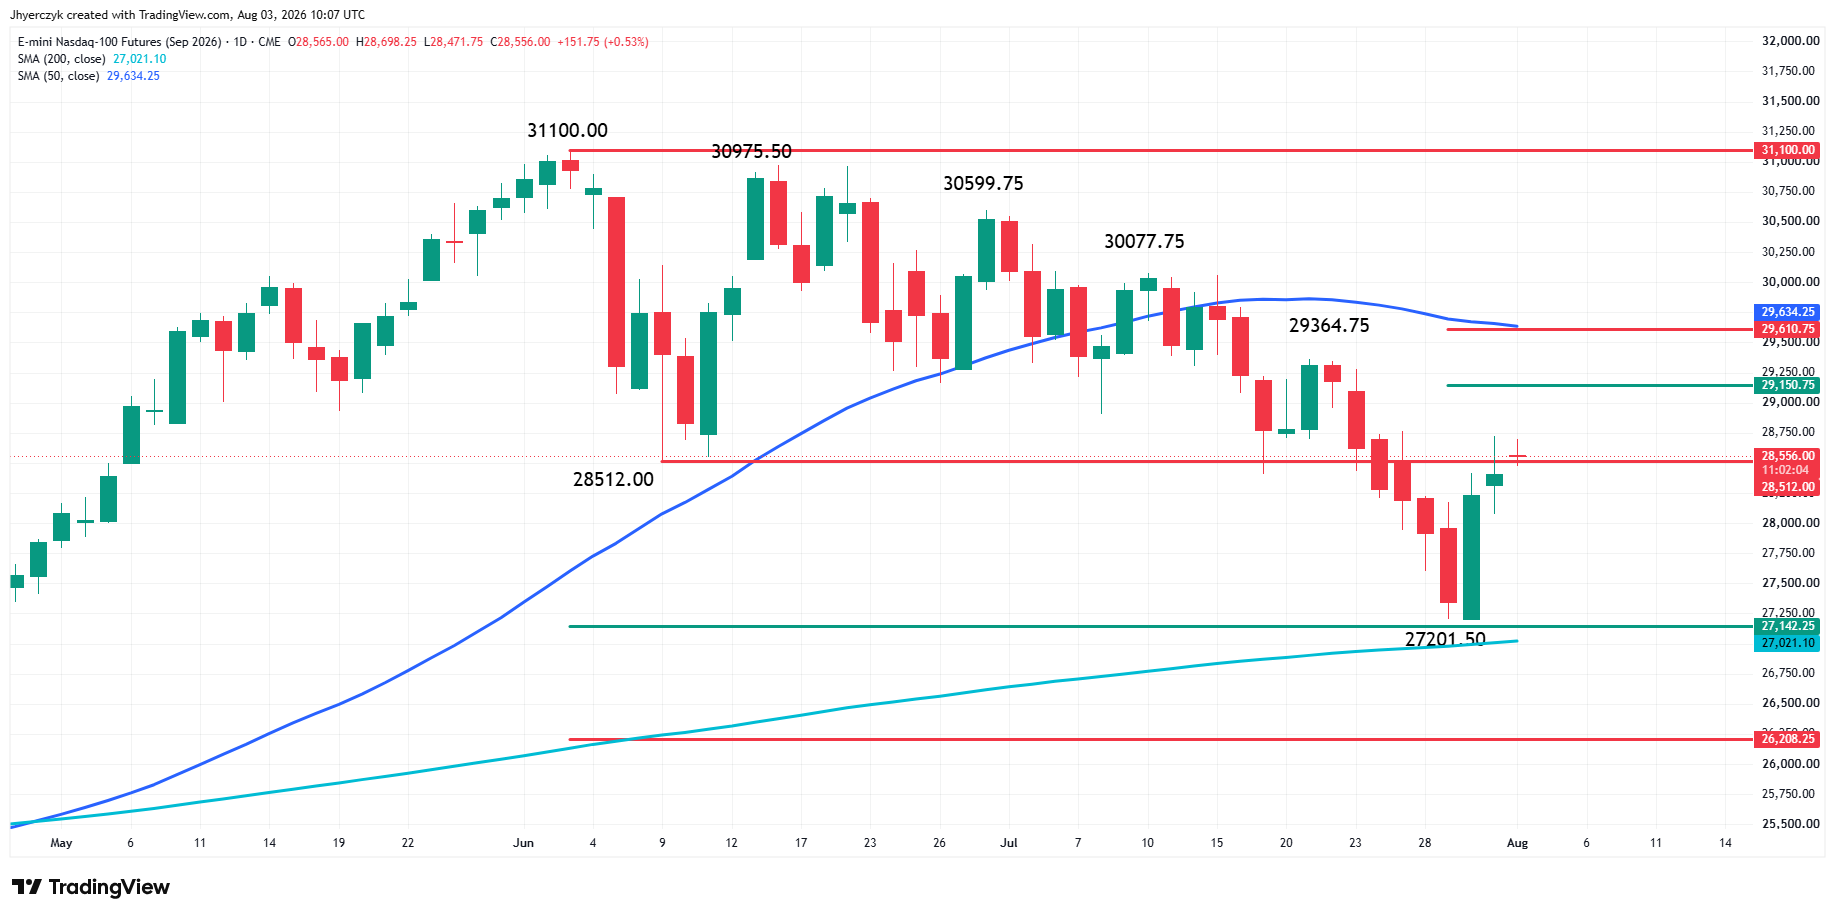
September E-mini Nasdaq-100 futures are trading higher early Monday. Although the market has recaptured a previous bottom at 28512.00, the rally has not been strong enough to overtake Friday’s high at 28725.75 to continue the current two-day rally.
An intraday breakout over 28725.75 could create the upside momentum needed to challenge the long-term retracement zone at 29150.75 to 29610.75, followed by the 50-day moving average at 29633.63.
Last week, the index traded down to 27201.50 before turning around. The new main bottom at 27201.50 is just above the long-term 50% level at 27142.25 and the 200-day moving average at 27021.02.
The first leg up from last week’s low at 27201.50 to Friday’s high at 28725.75, creates a retracement zone at 27963.50 to 27793.75. Should the rally weaken, this retracement zone would become a potential downside target.
NASDAQ 100 Price Forecast
Every new NASDAQ 100 analysis as it publishes, today's technical signal and key levels, live price — on one page.
See all NASDAQ 100 forecastsDaily September E-mini S&P 500 Index Futures Technical Analysis
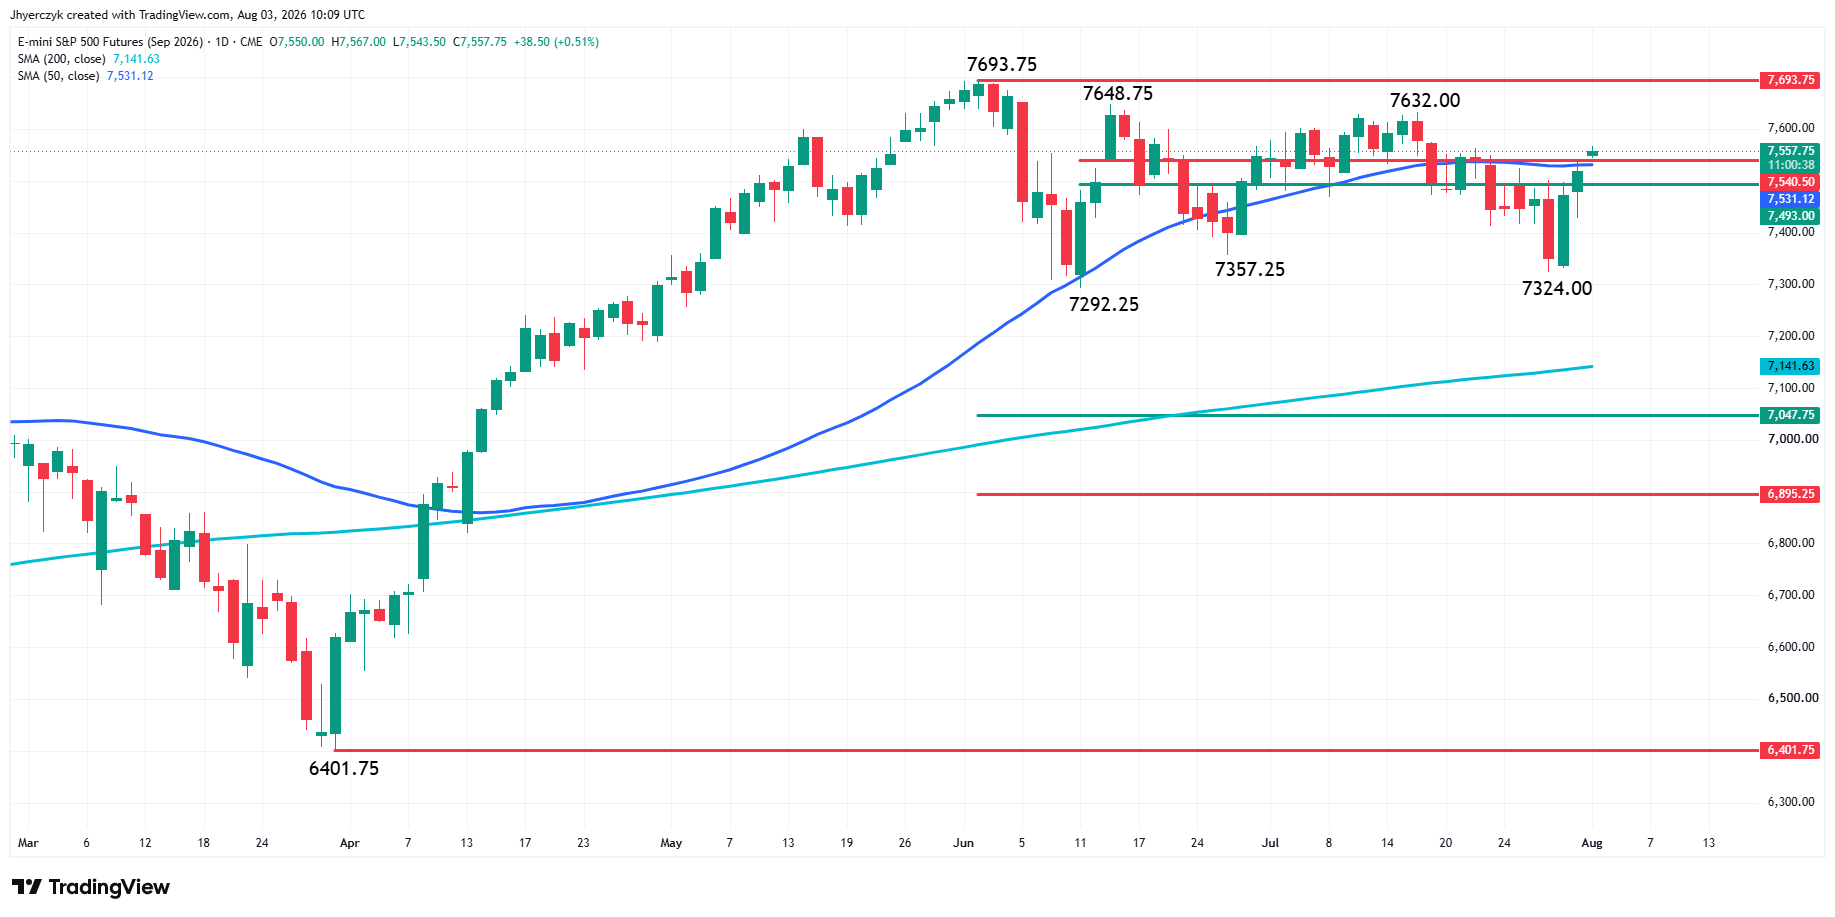
September E-mini S&P 500 Index futures are edging higher shortly before the cash market opening on Monday. The index is trading on the strong side of a short-term retracement zone at 7493.00 to 7540.50 and the 50-day moving average at 7531.10, giving it an upside bias. A sustained move over this support cluster will target a pair of tops at 7632.00 and 7648.75. These levels are the last potential resistance before the all-time high at 7693.75.
A sustained trade under 7493.00 will signal the return of sellers. This could trigger a 50% retracement of the current three-day rally.
Daily September E-mini Dow Jones Industrial Average Futures Technical Analysis
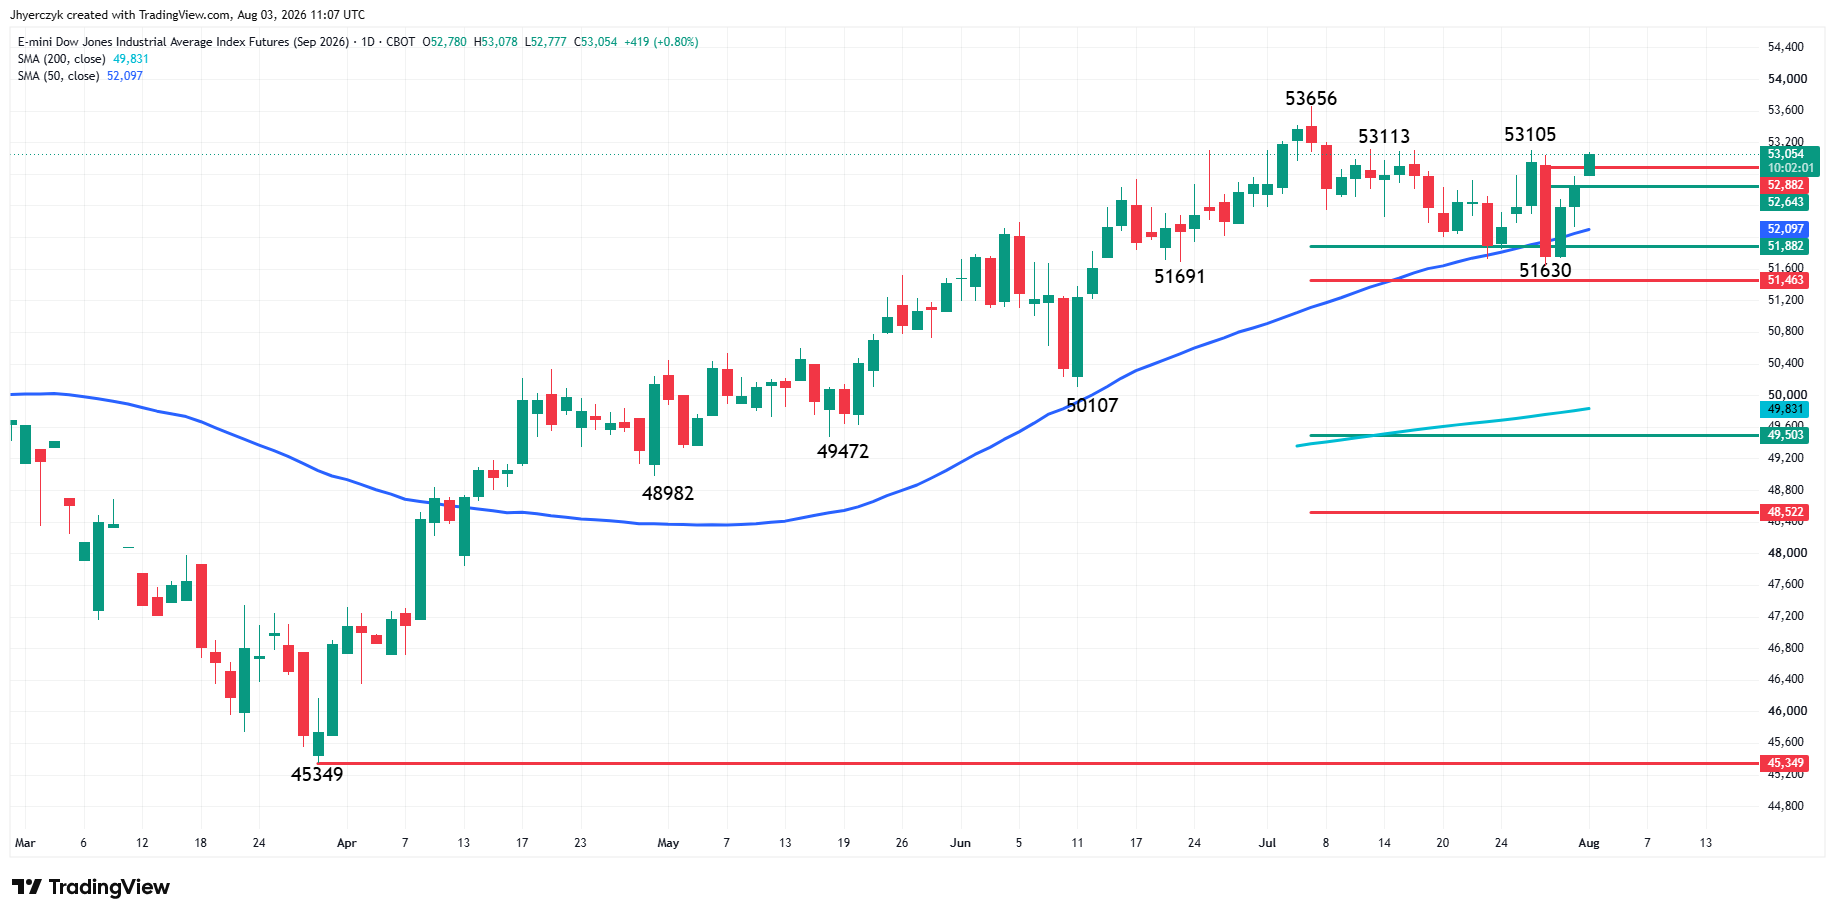
September E-mini Dow Jones Industrial Average futures are trading in a strong position early Monday. After hitting its lowest level since June 12 last Wednesday at 51630, the Dow has embarked on a three-day rally.
The new short-term range is 53656 to 51630. The Dow is currently trading on the strong side of its retracement zone at 52643 to 52882, making this area new support. If the move generates enough upside momentum then look for the rally to possibly extend into a pair of main tops at 53105 and 53113. These points are the last potential resistance before the 53636 all-time high.
Support is the 50-day moving average at 52096 and a retracement zone at 51882 to 51463.
Payrolls Will Decide Whether September Hike Risk Returns
Oil dropping this morning does not change the fact that three committee members voted for an immediate hike last week. Three officials voted for an immediate hike last week and falling crude for one session does not undo it. If oil bounces back or Friday’s payrolls print firm, they already have what they need to push for September. The front end eased after the hold but the long end has barely budged, and that is the bond market telling you Warsh still has an inflation credibility problem.
I think the real risk this week is Friday. ISM manufacturing at 14:00 GMT Monday sets the tone, but payrolls is where September gets decided. Consensus is 87,500 jobs after June’s weak 57,000, with unemployment expected to tick to 4.3%. Strong wages on that kind of rebound give the dissenters their argument and this morning’s relief fades fast. A miss keeps the pressure on yields and gives growth stocks room to extend.
Earnings Shift from Cloud to the Rest
Amazon and Microsoft already showed last week that the cloud money is turning into revenue. That part of the AI trade is answered. Palantir reports after Monday’s close and this is a different question. The hyperscalers proved the infrastructure spend is real. Palantir has to prove the software side can earn off of it. A strong number keeps the bid under the whole AI group. A soft guide is a problem because the stock has been priced for growth it has not delivered yet and sellers have been waiting for a reason.
AMD reports later this week along with McDonald’s, Kraft Heinz, Costco and Walt Disney. The calendar moves past the names that have been doing all the heavy lifting this summer and into the rest of the market. That is where you find out if this rally has legs beyond a handful of stocks.
What to Watch
The oil drop opened the door this morning but the Iran story is a headline, not a deal, and crude comes right back if talks collapse. The Fed’s 9-3 split means the September trade can reassemble on one firm data point, and payrolls Friday is the number that either extends the relief or ends it. Strong wages on a solid headline push the rate premium back and put yields right where they were last week. A miss keeps yields falling and gives growth stocks more room, but only if crude stays down with it.
All three indexes are trading above short-term support after last week’s selloff. The Dow and S&P 500 are within range of their all-time highs and the Nasdaq-100 has reclaimed a previous bottom but has not cleared Friday’s high yet. Buyers need to build on this morning’s bid or the three-day rally stalls ahead of the biggest employment report of the summer.
More Information in our Economic Calendar.