
Futures Slide After Iran Strikes Lift Oil
U.S. stock futures are lower Monday morning with crude oil sharply higher after the U.S. confirmed strikes on Iran’s Larak Island in the Strait of Hormuz over the weekend. Iranian state media said Tehran retaliated with attacks on U.S. bases in Jordan. This is the first publicly acknowledged U.S. strike on Iranian positions since late July.
On the opening, Dow Jones Industrial Average futures are down 111 points, or 0.21%, at 53,473. S&P 500 Index futures are off 22.25 points, or 0.29%, at 7,699.75. Nasdaq-100 Index futures have lost 76.00 points, or 0.26%, at 29,415.75.
Energy stocks have the bid. The rest of the market is leaning lower with 10-year Treasury yields at their highest since January 2025 and Friday’s August employment report still ahead.

Daily September E-mini S&P 500 Index Futures Technical Analysis
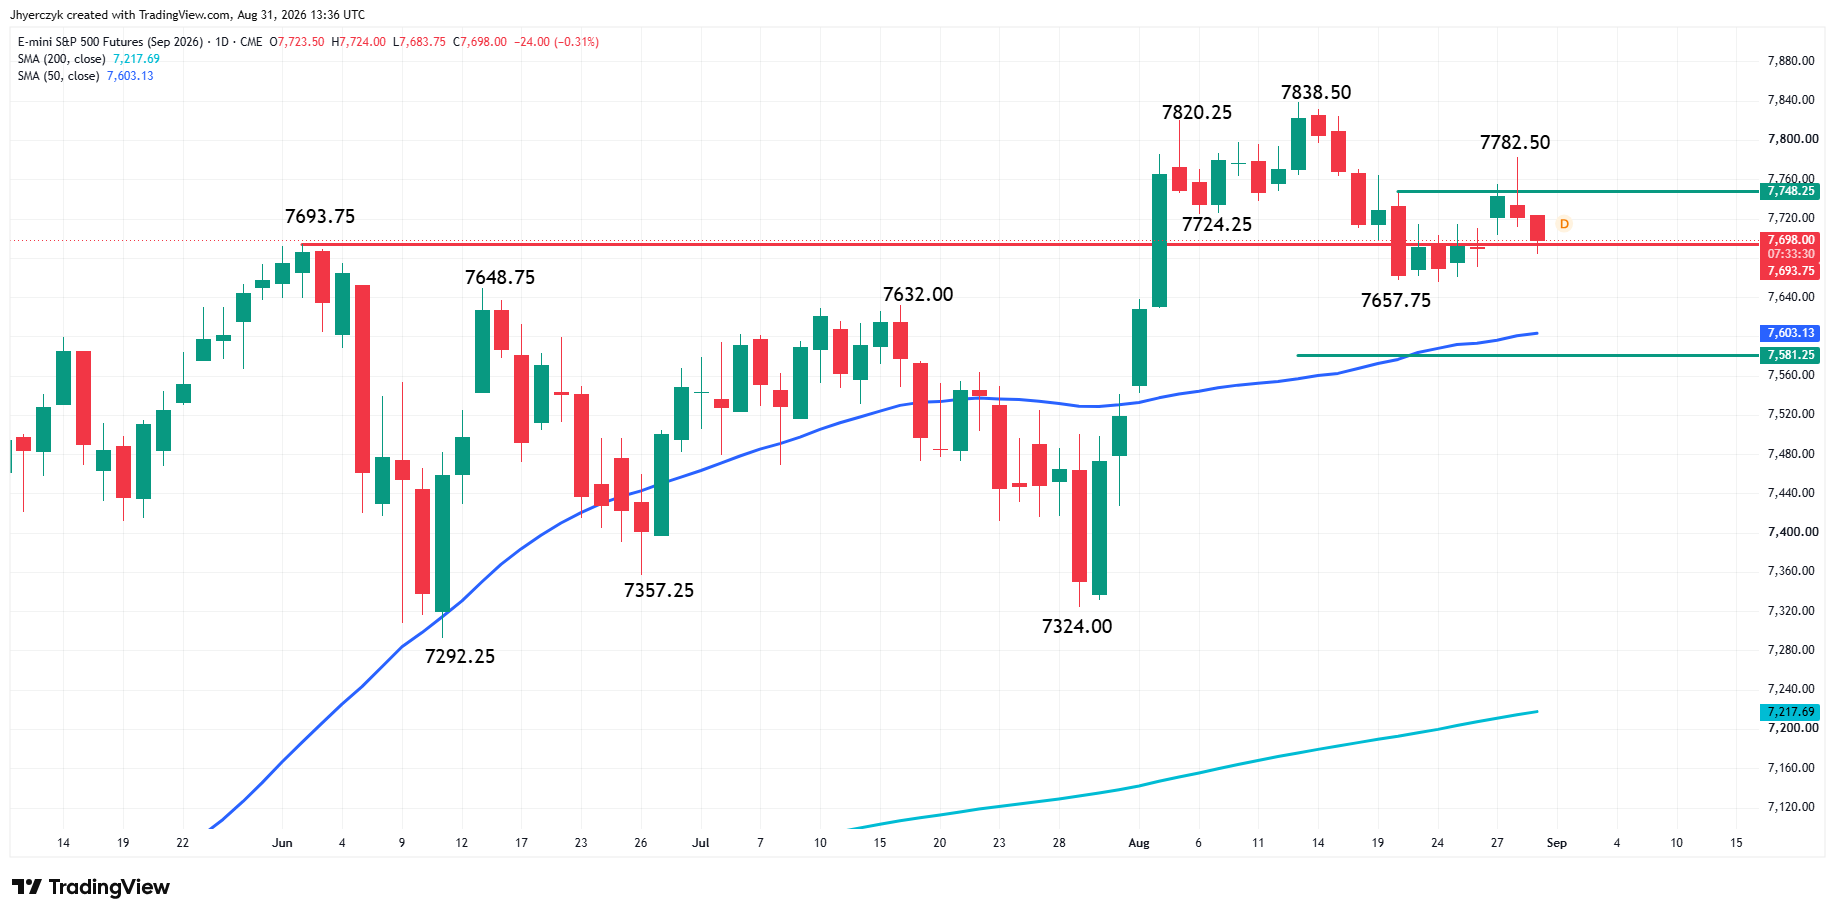
September E-mini S&P 500 Index futures are currently trading just above the former record high at 7,693.75. Holding above this level would suggest traders are trying to turn the old top into a new bottom. Additional support is the main bottom at 7,657.75.
A trade through 7,657.75 will reaffirm the downtrend, which began on August 18 when sellers took out 7,724.25. The new secondary lower top is 7,782.50. A trade through this level will change the trend back to up.
Under the 7,657.75 main bottom, the next support levels are the 50-day moving average at 7,603.14 and an intermediate 50% level at 7,581.25.
Daily September E-mini Nasdaq-100 Index Futures Technical Analysis
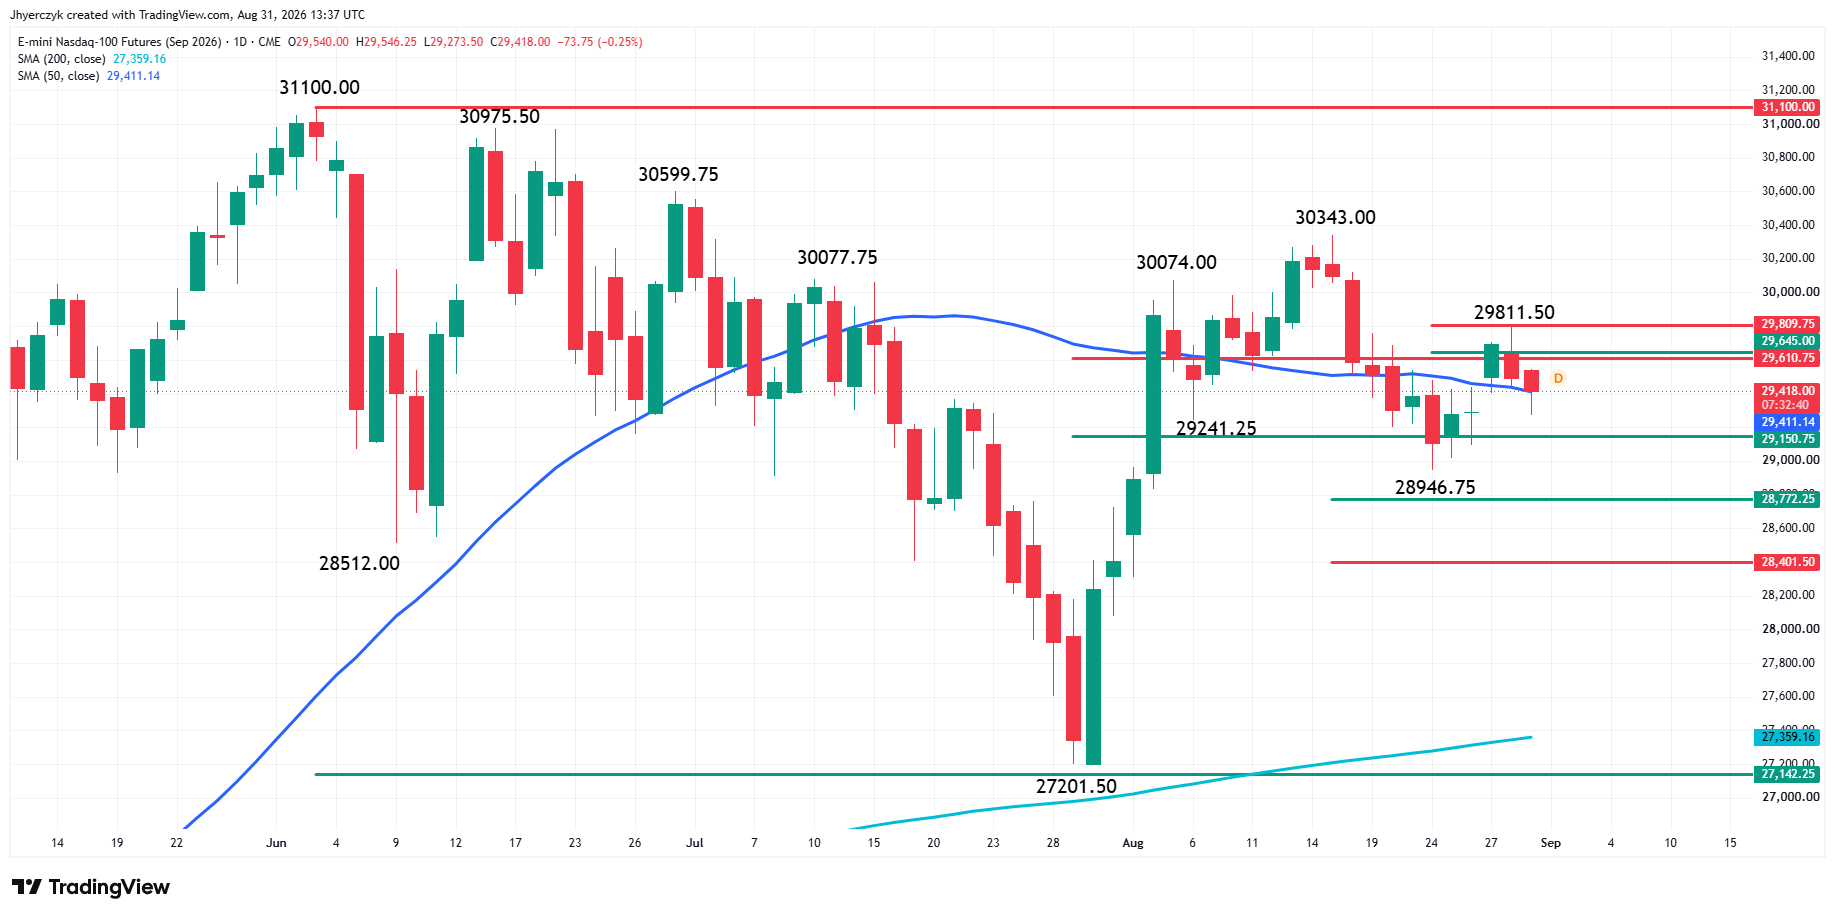
September E-mini Nasdaq-100 Index futures are sharply lower at the cash market opening. The index is currently straddling the 50-day moving average at 29,411.40. Trader reaction to this indicator could set the tone for the week.
NASDAQ 100 Price Forecast
Every new NASDAQ 100 analysis as it publishes, today's technical signal and key levels, live price — on one page.
See all NASDAQ 100 forecastsA sustained move over the 50-day moving average will indicate the presence of buyers. This could lead to a labored rally into potential resistance at 29,610.75, 29,645.00, 29,809.75 and the minor swing top at 29,811.50.
A sustained move under the 50-day moving average will signal the presence of sellers. This move could extend into an intermediate 50% level at 29,150.75, followed by the main bottom at 28,946.75.
Larak Island Put War Premium Back in Oil
Larak Island sits in the Strait of Hormuz. That is not just another Iran headline. WTI crude is trading above $86 per barrel Monday morning, up more than 3%. Brent is above $91, also up more than 3%. Last week crude lost more than 4% as traders pulled war premium out of the market. Monday morning they are putting it back.
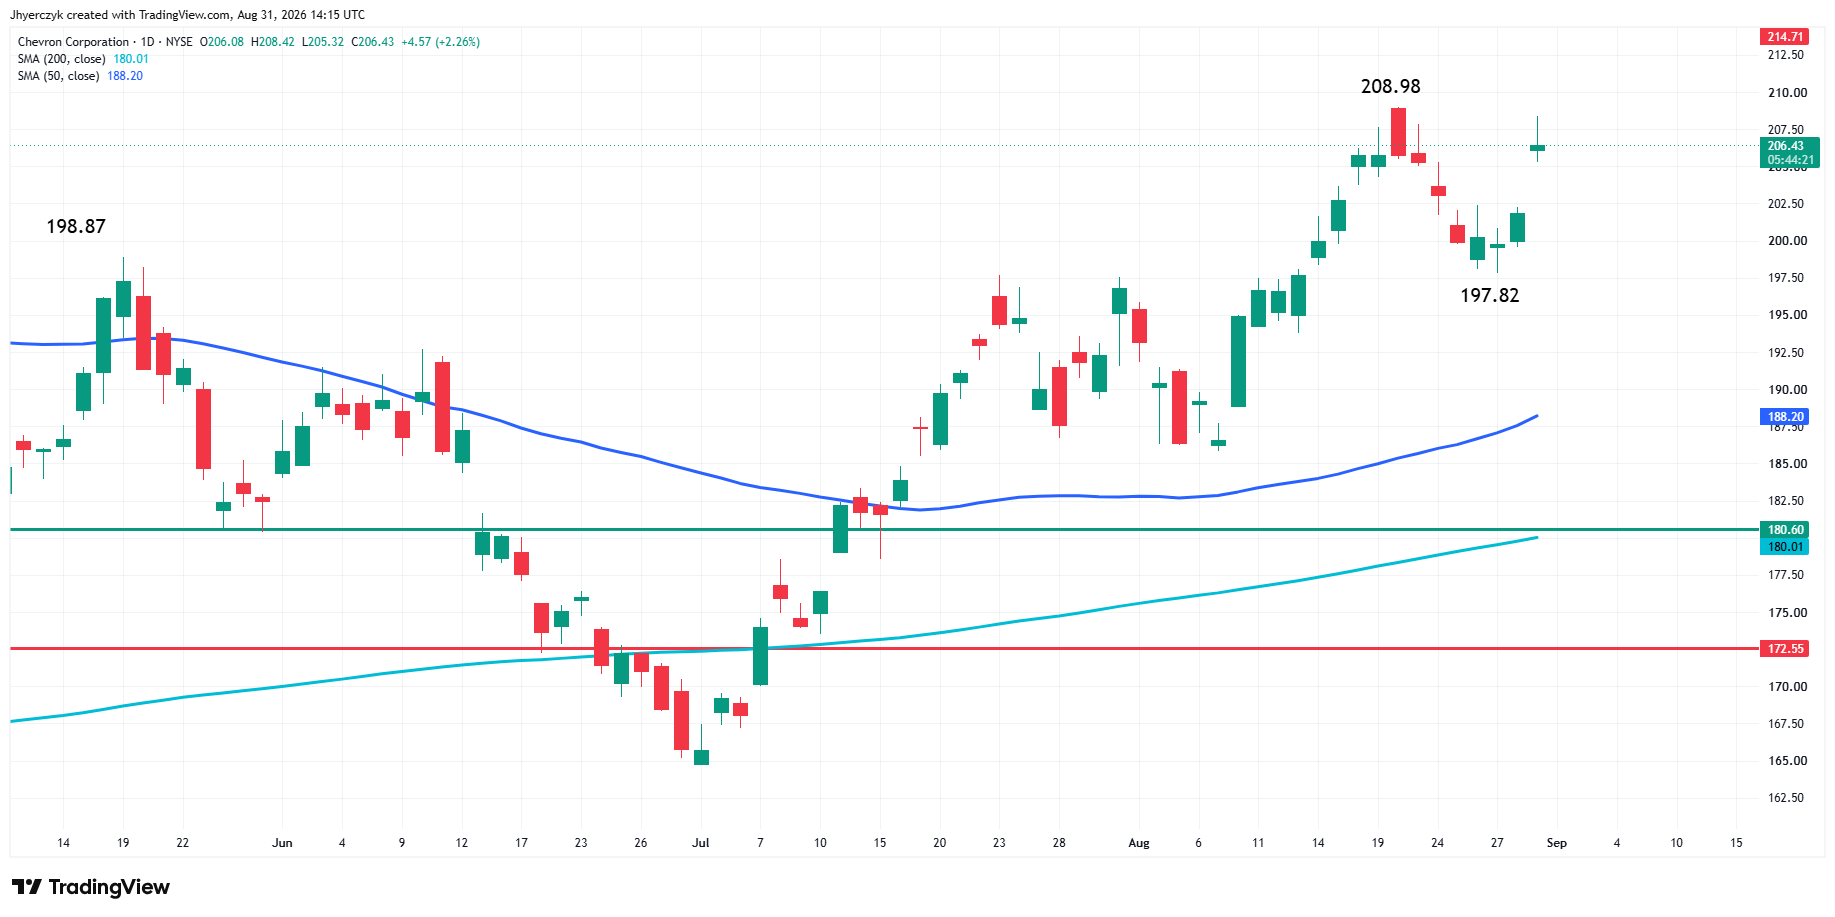
Halliburton is up more than 2.5% in premarket. Chevron has added 2%. Valero and Occidental Petroleum are both higher by about 2%. Exxon Mobil has gained more than 1.5%. The buying is across the group and Chevron is giving the Dow direct exposure to the move. The energy strength is not pulling the broad indices with it. The selling elsewhere is a separate trade.
Yields Are Running and Warsh Is Not Helping
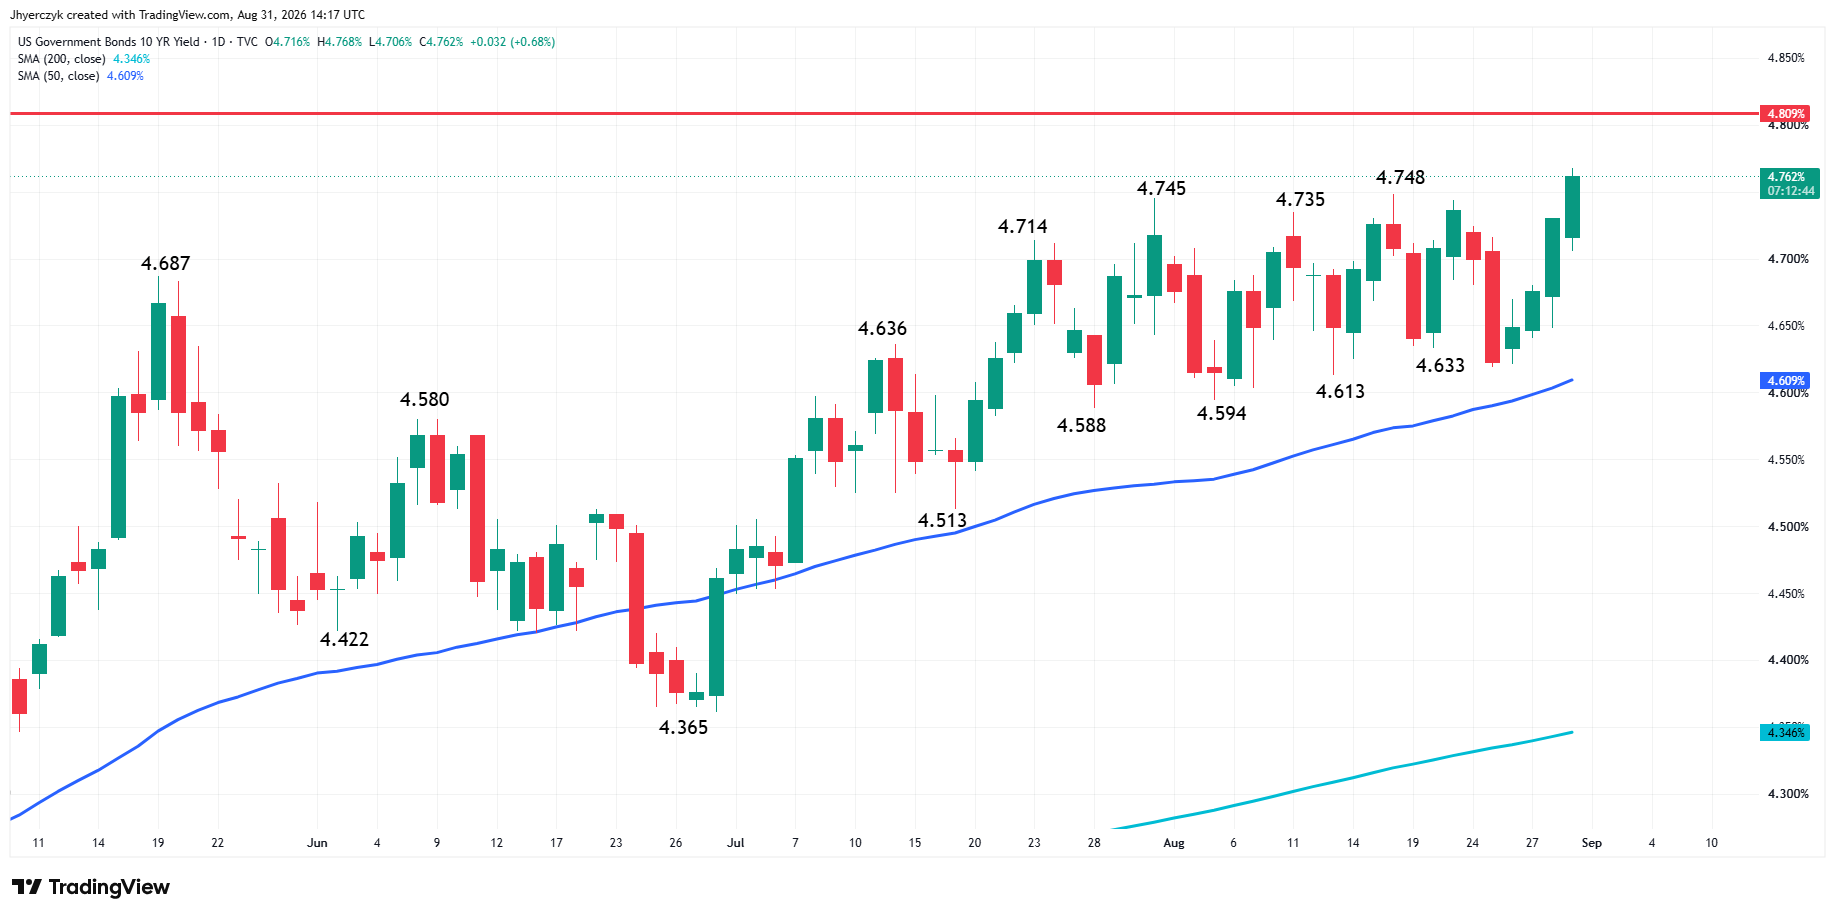
The 10-year Treasury yield rose more than 3 basis points to 4.754%, the highest since January 2025. The 30-year gained more than 4 basis points to 5.255%. The 2-year was little changed near 4.34%. The long end is doing the damage again.
The Treasury Department tried earlier this month to calm the bond market with larger debt repurchases. That did not last. Warsh was not helping Friday. He said better summer inflation readings did not prove the underlying trend had improved. Barclays economist Jonathan Millar called a September rate increase more likely than not after the speech. The firm also expects a December hike.
The futures selling comes after a strong August. The Dow is up 2.1% for the month, on track for a fifth straight monthly gain. The S&P 500 is up about 3%. The Nasdaq Composite is higher by roughly 4%. Both the Dow and S&P 500 hit record highs earlier in August. The S&P 500 technology sector gained nearly 6% in the month. Nvidia added more than 8%. Microsoft rose 10%. Micron climbed 13%.
Asia did not help Monday. Japan’s Nikkei 225 slipped 0.14% and Australia’s S&P/ASX 200 fell 0.18%. South Korea’s Kospi gained 0.46% after reversing an earlier loss. Mainland China’s CSI 300 rose 0.35% and Hong Kong finished flat. Europe was mixed with energy shares higher on crude. U.K. markets are closed for a public holiday.
Stocks in the News
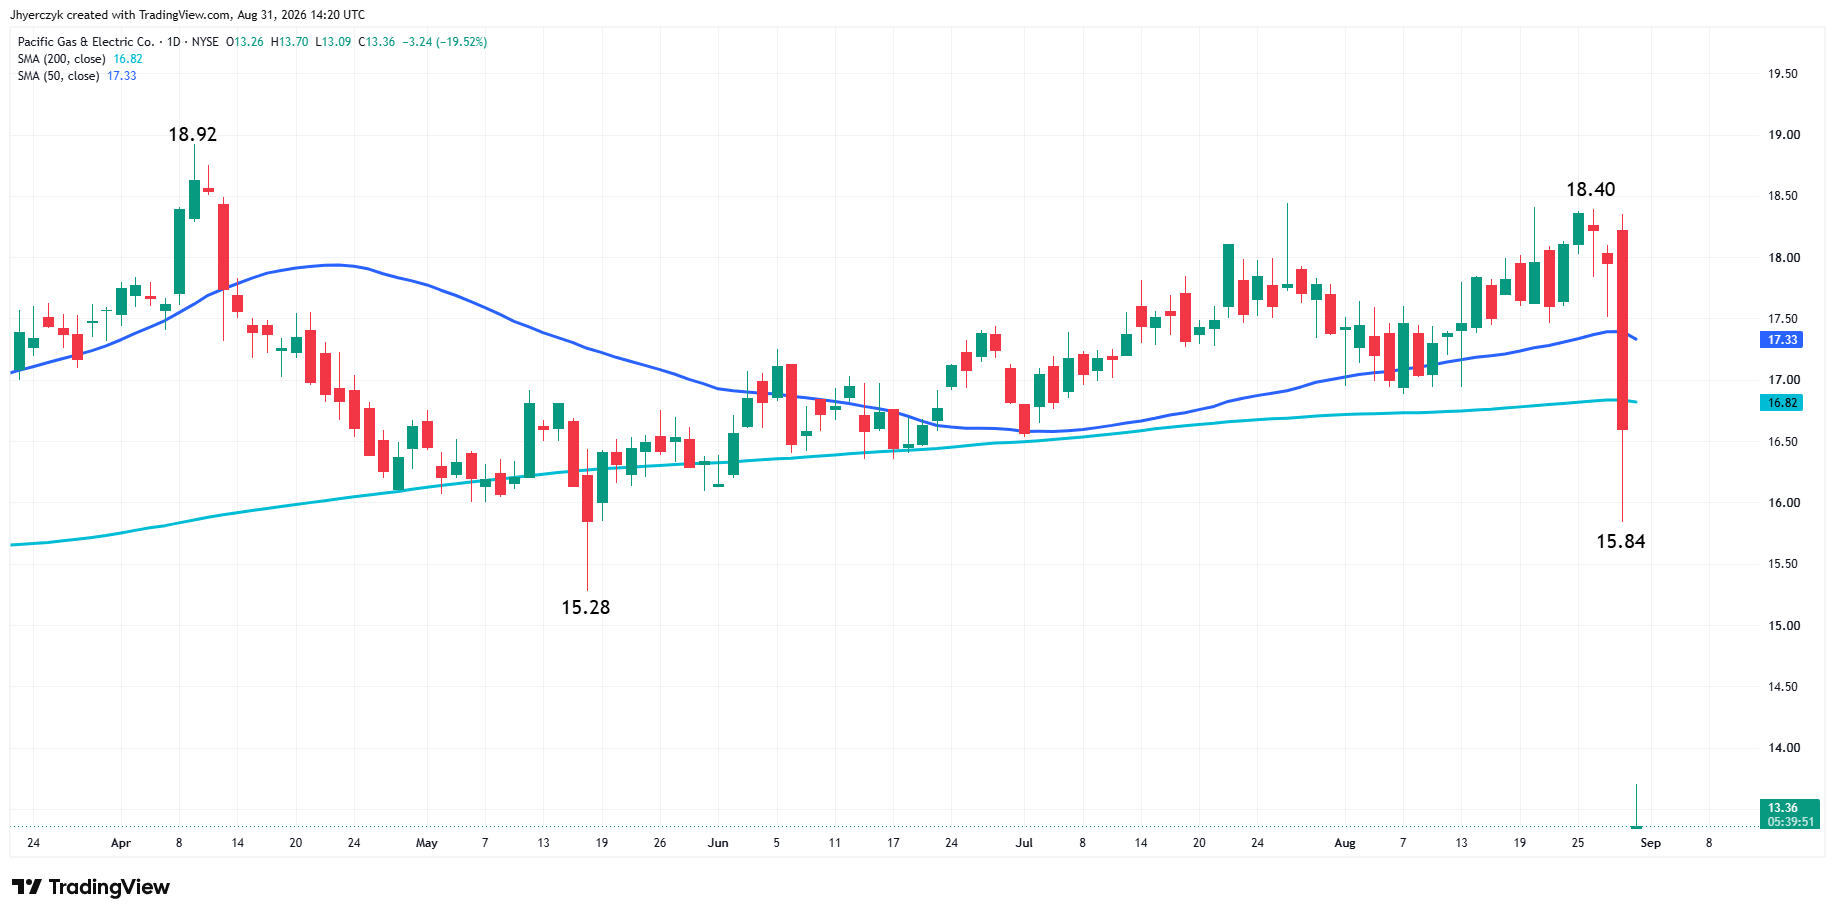
PG&E dropped 16% after California lawmakers blocked a proposal to limit wildfire-liability damages against utilities. Pinterest fell more than 3% after disclosing that Chief Financial Officer Julia Brau Donnelly will leave at the end of October. Aon lost 1.8% on a $17 billion deal to buy USI Insurance Services from KKR.
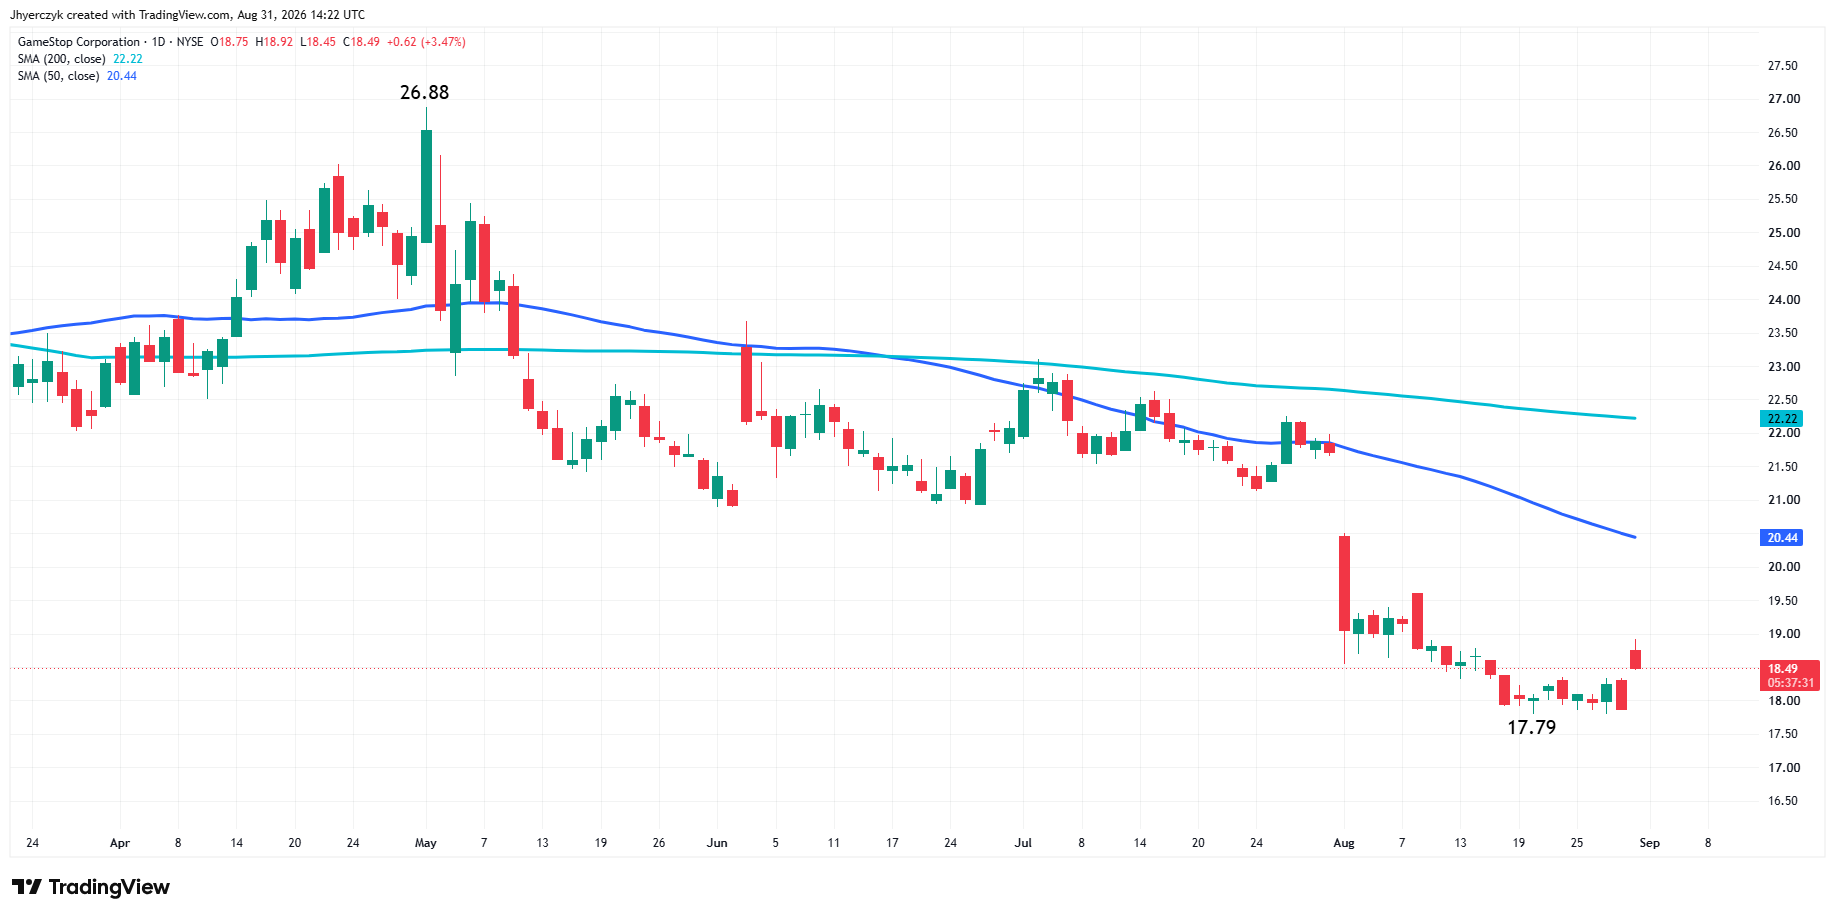
GameStop gained 4% after preliminary second-quarter results showed higher operating income despite lower sales. Deere added 1% after Baird upgraded the stock on expectations for stronger farm-equipment demand.
What to Watch
The jobs report Friday is the next number that can move the rate picture. Until then, the Middle East sets the oil price and the long end of the curve keeps repricing. Warsh and Barclays are both pointing toward September. The market does not need them to be right for higher oil and higher yields to keep pressure on the indices Monday.
The S&P 500 is sitting just above the former record high at 7,693.75 with the main bottom at 7,657.75 underneath. The Nasdaq-100 is straddling its 50-day moving average at 29,411.40. Monday’s close on both levels tells the story for the rest of the week.
More Information in our Economic Calendar.