


NASDAQ 100 Technical Analysis
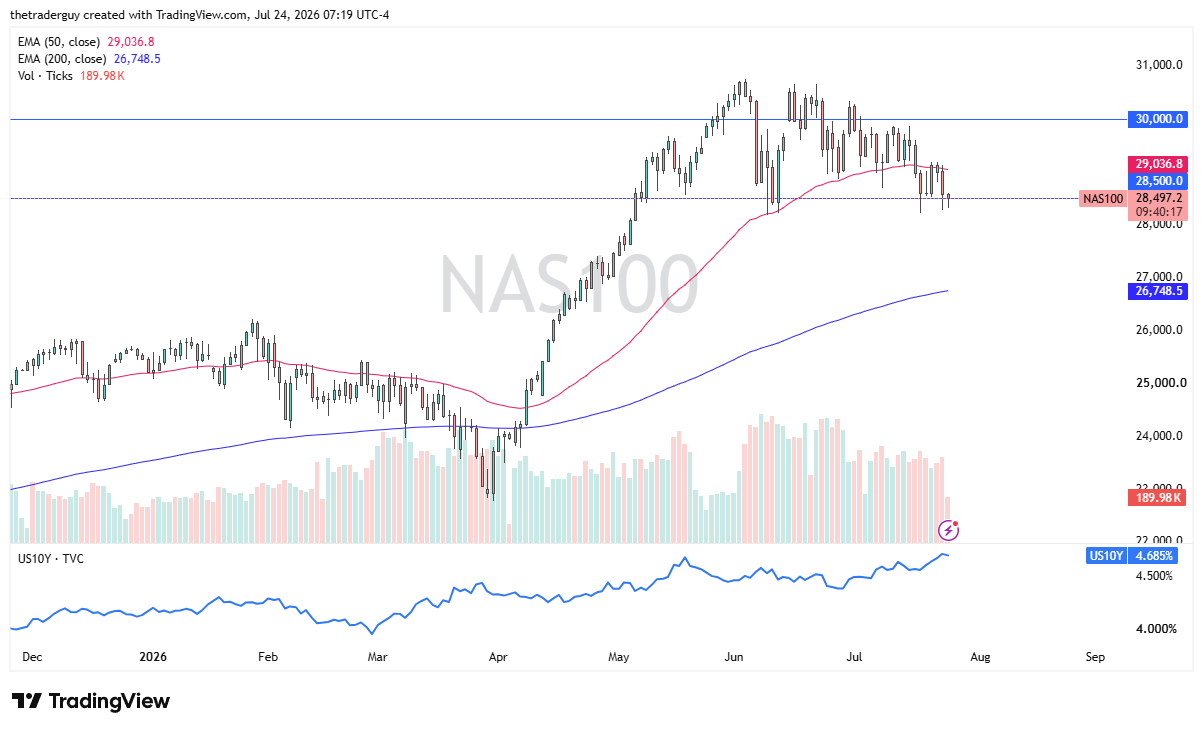
The Nasdaq 100 broke lower during the trading session here on Friday to kick things off, piercing the crucial 28,500 support level, but has since seen a little bit of buying and a little bit of an attempt at supportive measures. So, the question today will be whether or not falling yields could give a little bit of a lift to the Nasdaq 100. It is typically sensitive to higher yields, so it does make a certain amount of sense that they are occurring at the same time: yields dropping, Nasdaq 100 trying to turn things around. We are in the midst of earnings season, so that will have its influence as well, but we are definitely in an area that has been important recently.

Dow Jones 30 Technical Analysis
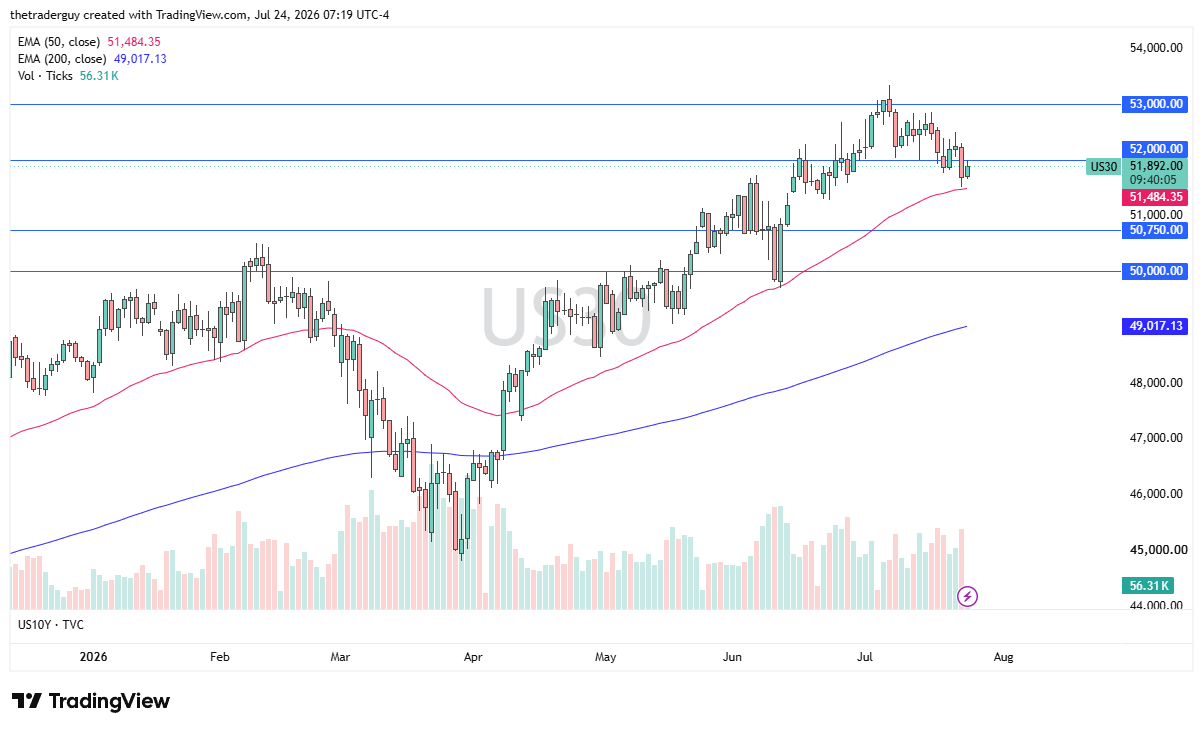
The Dow Jones 30 is actually positive, and it reached towards the 52,000 level early during the trading session on Friday in pre-market trading. If it can break above the 52,000 level, that would be a bullish sign and could continue the overall uptrend we’re seeing — a nice 45-degree channel. Bouncing from the 50-day EMA during the session on Thursday also helps give this a positive and bullish look. So ultimately, this is a market that seems like there is still plenty of support in.
S&P 500 Technical Analysis
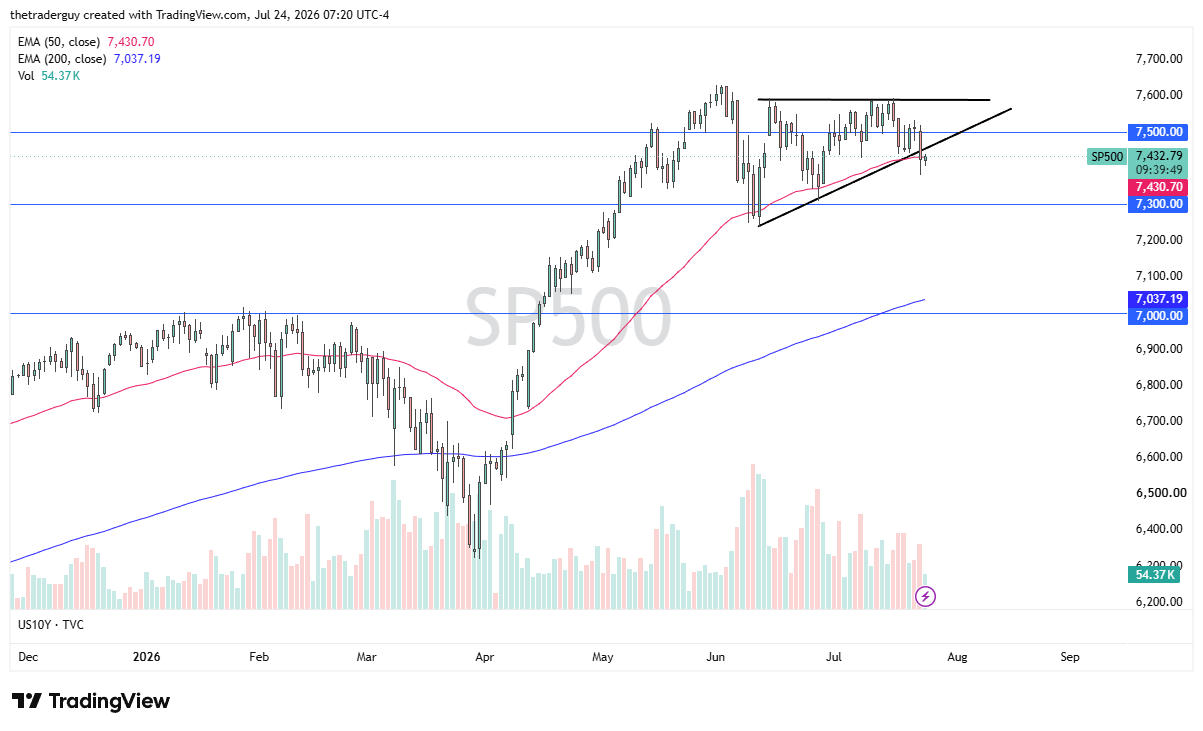
The S&P 500 pierced the bottom of the ascending triangle that we had been working on during the Thursday session. So far on Friday, it’s been very quiet as we hang around the 50-day EMA. Typically speaking, these indices all move in the same general direction, so while the S&P 500 might be a little bit of a laggard, positive sentiment in the other two indices could help drag this thing higher. As things stand right now, the triangle has been pierced. The question is: will it hold? We are right on the precipice of finding out.
If you’d like to know more about chart patterns and how to trade them, please visit our educational area.


