Chips and Earnings Drive Futures Higher
Semiconductor buyers are pushing futures higher Tuesday as the chip group bounces hard after last week’s selling and the early names are running with conviction before the bell. That bid is arriving alongside strong earnings from 3M and General Motors, giving the Dow a reason to follow. Oil is pulling back from Monday’s advance on reports of a 10-day ceasefire proposal between the United States and Iran, taking some rate pressure off growth stocks. Gold and silver are both higher as the diplomatic shift reopens the rate debate.
At 11:34 GMT, Nasdaq-100 Index futures are trading 29138.50, up 359.75 or +1.25%. S&P 500 Index futures are at 7516.75, up 32.50 or +0.43%. Dow futures are at 52232.00, up 159.00 or +0.31%.
The Nasdaq has the strongest bid because chips are doing the work, the Dow is higher on two early beats from 3M and GM, and the S&P 500 is riding both.

Daily September E-mini S&P 500 Index Futures
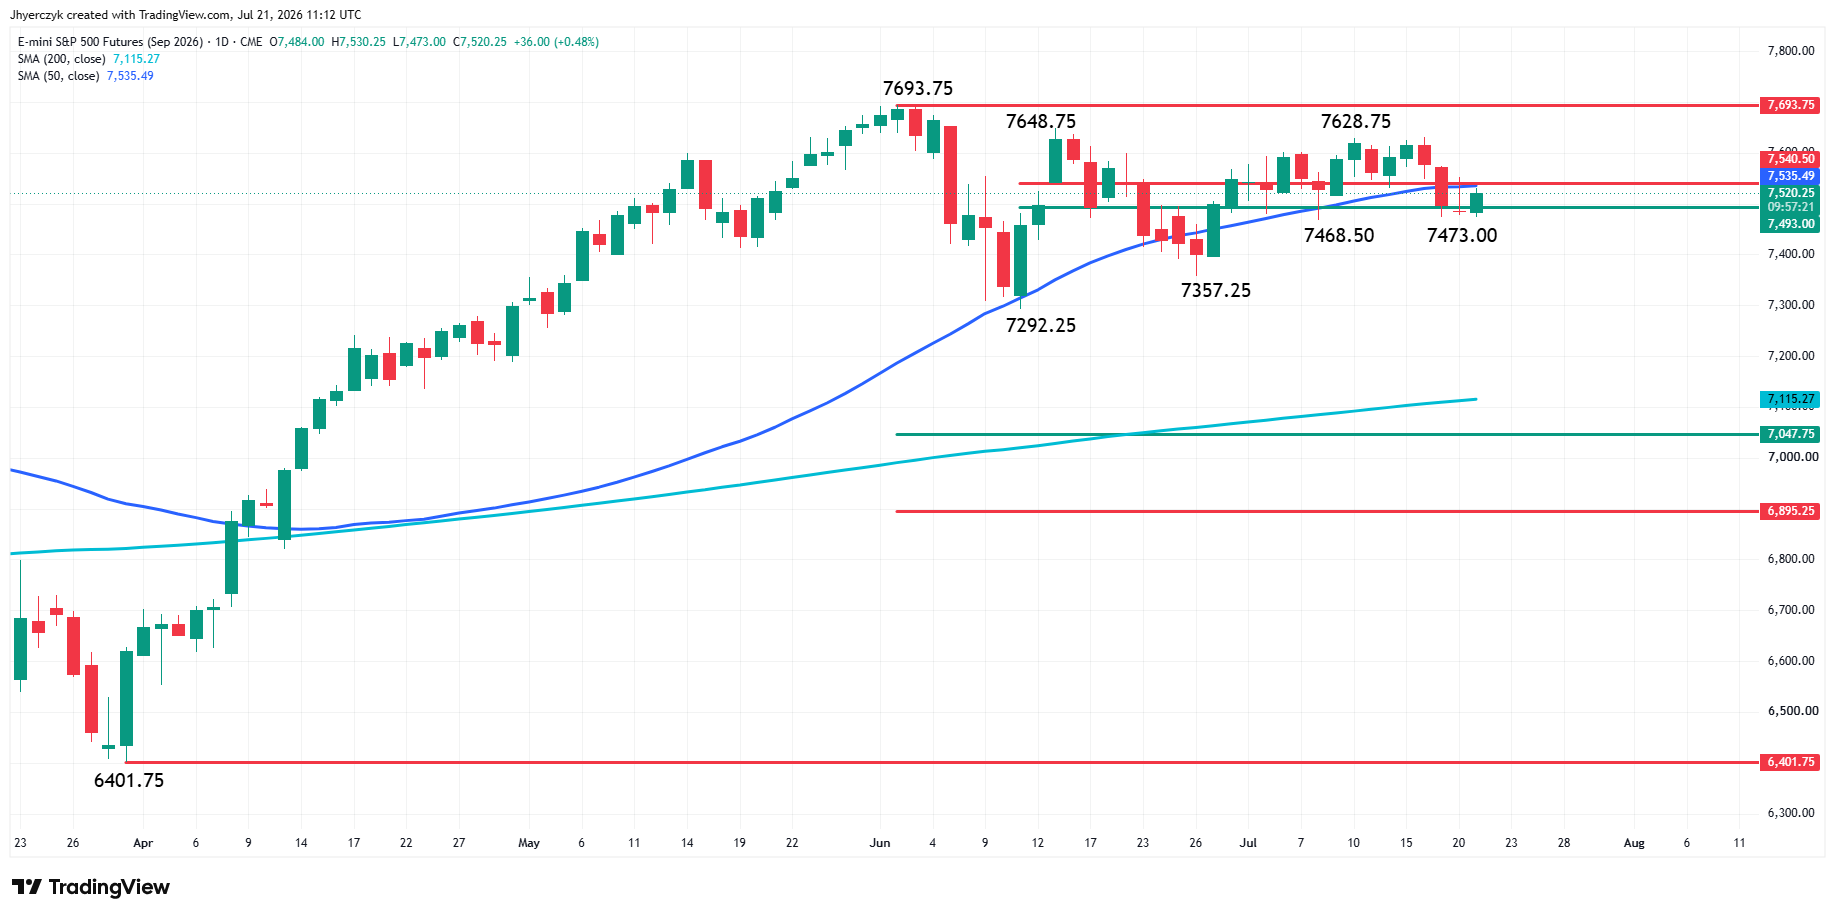
September E-mini S&P 500 Index futures are edging higher early Tuesday. After testing 7473.00 overnight, the same bottom as Friday’s low, the benchmark index rebounded enough to regain a short-term 50% level at 7493.00. The move puts the index in a position to challenge the 50-day moving average at 7535.58 and the 61.8% level at 7540.50. The chart pattern suggests this area is the key to today’s direction.
Overcome 7540.50 with conviction, and all of a sudden the two main tops at 7628.75 to 7648.75 become a possibility. These two tops are the last potential resistance before the all-time high at 7693.75.
If sellers continue to defend the 50-day MA and the 61.8% level then the index could retest 7493.00 or 7473.00. The latter appears to be a possible trigger point for an acceleration into main bottom support at 7468.50, 7357.25 and 7292.25.
To simplify matters, trader reaction to the 50-day MA at 7535.58 is likely to determine whether today’s early rally extends into the cash market session, or if the selling pressure resumes.
NASDAQ 100 Price Forecast
Every new NASDAQ 100 analysis as it publishes, today's technical signal and key levels, live price — on one page.
See all NASDAQ 100 forecastsDaily September E-mini Nasdaq-100 Index Futures
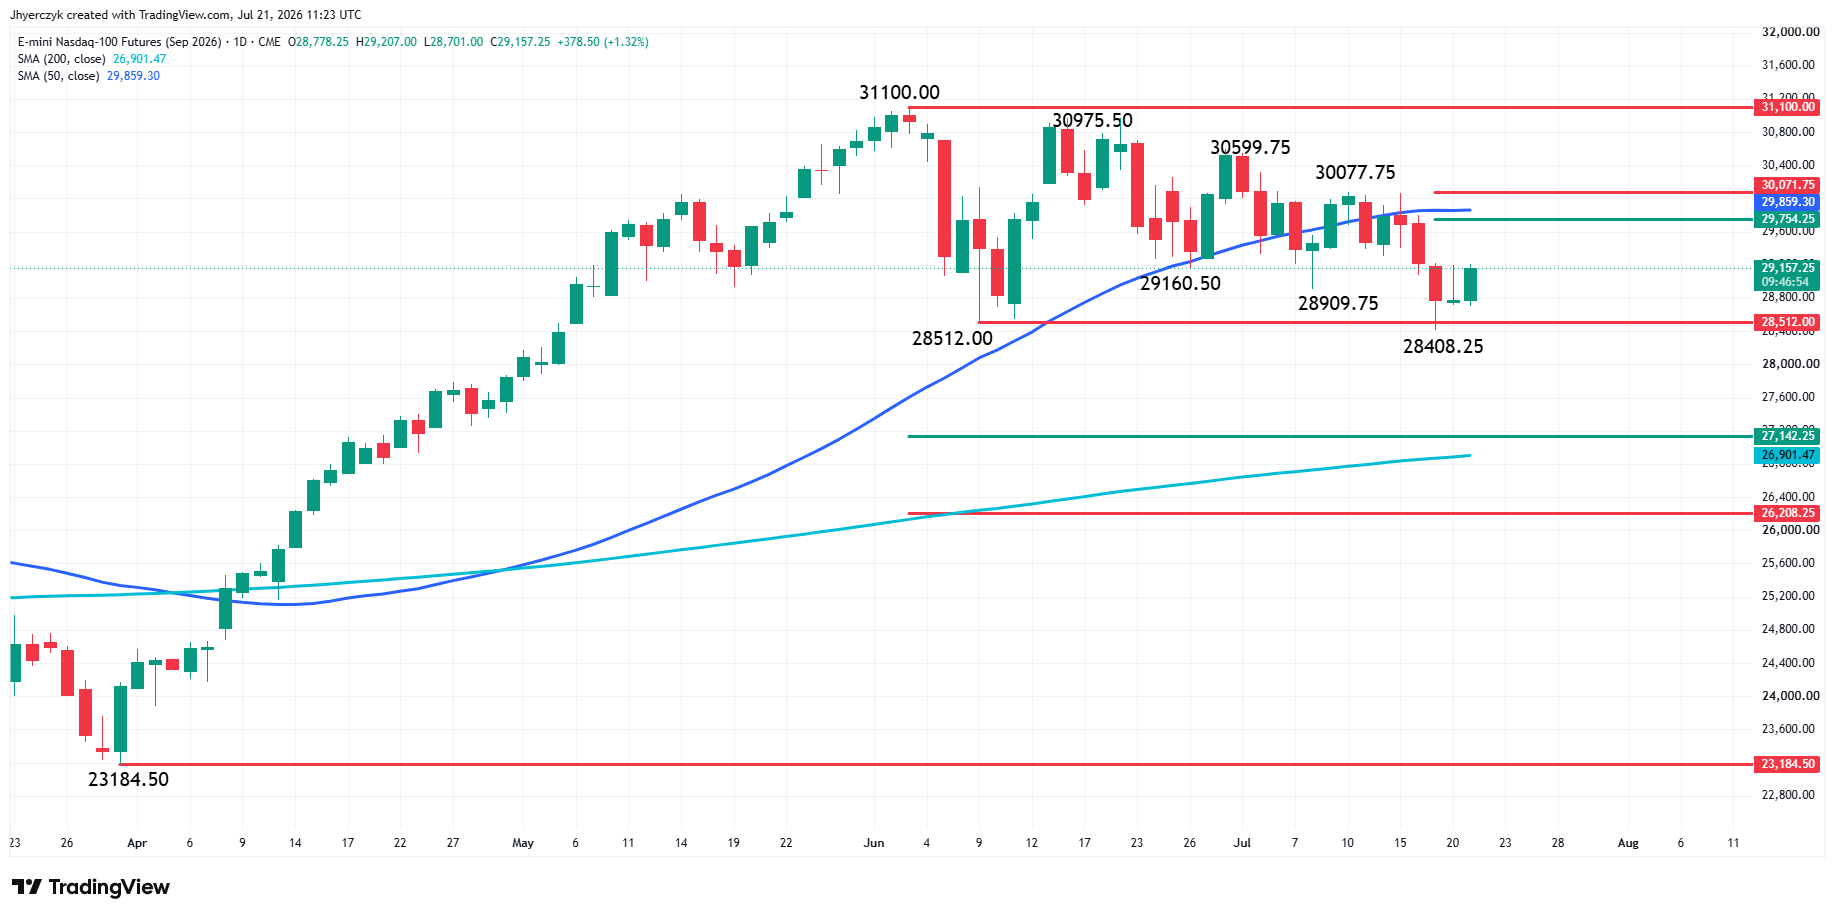
September E-mini Nasdaq-100 Index futures are sharply higher during the pre-market session on Tuesday. Traders are now looking for a trigger point that could lead to further upside activity. The current set-up on the daily chart suggests 29220.00 could be that point.
My early assessment concludes that strong buying volume could trigger a surge to the upside with plenty of room to test the short-term retracement zone at 29754.25 to 30071.75. Inside this area is the 50-day moving average at 29859.00.
Trading between 29220.00 and the minor bottom at 28408.25 could lead to more consolidation, but a failure to hold the support will put the long-term retracement zone at 27142.25 to 26208.25 back on the radar along with the 200-day MA at 26901.41.
Daily September E-mini Dow Jones Industrial Average Futures
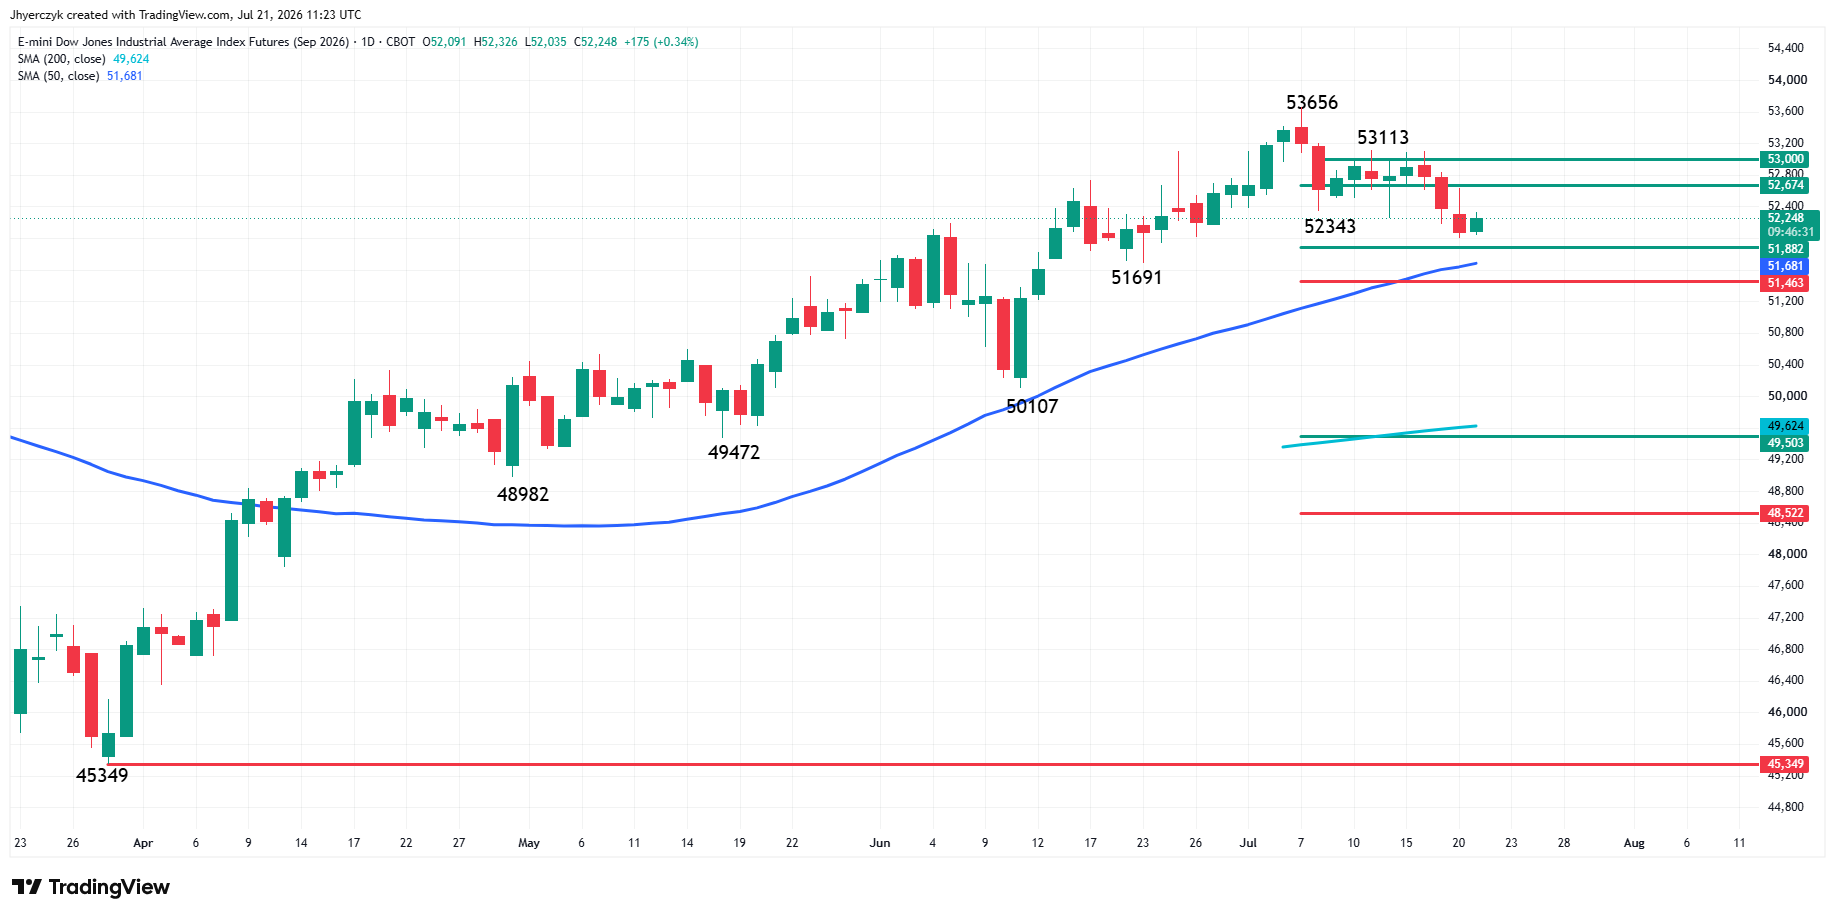
September E-mini Dow futures are steady early Tuesday. The blue chip indicator is trading above the short-term retracement zone at 51882 to 51463 with the 50-day moving average at 51681 inside this zone.
The minor trend is down with the E-mini Dow facing potential resistance at a pair of 50% levels at 52674 and 53000. Taking out the swing top at 53113 could shift momentum to the upside with the all-time high at 53656 the primary upside target.
Chip Rebound Still Needs Earnings Proof
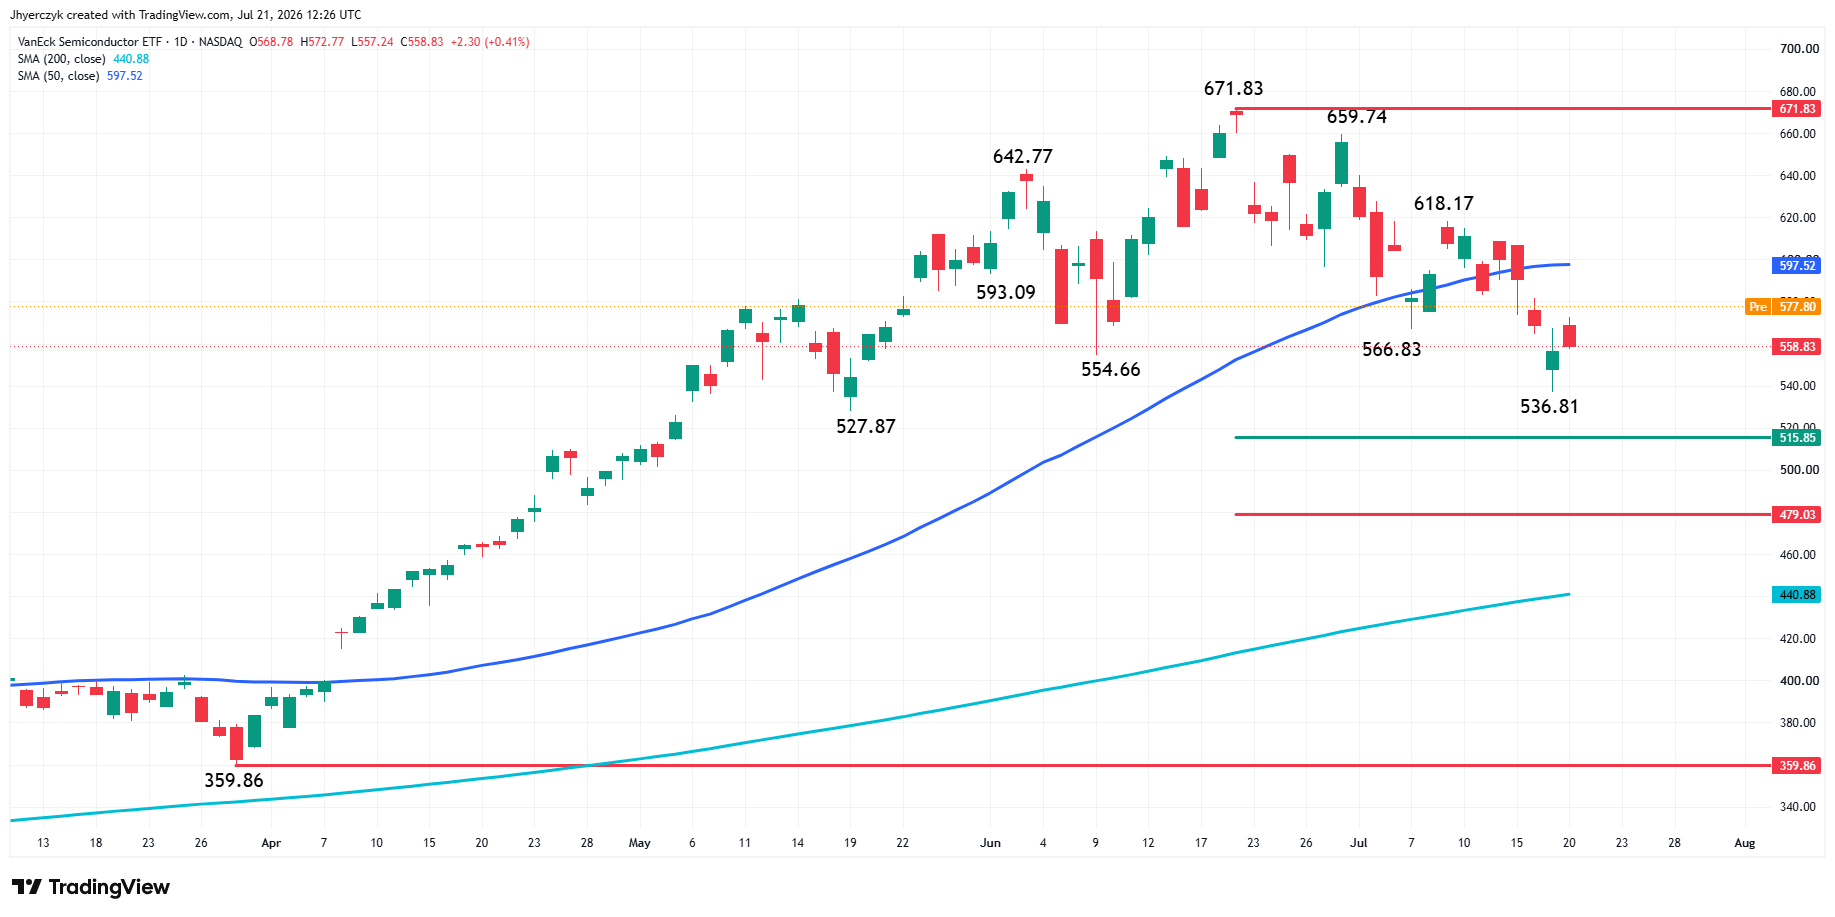
The VanEck Semiconductor ETF is up more than 3% before the bell with Micron, Marvell Technology and Astera Labs each running about 6% higher and Intel gaining more than 5%. The group took heavy selling last week and Tuesday’s move looks like buyers stepping back into the names that got hit hardest.
Alphabet, IBM and Tesla are all on the earnings calendar later this week and that is where the chip rebound gets its real test. The bid is here today but the AI spending story behind it has to survive those reports.
Early Beats from 3M and GM Lift the Dow
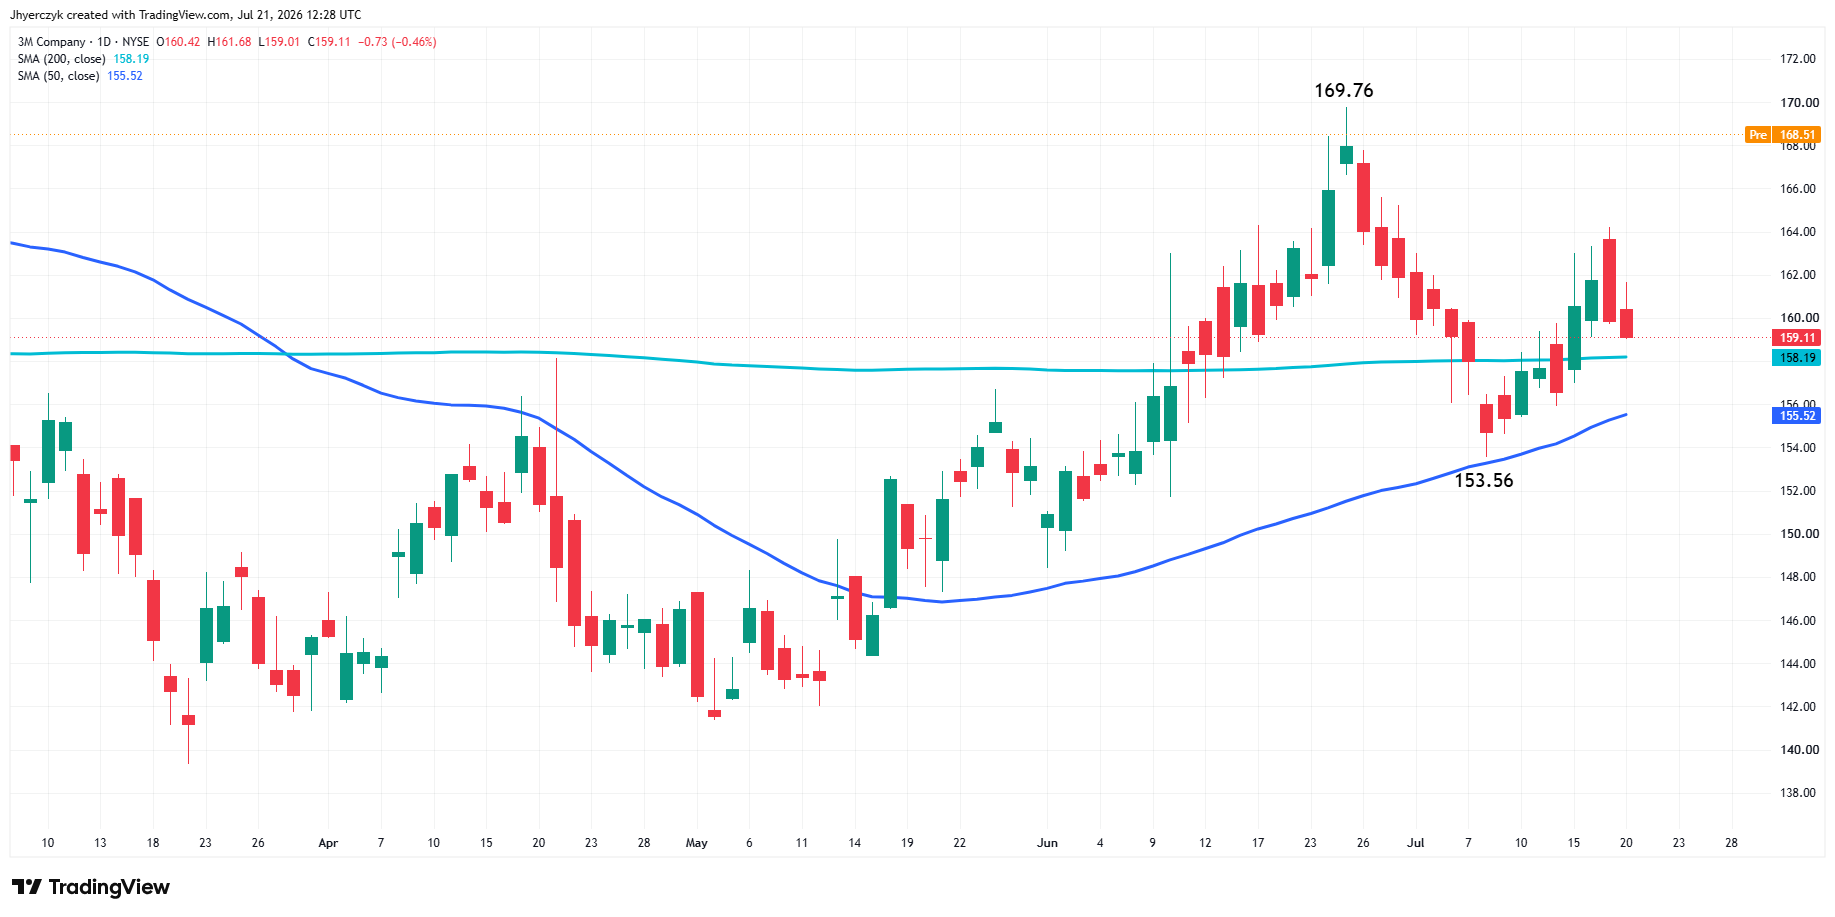
3M is up more than 7% after beating second-quarter estimates and raising full-year earnings guidance. General Motors is higher by more than 2% on adjusted earnings of $3.57 per share against expectations of $3.20 with revenue at $48.03 billion versus the $47.01 billion Wall Street wanted. About 54 S&P 500 companies have reported so far and 87% have beaten bottom-line estimates according to FactSet. The early numbers are strong but the AI names later this week are what this market is really waiting for.
Oil Pullback Takes Pressure Off Growth
Oil is pulling back from Monday’s war-driven advance as mediators work on a 10-day ceasefire proposal between the United States and Iran. Lower crude is giving growth stocks room after higher energy prices dragged the averages lower Monday.
The proposal is not a deal. Central Command has carried out its 10th consecutive night of strikes after President Trump declared the ceasefire over and Tehran has struck U.S. military assets across the Middle East. The Houthis declared a maritime embargo against Saudi Arabia. The war premium is still in crude and every diplomatic headline pulls some of it out while every new strike puts it back.
Gold Gets a Bid but Rates Set the Ceiling
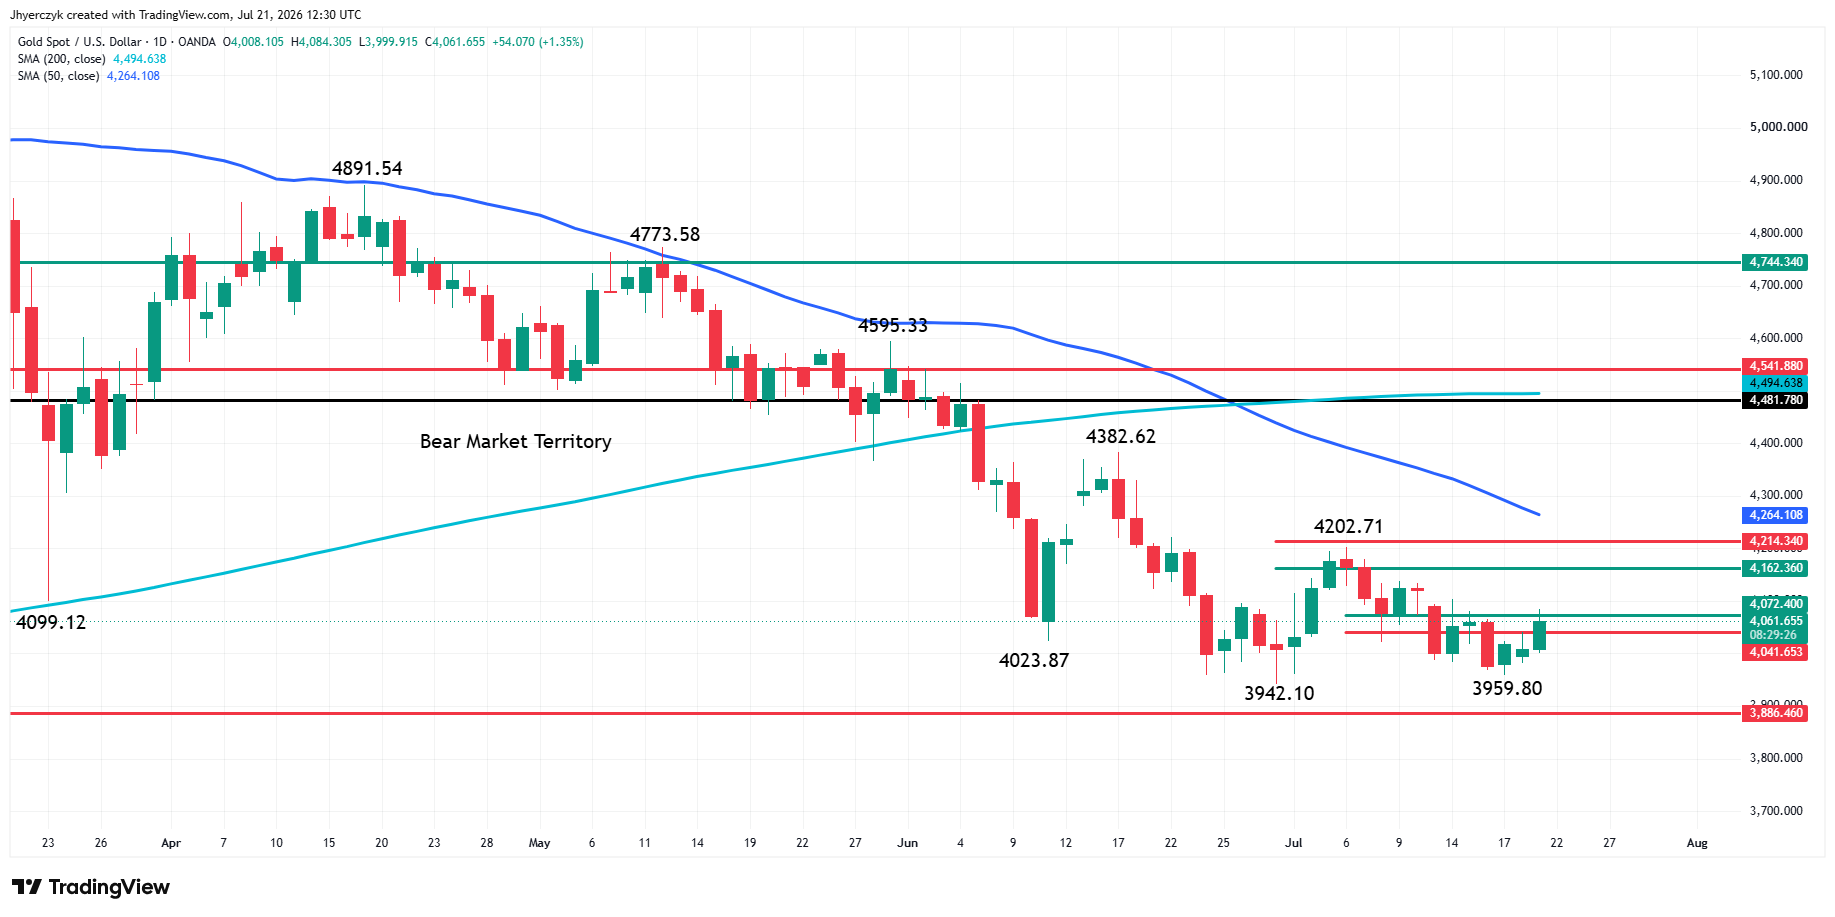
Spot gold is up 1.3% near $4,059 and silver is climbing 5% as ceasefire talk shifts the rate outlook. UBS said hawkish signals from Fed Chair Kevin Warsh and expectations for higher policy rates are keeping a ceiling on gold while stronger economic activity and higher oil prices add to the pressure. The diplomatic turn is giving gold buyers a reason to lean in but the rate story has not changed enough to clear the way.
Stocks in the News
Novartis is up 4% after posting second-quarter core earnings of $2.41 per share on revenue of $14.41 billion, both above Wall Street estimates. Nebius Group is up 6% after Nvidia disclosed a 9.3% stake in the AI cloud company. Domino’s Pizza is down 1% after second-quarter earnings missed estimates despite revenue beating.
What to Watch
The earnings calendar is the story this week. The chip rebound driving Tuesday’s rally needs this week’s AI earnings to confirm the spending cycle is still running and Alphabet, IBM and Tesla are the names that will answer that question. Oil is the other variable and a 10-day ceasefire would take more premium out of crude and help the broader market hold this bid, while another escalation sends energy higher and puts rate pressure right back on the growth names leading today.
The S&P 500 is testing its 50-day average and the retracement level just above it, making that cluster the key for whether the early bid extends into the regular session. The Nasdaq-100 has a trigger point that would open the path toward its own 50-day average and the retracement zone above. Both indexes are holding above short-term support and the distance between those levels and resistance overhead is where this market decides its next direction.
More Information in our Economic Calendar.