Oil Break Lifts Futures Before Fed and Megacap Earnings
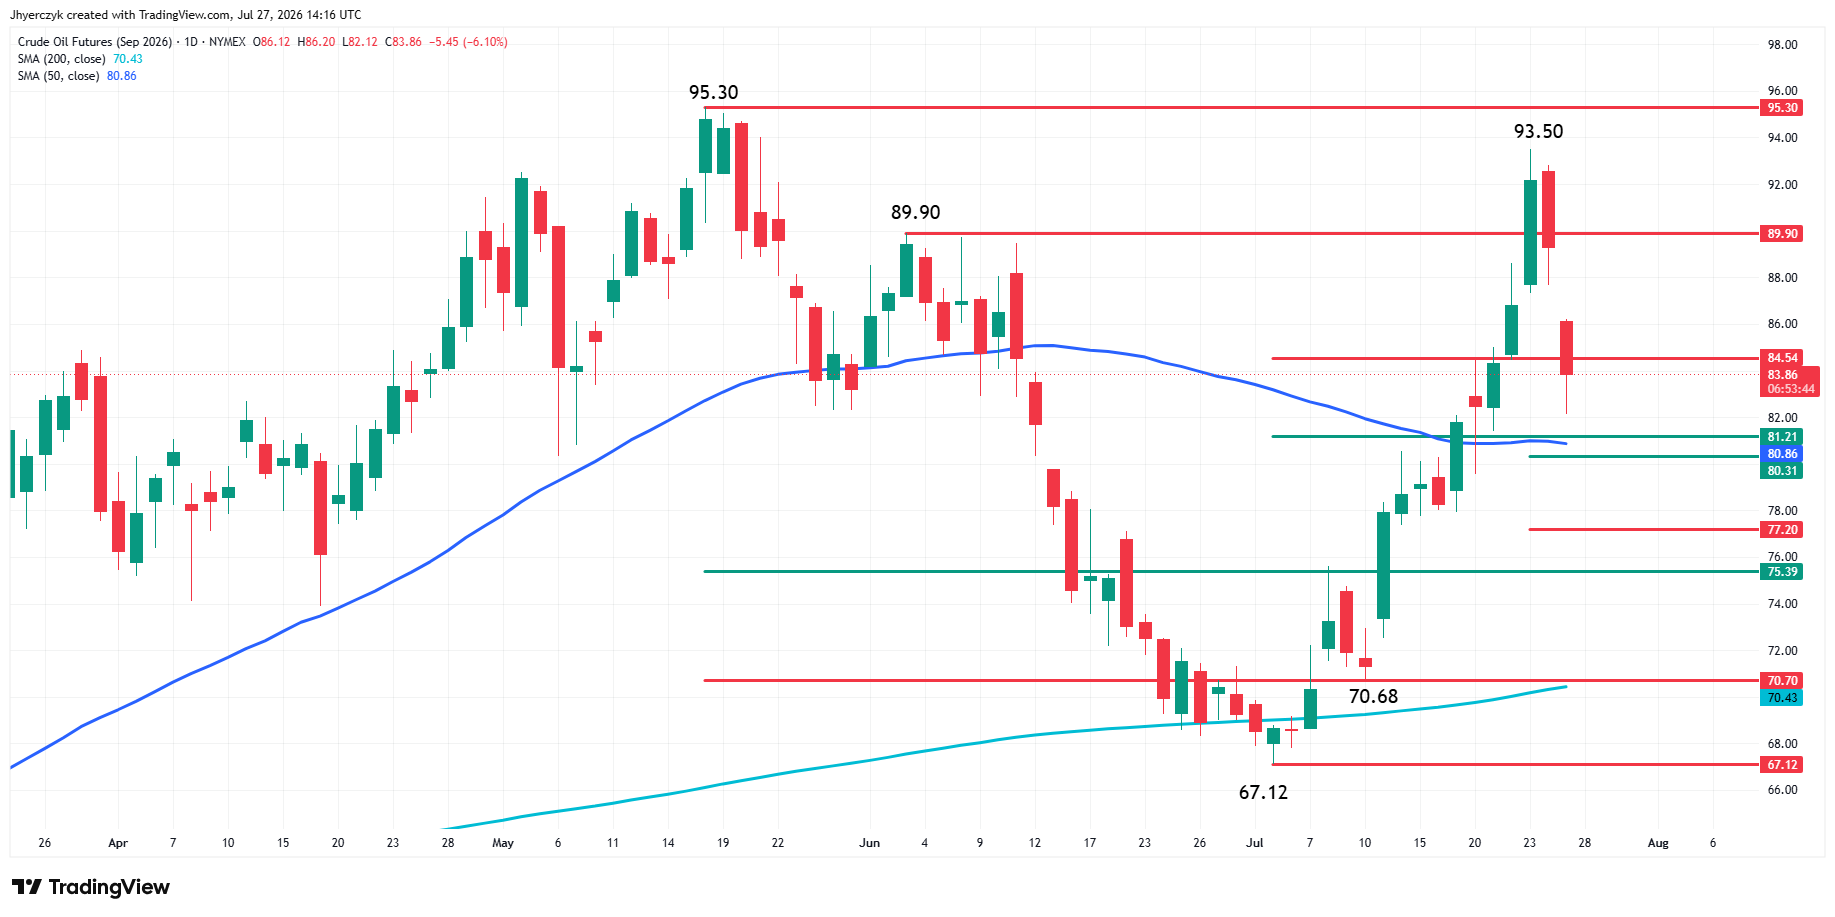
Crude oil is down sharply Monday morning and stock futures are following it higher. The relief is real but the week ahead has the FOMC on Wednesday and Amazon, Apple, Meta and Microsoft all reporting earnings. One crude session pulling back does not settle either of those.
Dow futures are up more than 500 points or about 1.1%. S&P 500 futures are higher 0.8%. Nasdaq-100 futures are up 1.2%.
The Dow has the strongest early bid because it has less exposure to the semiconductor selling that hit the Nasdaq last week. The Nasdaq futures gain tells you buyers are willing to test the other side of the oil trade after a week where Brent above $100 drove yields to their highest levels since January 2025.
Fewer Attacks Is Not the Same as Peace
The pause in U.S.-Iran strikes over the weekend gave crude sellers an opening but the war has not ended. Ukraine struck an Iranian commercial vessel in the Caspian Sea over the weekend and Tehran called it a hostile and criminal act. The Red Sea remains a problem for Saudi shipping. Hormuz traffic is still impaired.
Durable Goods Came in Soft
June durable goods orders rose 0.3% against a 2.1% estimate and well below May’s 4% increase. Transportation equipment fell 13.5% while computers and electronic products rose 3.1%. Orders excluding transportation gained 0.6% so the report was not weak across the board but the headline miss gives bond buyers another reason to stay involved after last week’s yield surge. The bigger question is whether softer data gives the Fed any cover to hold Wednesday. That answer comes from Warsh’s press conference.
AI Spending Gets Its Biggest Test This Week
Amazon, Apple, Meta and Microsoft all report this week and the results either calm the spending debate or bring the chip selling back. Alphabet raised its capex forecast last week and the stock dropped more than 5%. The market wants proof the money is producing revenue and cash flow before it pays up for the next round of capex guidance.
The Nasdaq needs these reports to hold the early bid. Lower oil gave futures room Monday morning but the growth trade cannot recover on cheaper crude alone. It needs the biggest names in technology to show the AI buildout is worth what it costs.
NASDAQ 100 Price Forecast
Every new NASDAQ 100 analysis as it publishes, today's technical signal and key levels, live price — on one page.
See all NASDAQ 100 forecastsDaily September E-mini Nasdaq-100 Index Futures
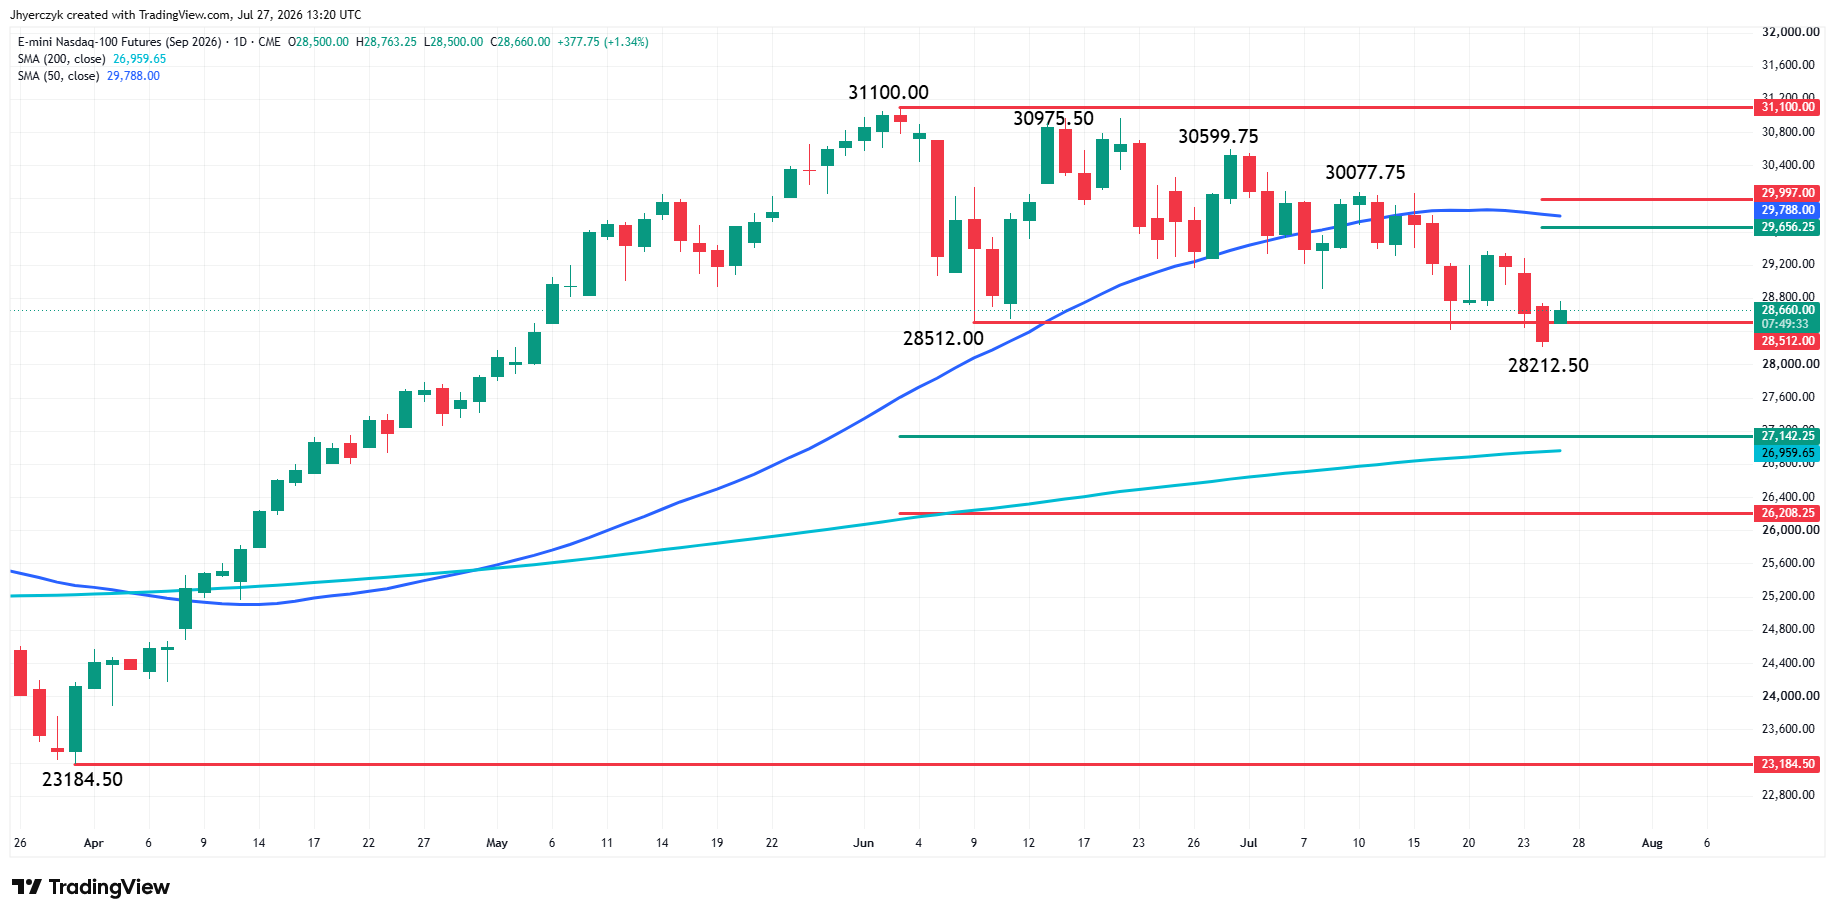
September E-mini Nasdaq-100 Index futures are expected to open higher, but it’s still in a downtrend. The early price action suggests that today’s early move looks more like short-covering and a technical bounce. However, if upside momentum does build, then the nearest upside target is a short-term retracement zone at 29656.25 to 29997.00. Inside this zone is the 50-day moving average at 29788.24.
The selling will resume if buyers take out last week’s low at 28212.50 with conviction. The daily chart indicates the next potential downside target is the long-term retracement zone at 27142.25 to 26208.25. Inside this zone is the 200-day moving average at 26959.72.
Essentially, the index appears to be saying, hold 28212.50 and there’s a chance of a rebound to the 50-day moving average at 29787.98. But a failure to establish support at 28212.50 will open the door to a clean break into the 200-day moving average at 26959.66.
What to Watch
Monday’s bid needs two things to survive the week. Oil has to stay lower long enough to keep the rate pressure from rebuilding before Wednesday. Then the FOMC has to pass without Warsh turning the energy story into a reason to tighten. If both of those happen, the earnings calendar gets a clean shot at setting the direction. If either one fails, the Nasdaq gives back Monday’s gain before the megacap reports even land.
The market is trading fewer attacks for the moment, not a resolution. Stock buyers are holding into Wednesday’s Fed decision. Thursday’s earnings are carrying that risk whether oil stays lower or not.
The Nasdaq-100 is still in a downtrend and the early move looks more like short-covering than a shift in direction. Last week’s low is the line between a bounce toward the 50-day average and a breakdown into the long-term retracement zone where the 200-day average is waiting. The market is holding that level for now but Wednesday and Thursday will determine whether it keeps holding.
More Information in our Economic Calendar.