
Nasdaq Leads Monday but CPI Wednesday Holds the Real Answer
The Nasdaq is carrying the premarket bid Monday because Friday’s payrolls miss knocked September hike odds down to 44% from 67% a week ago. The S&P 500 closed last week at a record. All three indexes posted their best weekly gains since April. That gives buyers the trend but it also leaves them stretched heading into Wednesday’s CPI report, which can put the inflation argument right back in front of a committee that still has hawks on record.
Crude is back above $79 after Iran denied direct Hormuz negotiations over the weekend. The Dow is flat. The Nasdaq minor trend is up but the main trend is still down, and the split between growth stocks running and the rest of the market waiting tells you this rally is not broad yet.
Nasdaq-100 futures are up 0.46%. S&P 500 futures are higher by 0.16%. Dow futures are near unchanged.
Friday’s Payrolls Gave Growth Stocks Room to Run
July payrolls fell by 23,000 jobs when the market expected an 80,000 gain. Prior months were revised lower. Wages slowed. The unemployment rate dropped to 4.1% but participation slipped with it. That is not a report the Fed hikes into, and the Nasdaq caught the strongest bid Friday because lower rate odds reduce the pressure on growth valuations.
September hike probability dropped to about 44%. Nobody is trading a rate cut. The market is trading a Fed that has a much harder time acting when hiring is contracting and wages are cooling. That setup favors the high-multiple technology names that led last week and it is why the Nasdaq is leading again Monday morning.
Oil Back Above $79 Complicates the Relief Trade
Iran denied direct negotiations over the weekend. President Trump said the two sides were only semi-negotiating. WTI crude is back above $79 after rising about 1% Sunday. That matters because crude is still the fastest route from the Middle East to inflation expectations, Treasury yields and the Fed.
Last week’s oil drop did half the work for stocks. It removed part of the inflation argument right when payrolls removed the labor-market argument for September. If Hormuz headlines push crude back toward last month’s levels, that relief disappears and CPI becomes even more important.
NASDAQ 100 Price Forecast
Every new NASDAQ 100 analysis as it publishes, today's technical signal and key levels, live price — on one page.
See all NASDAQ 100 forecastsCPI Wednesday Is the Report That Holds the Rally Together
Headline CPI is expected at 3.4% year-over-year. Core at 2.5%. The market just repriced September on one weak payrolls report and now it has to find out whether inflation cooperates or contradicts. Crude back above $79 with Hormuz talks stalling is not the setup bulls want heading into that number. A soft print and this rally keeps going. A hot one and Friday’s winners become Wednesday’s problem. PPI Thursday and retail sales Friday pile on after that.
Stocks in the News
Super Micro Computer and CoreWeave report this week along with Applied Materials, Cisco, On Holding and Cava. The market has been punishing AI names that spend without showing returns. One bad guide from any of these can still move a stock 10% or more even with CPI dominating the calendar.
Daily September E-mini Nasdaq-100 Index Futures Technical Analysis
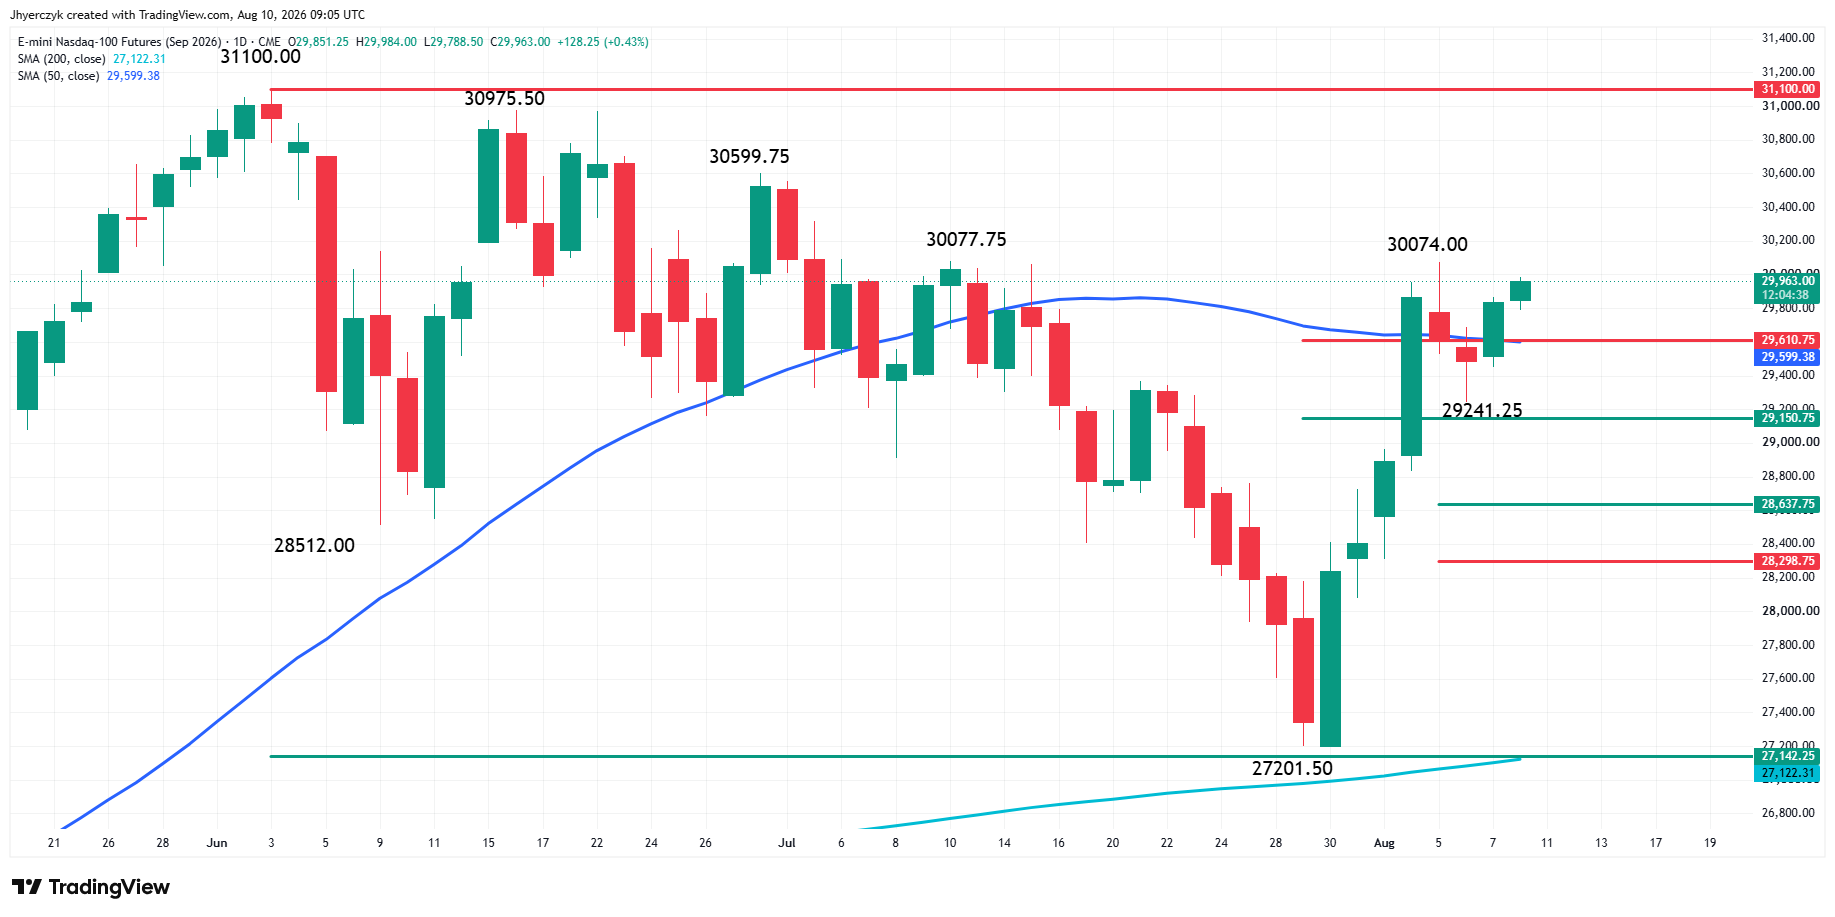
September E-mini Nasdaq-100 Index futures are edging higher shortly before the cash market opening on Monday. Bullish traders are trying to build on Friday’s strong gains, which pushed the tech-weighted index to the strong side of the 50-day moving average at 29,599.54, creating new support. The index is also trading on the strong side of its key retracement zone at 29,610.75 to 29,150.75.
The Fibonacci level at 29,610.75 and the 50-day moving average at 29,599.54 have formed an important support cluster that should set the tone today.
Swing chart analysis shows the minor trend is up, but the main trend is still down. The minor trend is controlling the upside momentum. The minor trend will change to down on a trade through 29,241.25.
The main trend will change to up on a move through the swing top at 30,077.75. A sustained move over this level could create the upside momentum needed to challenge additional swing tops at 30,599.75 and 30,975.50. These are the last two resistance levels before the record high at 31,100.00.
On the downside, a sustained break under the 50% level at 29,150.75 could extend the losses into another retracement zone at 28,637.75 to 28,298.75. This represents 50% to 61.8% of the current rally from 27,201.50 to 30,074.00.
Daily September E-mini S&P 500 Index Futures Technical Analysis
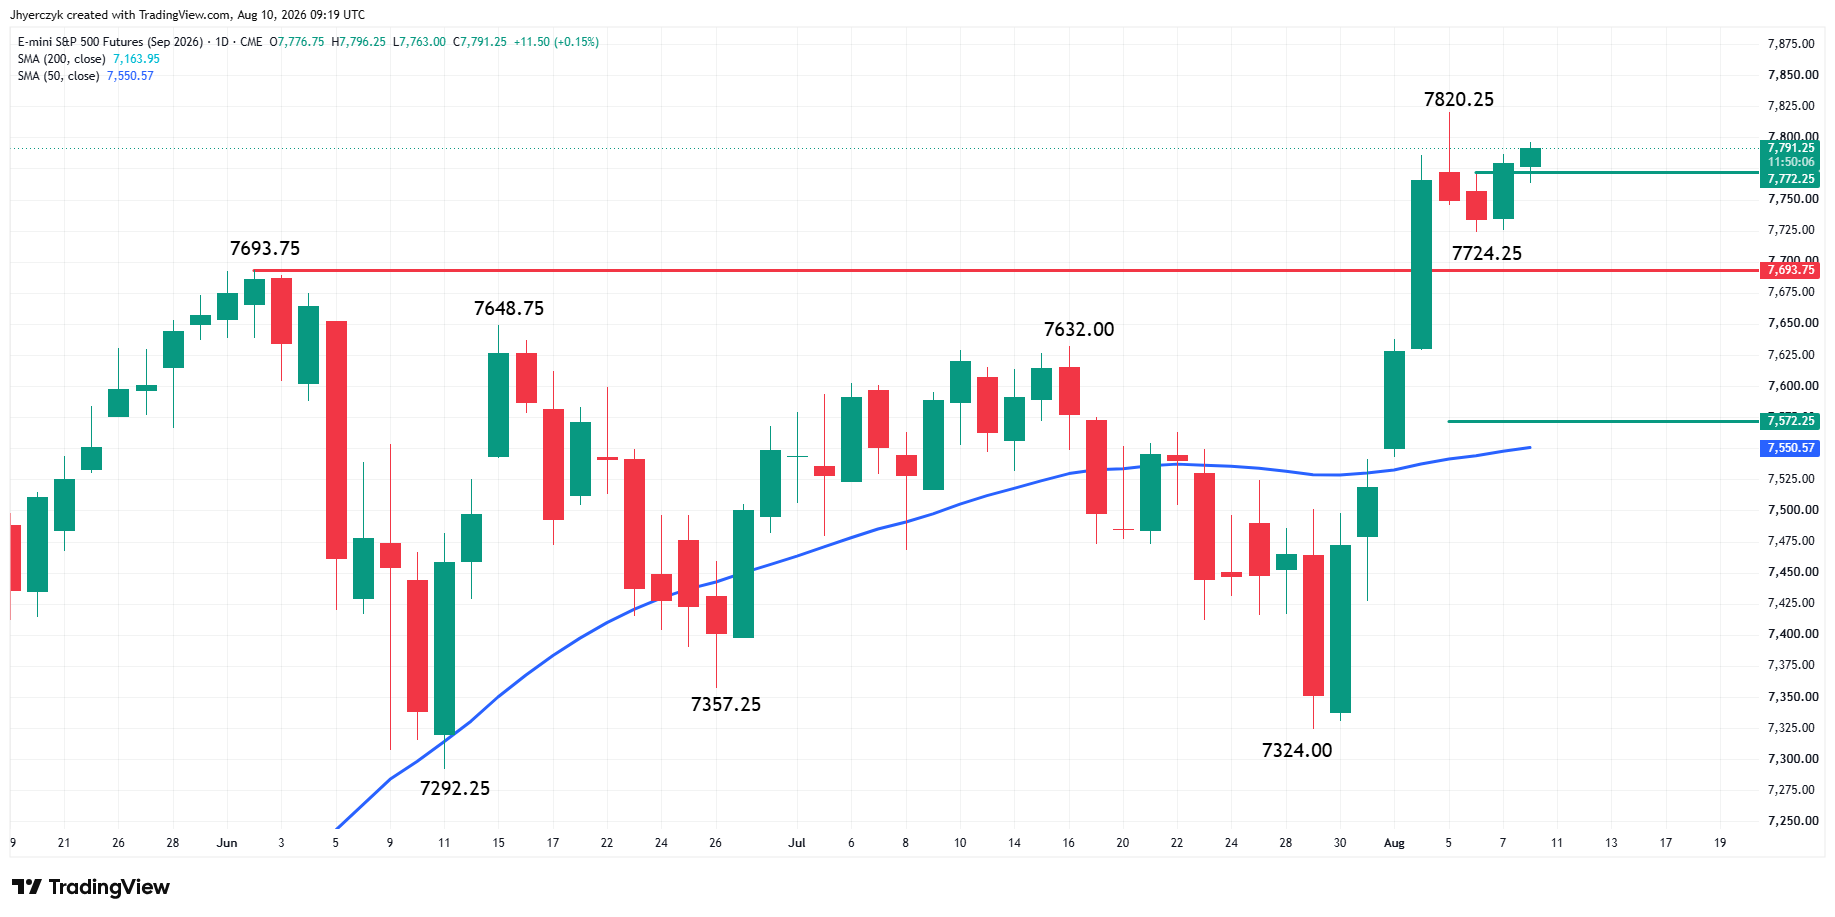
September E-mini S&P 500 Index futures are edging higher early Monday with traders eyeing the record high at 7,820.25.
Both the minor and main trends are up according to the swing chart. A trade through 7,820.25 will reaffirm both trends. Taking out 7,724.25 will change the minor trend to down. The main trend will change to down under 7,324.00.
The minor range is 7,820.25 to 7,724.25. Early Monday, the index is trading on the strong side of its pivot at 7,772.25, indicating the presence of buyers. Trader reaction to this level could influence the direction of the index today.
The main range is 7,324.00 to 7,820.25. If the minor trend turns down and sellers take out the previous top at 7,693.75 with conviction, the index could break into the main pivot at 7,572.25. This represents 50% of the main range.
Slightly below the main 50% level is 50-day moving average support at 7,550.57. It forms a potential support cluster at 7,572.25 to 7,550.57.
Daily September E-mini Dow Futures Technical Analysis
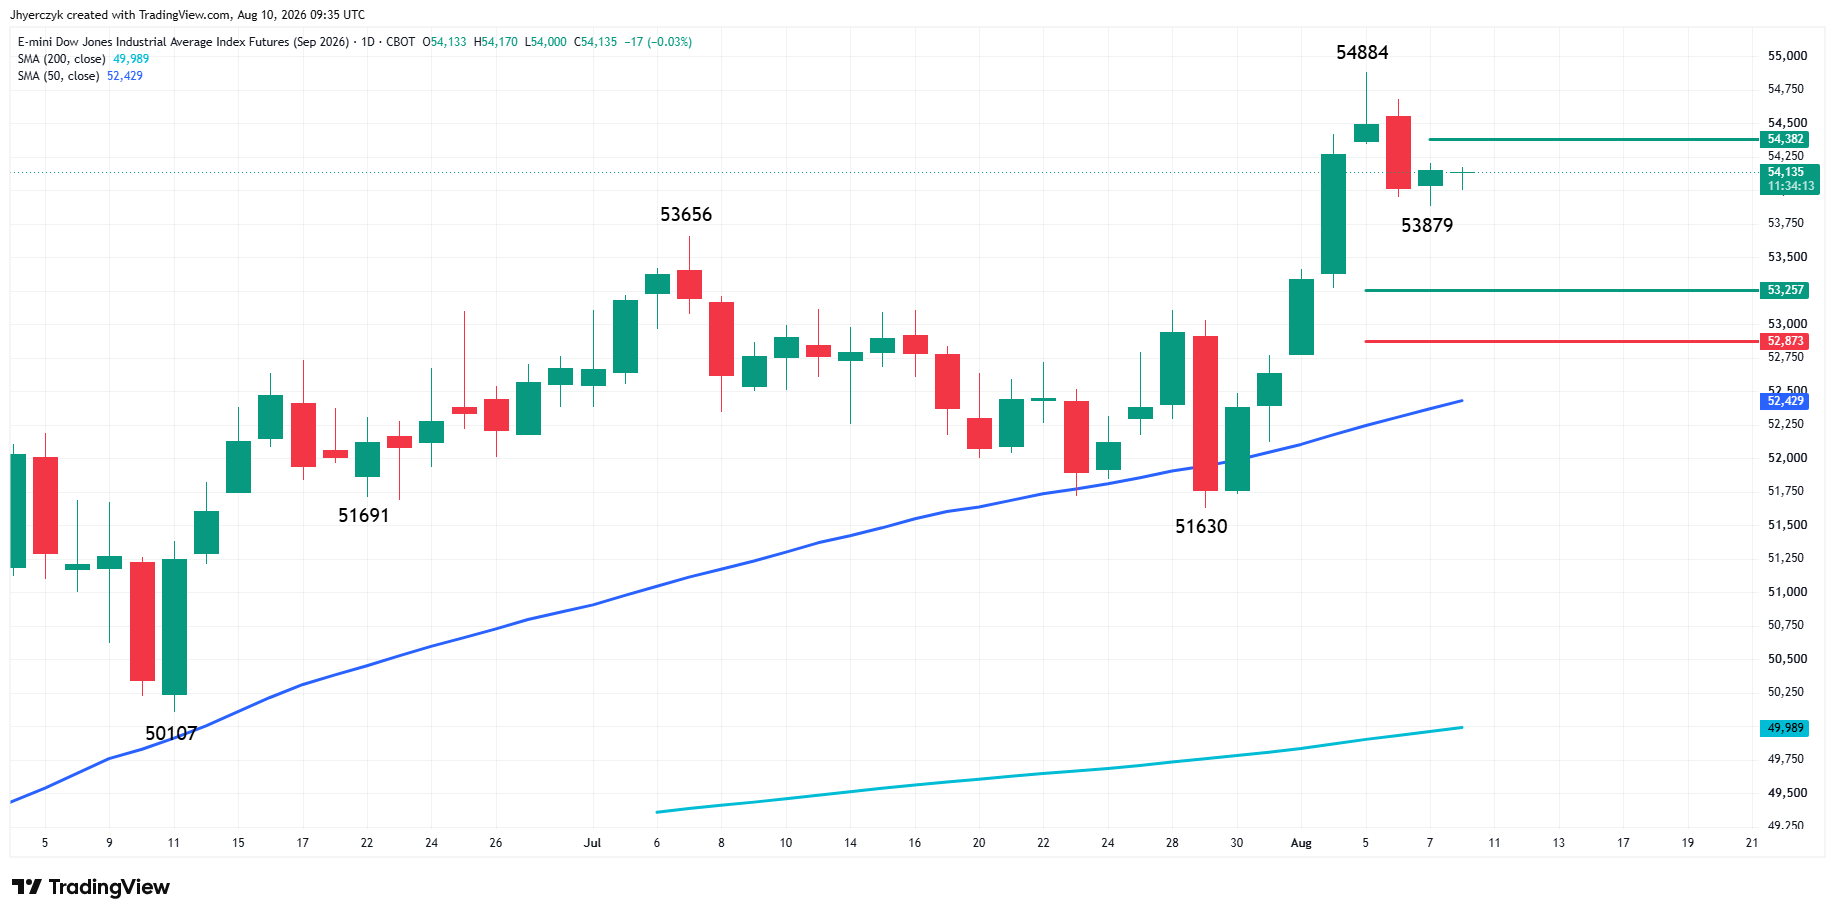
September E-mini Dow futures are trading flat during the pre-market session. The minor and main trends are up, but the market’s momentum is struggling. A trade through the record high at 54,884 will signal a resumption of the uptrend. The main trend will change to down under 51,630.
The new minor range is 54,884 to 53,879. Its 50% level at 54,382 is the first upside target today. Overcoming this level will indicate the return of buyers. If this creates enough upside momentum, then look for a possible retest of 54,884 in the near term.
Taking out Friday’s low at 53,879 will indicate the selling pressure is getting stronger. This could lead to a near-term test of the 50% to 61.8% zone at 53,257 to 52,873. This was formed by the short-term rally from 51,630 to 54,884.
Essentially, the main trend is up, but traders need to start showing support for the trend by overtaking the pivot at 54,382. If they cannot, then sellers will probe the downside under 53,879. This could lead to an even steeper break to 53,257 to 52,873.
Supporting the longer-term bullish outlook is the 50-day moving average at 52,429.
What to Watch
The Nasdaq has Friday’s payrolls working for it and crude oil working against it. CPI Wednesday decides which force wins the week. A soft inflation print keeps yields under pressure and lets growth stocks extend. A hot number with oil climbing on Hormuz doubt reassembles the rate trade and the same names that led Friday’s rally take the first hit.
The S&P 500 is at a record with both trends up on the swing chart. The Nasdaq minor trend is up but the main trend is still down, and clearing the swing top is what changes that. The Dow is flat and struggling for momentum above its pivot. Friday’s rally needs follow-through Monday or the record-high indexes start correcting back toward their 50-day moving averages, and the first hour of the cash session tells you whether this is fresh buying or last week’s short covering running out of fuel.
More Information in our Economic Calendar.