
Weak Payrolls Knock the September Hike Case Off Course
Nonfarm payrolls fell by 23,000 jobs against expectations for an 83,000 increase and the September rate-hike trade is getting unwound before the cash market opens. Average hourly earnings rose 3.2%, below the 3.5% forecast. Unemployment fell to 4.1% but the labor-force participation rate slipped with it. Treasury yields dropped, the dollar came under pressure and the Nasdaq Composite is leading the bid.
Payrolls Took September Away from the Hawks
A 23,000-job loss was not expected and it landed at the worst possible time for anyone arguing the Fed should move next month. Kashkari, Cook and Musalem have all pushed for tighter policy based on strong earnings, consumer spending and a labor market that was holding together. The inflation argument is still there. The labor-market argument just fell apart.
The two-year yield moved toward 4.18%. The 10-year fell toward 4.62%. That is the rate trade repricing before the opening bell. The lower unemployment rate gives the hawks something to point to but it came with a participation drop, not stronger hiring. The number that moves the market is the payroll loss.
The report does not guarantee a hold in September. It forces the Fed to prove that inflation risk is large enough to justify tightening while the labor market is contracting. That is a harder argument to make than it was a week ago.
Lower Oil Keeps the Inflation Case From Rebuilding
WTI near $76.85 and Brent near $81.90 are doing the rest of the work. Crude is lower again Friday on continued Hormuz optimism and that keeps the energy inflation argument from filling the gap that the jobs report just created.
Dow Jones Price Forecast
Every new Dow Jones analysis as it publishes, today's technical signal and key levels, live price — on one page.
See all Dow Jones forecastsThe deal is not finished. Iran still wants control over shipping terms and tanker traffic is far below normal. But crude staying contained is enough to keep inflation expectations from rising while the labor data is softening. The market does not need a perfect peace deal. It needs crude to hold here until September, and right now crude is cooperating.
A Hormuz breakdown is the risk to the opening rally. If crude reverses higher, yields follow and the weak payrolls number will not protect growth stocks on its own.
Stocks in the News
Atlassian is sharply higher after beating revenue and raising guidance. Twilio is up after raising its full-year outlook. Cloudflare gained on a beat and stronger guidance. Akamai is higher after topping estimates. Airbnb rose on an earnings and revenue beat.
The Trade Desk is down hard after missing on both earnings and revenue. Wendy’s is lower after a U.S. sales decline and guidance withdrawal.
First Solar is up more than 5% after President Trump imposed tariffs on products used to make solar panels. The iShares Semiconductor ETF is up more than 5% for the week as the chip group continues recovering.
Daily S&P 500 Index (SPX) Technical Analysis
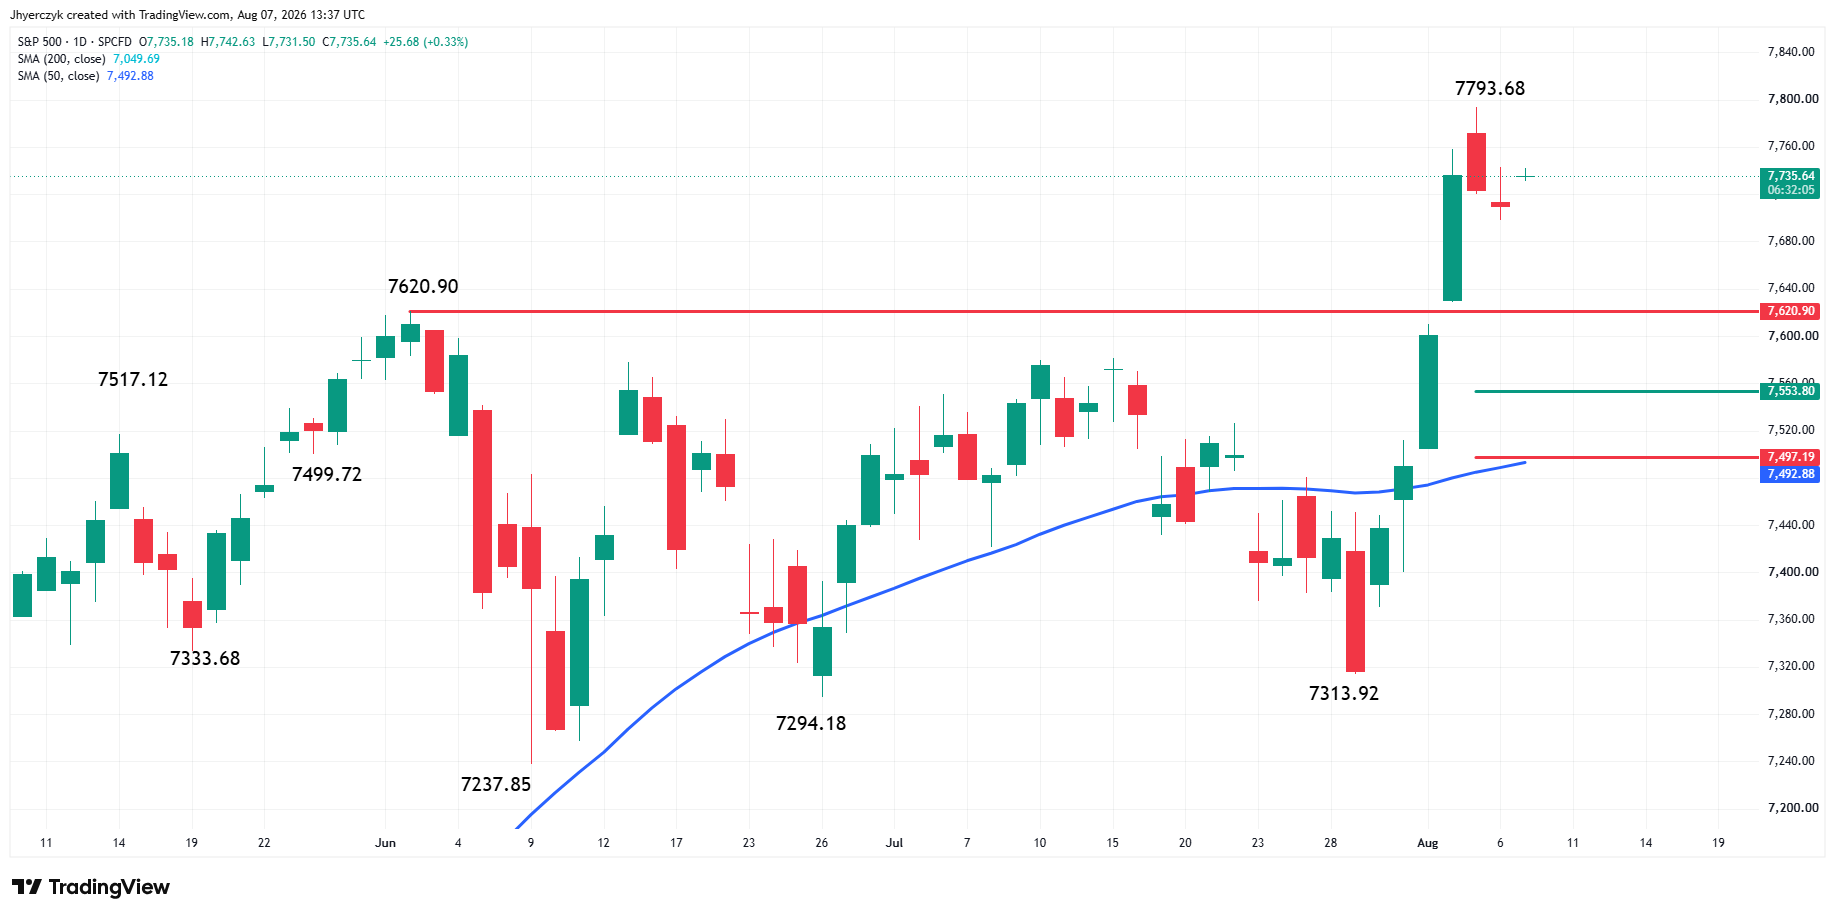
The benchmark S&P 500 Index is called higher based on the pre-market trade. If a strong opening creates enough upside momentum then look for traders to make a run at the record high at 7793.68.
If the expected rally runs into resistance and SPX turns lower then we could see a near-term pullback to the breakout price or previous record high at 7620.90. If the selling extends beyond that level, we could see a 50% to 61.8% correction into 7553.80 to 7497.19, followed by the 50-day moving average at 7488.57.
The immediate upside target is the recent high at 7,793.68. If buyers clear that high with conviction, the breakout from the 7,313.92 to 7,620.90 range projects to about 7,927.88. That puts 8,000 on the radar as the next psychological objective.
Daily Nasdaq Composite (IXIC) Technical Analysis
Nasdaq Composite Index (IXIC)
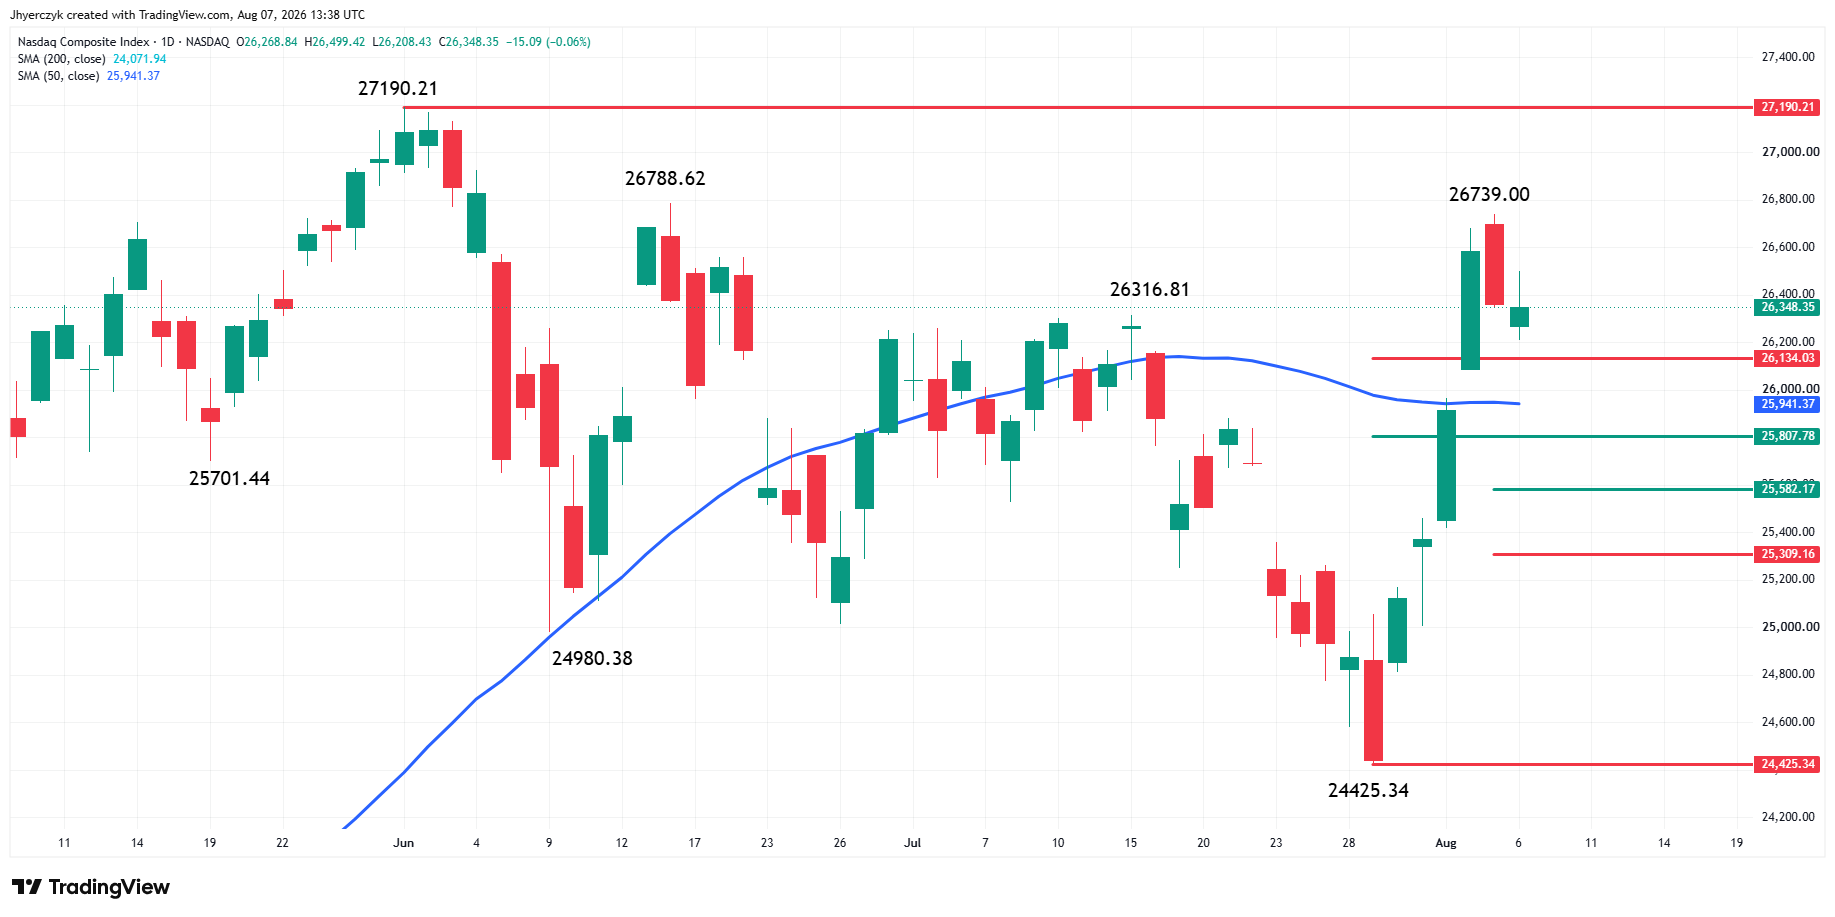
The tech-weighted Nasdaq Composite is expected to open higher. The early target is this week’s high at 26739.00. Taking out this level could create the momentum needed to challenge the June 16 main top at 26788.62. This is the last potential resistance before the record high at 27190.21.
An unexpected reversal after the opening could trigger a break into the long-term retracement zone at 26134.03 to 25807.78. Inside this area is the 50-day moving average at 25914.37, which is the major trend indicator.
A full-blown correction of the rally from 24425.34 will put the retracement zone at 25582.17 to 25309.16 in play.
A sustained breakout over the record high at 27,190.21 would put a 50% measured-move target at 28,572.65 in play. If buyers can sustain the move, the full measured-move target is 29,955.08.
Daily Dow Jones Industrial Average (DJI) Technical Analysis
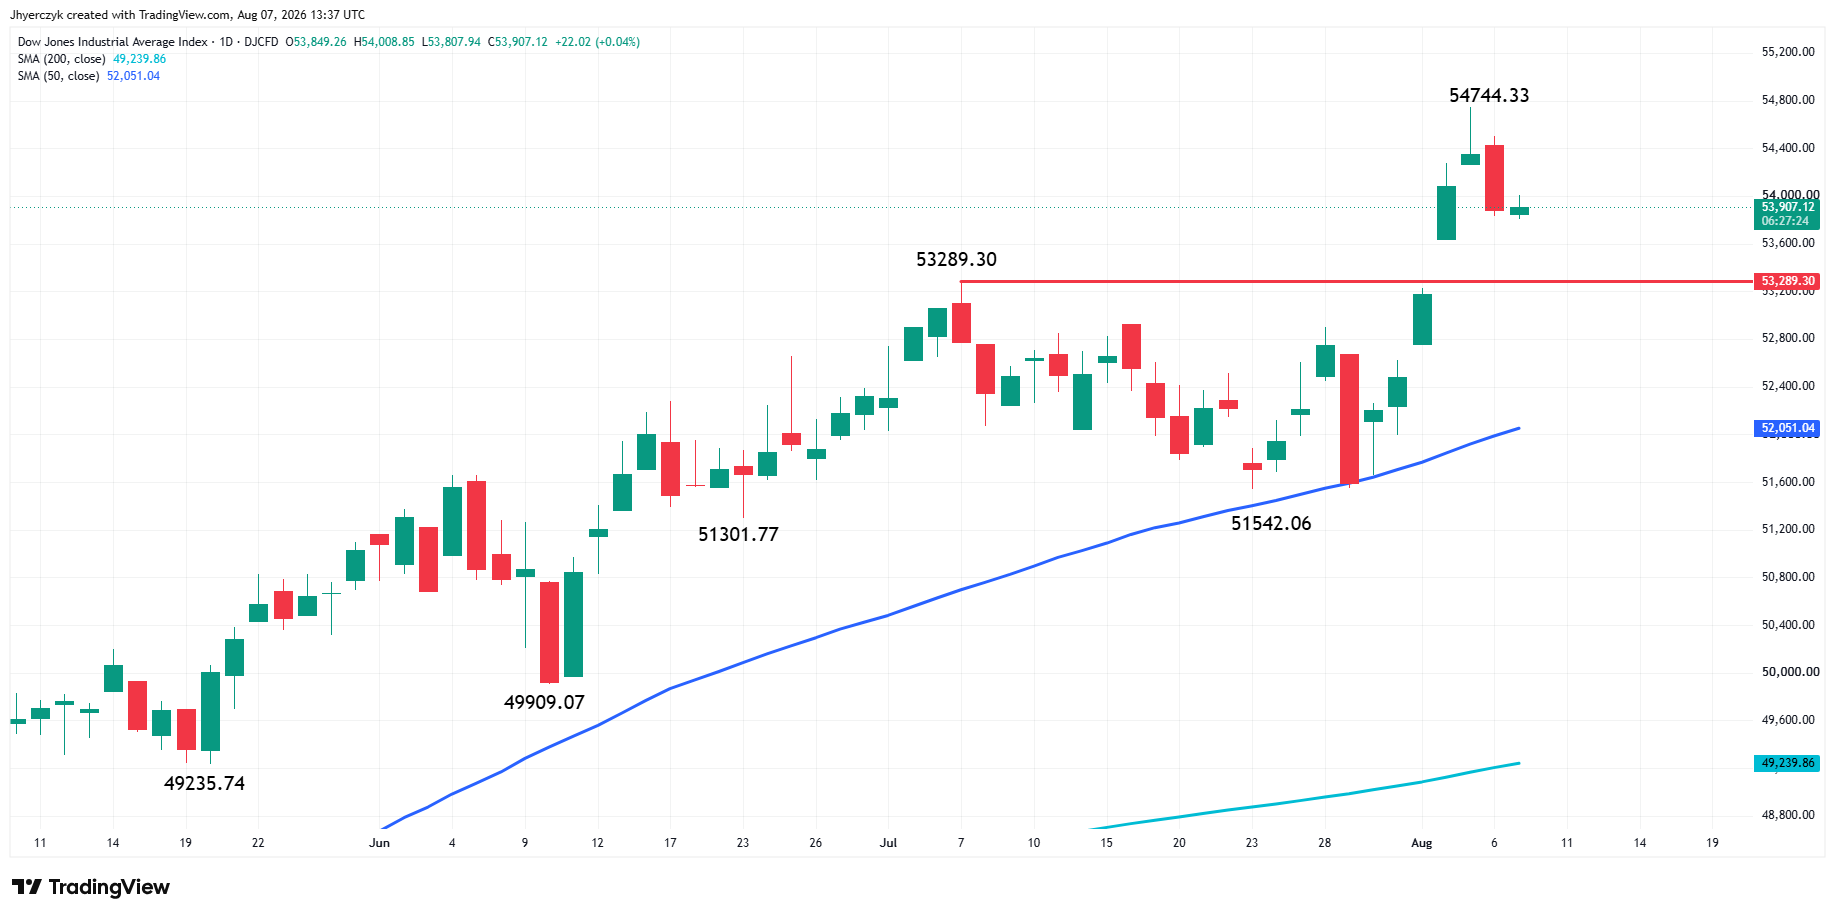
The Dow is called higher Friday after Thursday’s pullback from the record high at 54,744.33.
A sustained move over 54,744.33 will reaffirm the uptrend and put the 55,000 area back on the radar. Using the 49,235.74 to 54,744.33 range, the 50% measured-move target is 57,498.63. If the breakout produces enough upside momentum, the full measured-move target is 60,252.92.
On the downside, Thursday’s low at 53,835.02 is the first level to watch. Taking it out would confirm the selling pressure is getting stronger and put the former record high at 53,289.30 in play as support. A sustained move under that level would indicate the breakout is failing, with the 50-day moving average at 51,985.78 the next major downside target.
The long-term trend remains up, but the Dow is extended above its 50-day moving average. Friday’s response to the pre-market bid will determine whether buyers are ready to chase the breakout or whether sellers are using the rally to reduce positions.
What to Watch
A 23,000-job loss, cooling wages and a participation drop all hit the same morning. Yields fell, the dollar dropped and futures bid up before the cash market even opened. The unemployment rate fell but that came with fewer people looking for work, not stronger hiring. The Hormuz story is the one thing that can undo what the payrolls report just did, and crude only has to bounce for a session to give the hawks their inflation argument back.
The S&P 500 has a shot at its record high at 7793.68 and clearing it with conviction puts 8,000 in play. The Nasdaq needs to take out the June main top to get to the record, and the chip recovery this week is giving it the sector support to try. The first hour of the cash session tells you whether this is real buying or short covering that fades by lunch.
More Information in our Economic Calendar.