
September Opened With Bonds Selling Everywhere
U.S. stocks are lower Tuesday as a global bond selloff hit the equity market on the first trading day of September. The 10-year Treasury yield is near 4.78%. Japan’s 10-year crossed 3% for the first time since 1996. U.K. gilt yields reached levels not seen since the financial crisis. Crude is above $88 WTI and near $92 Brent. The inflation trade is not just a Warsh story anymore. It is moving across four continents at the same time.
At 14:19 GMT, the Dow Jones Industrial Average is down 92.20 points, or 0.17%, at 53,093.61. The S&P 500 Index has lost 37.63 points, or 0.49%, to 7,648.51. The Nasdaq Composite fell 236.65 points, or 0.90%, to 26,134.24.
The Nasdaq is taking the hardest hit because the technology names that carried August have the most to lose when borrowing costs rise together.

Daily S&P 500 Index (SPX) Technical Analysis
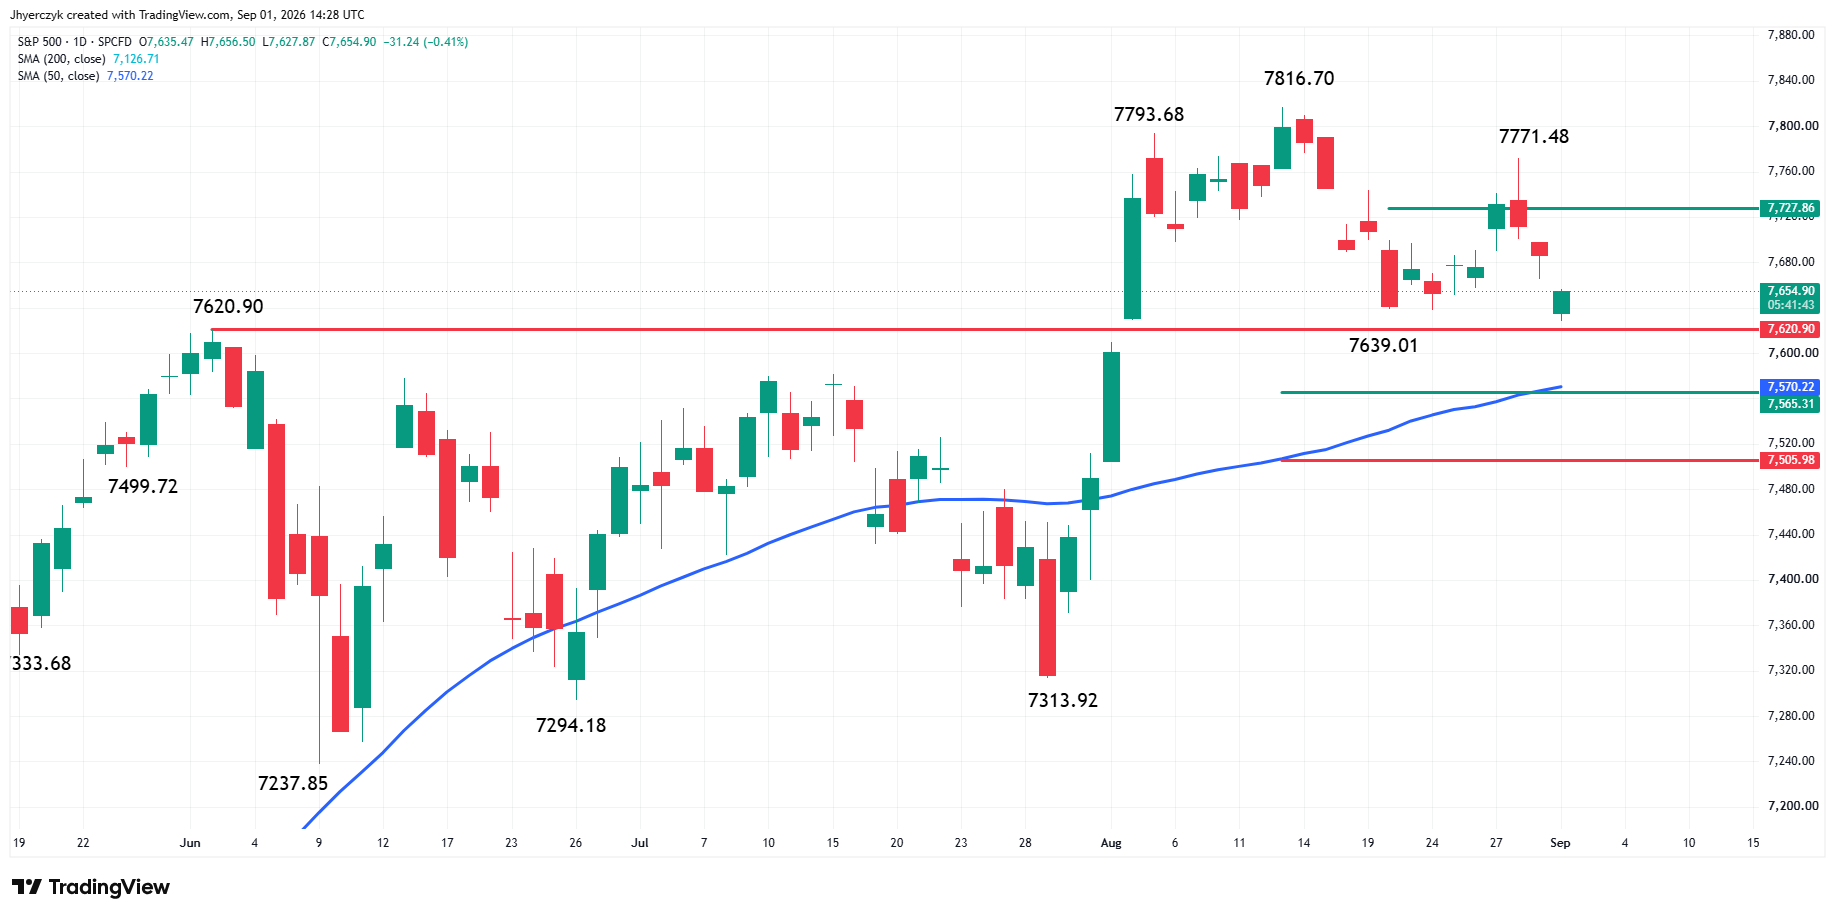
The S&P 500 Index is edging lower Tuesday after taking out its most recent swing bottom at 7,639.01. The move changed the main trend to down. The benchmark index is now within striking distance of its former record high at 7,620.90. Crossing to the weak side of this price would mean the market has given up all of its late-summer gains to the new all-time high at 7,816.70.
A failure to hold 7,620.90 could extend the selling into the 50-day moving average at 7,570.23 and the intermediate retracement zone at 7,565.31 to 7,505.98.
Daily Nasdaq Composite Index (IXIC) Technical Analysis
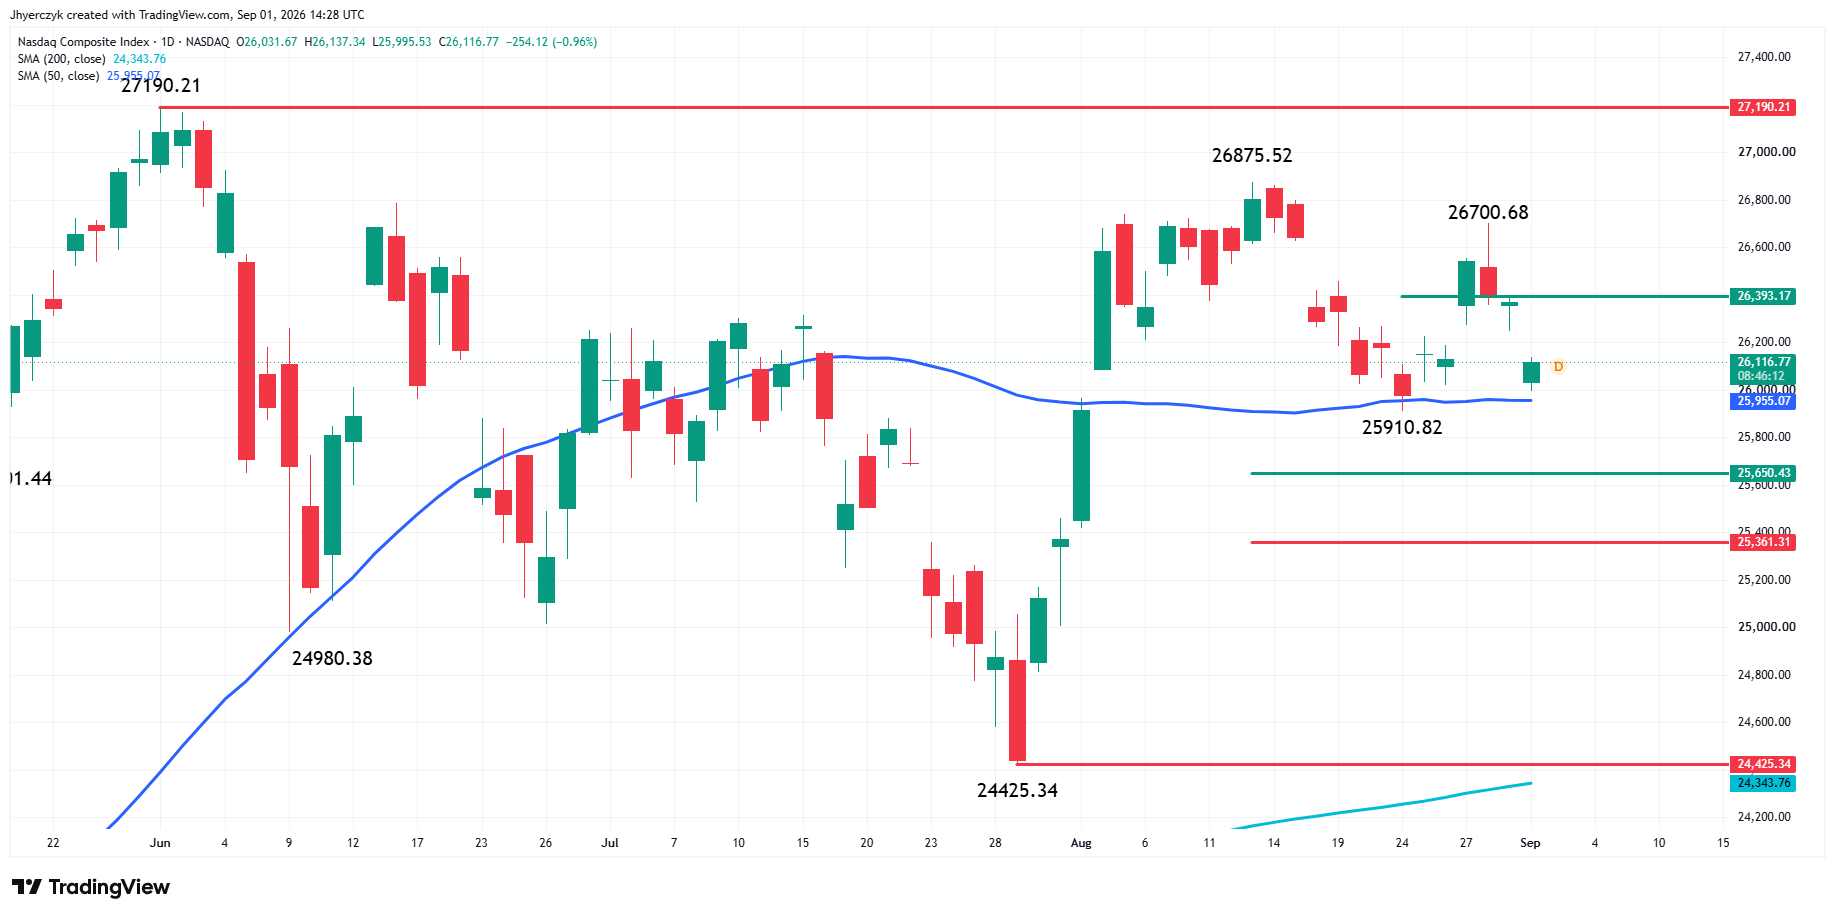
The Nasdaq Composite Index is down sharply Tuesday, closing in on the 50-day moving average at 25,955.33 and the recent swing bottom at 25,910.82.
The current chart pattern is bearish after the formation of two secondary lower tops at 26,700.68 and 26,875.52. This could lead to an acceleration to the downside under 25,910.82, with the intermediate retracement zone at 25,650.43 to 25,361.31 the primary downside target.
Dow Jones Price Forecast
Every new Dow Jones analysis as it publishes, today's technical signal and key levels, live price — on one page.
See all Dow Jones forecastsDaily Dow Jones (DJI) Technical Analysis
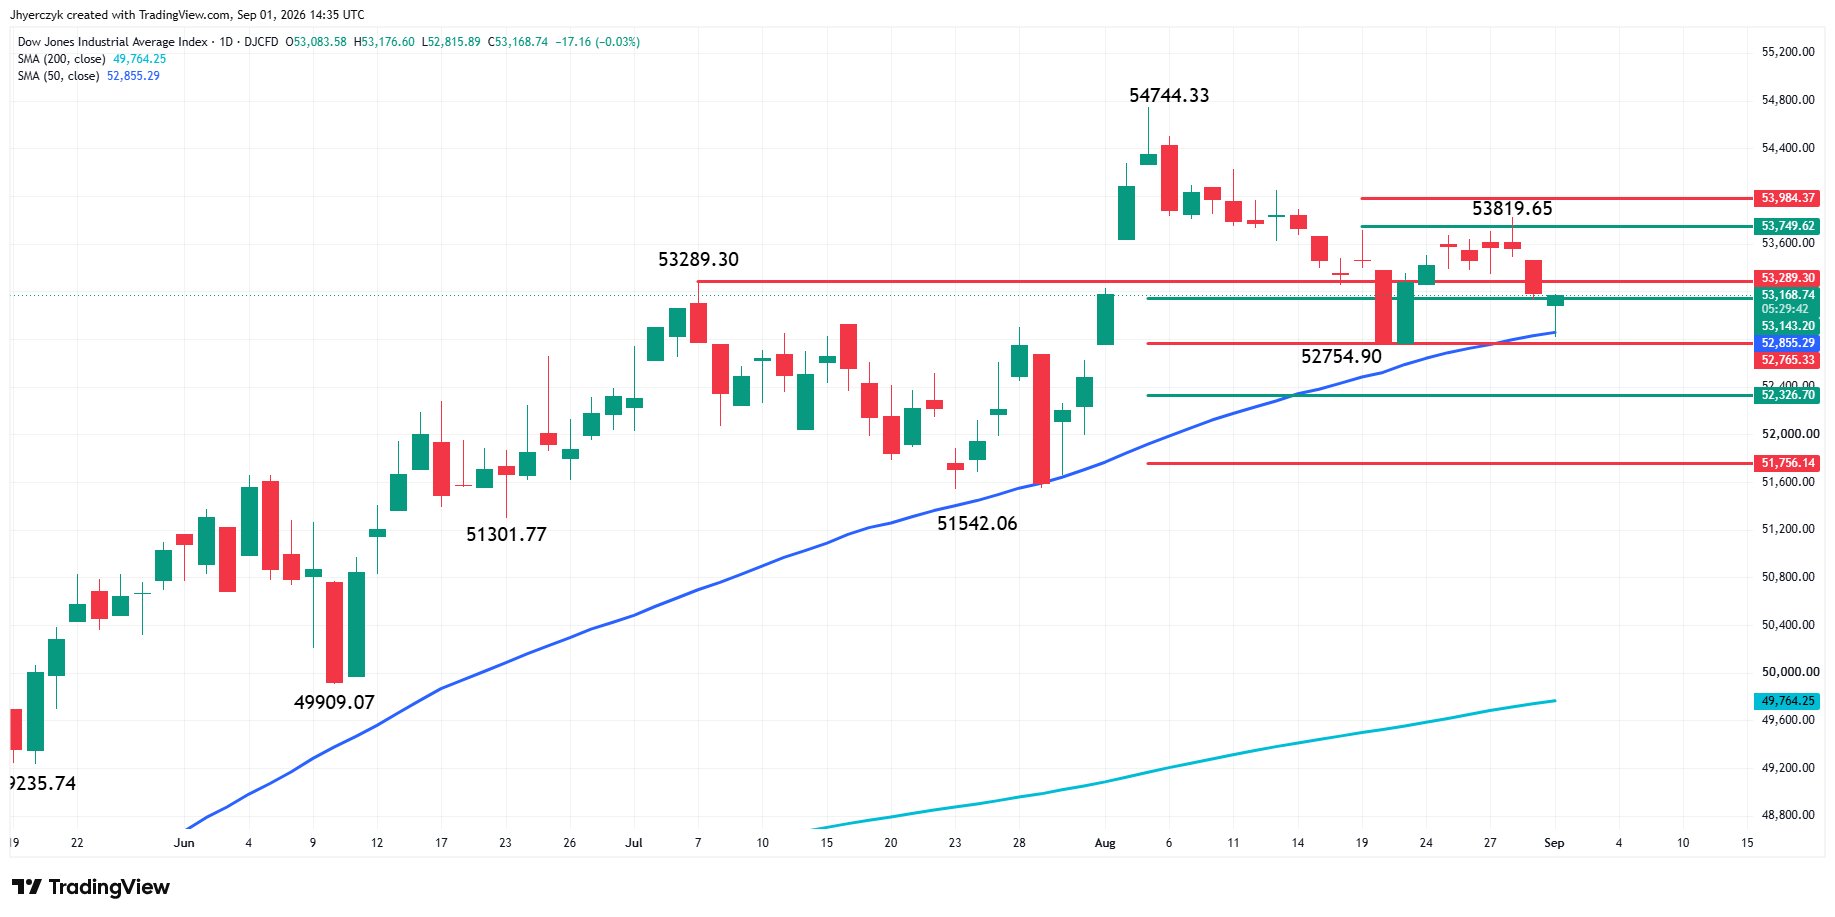
The Dow Jones Industrial Average is lower Tuesday after clawing back from a more than 300-point loss earlier in the session. The blue-chip average is rebounding after briefly piercing the 50-day moving average at 52,854.62.
The Dow is currently testing the first layer of resistance at 53,143.20 and 53,289.30. Overcoming these levels could put the market in a position to extend the gains.
If the selling resumes and is strong enough to take out the recent swing bottom at 52,754.90, it could trigger an acceleration to the downside, with the intermediate retracement zone at 52,326.70 to 51,756.14 the primary downside target area.
Bond Markets Are Selling From Tokyo to London
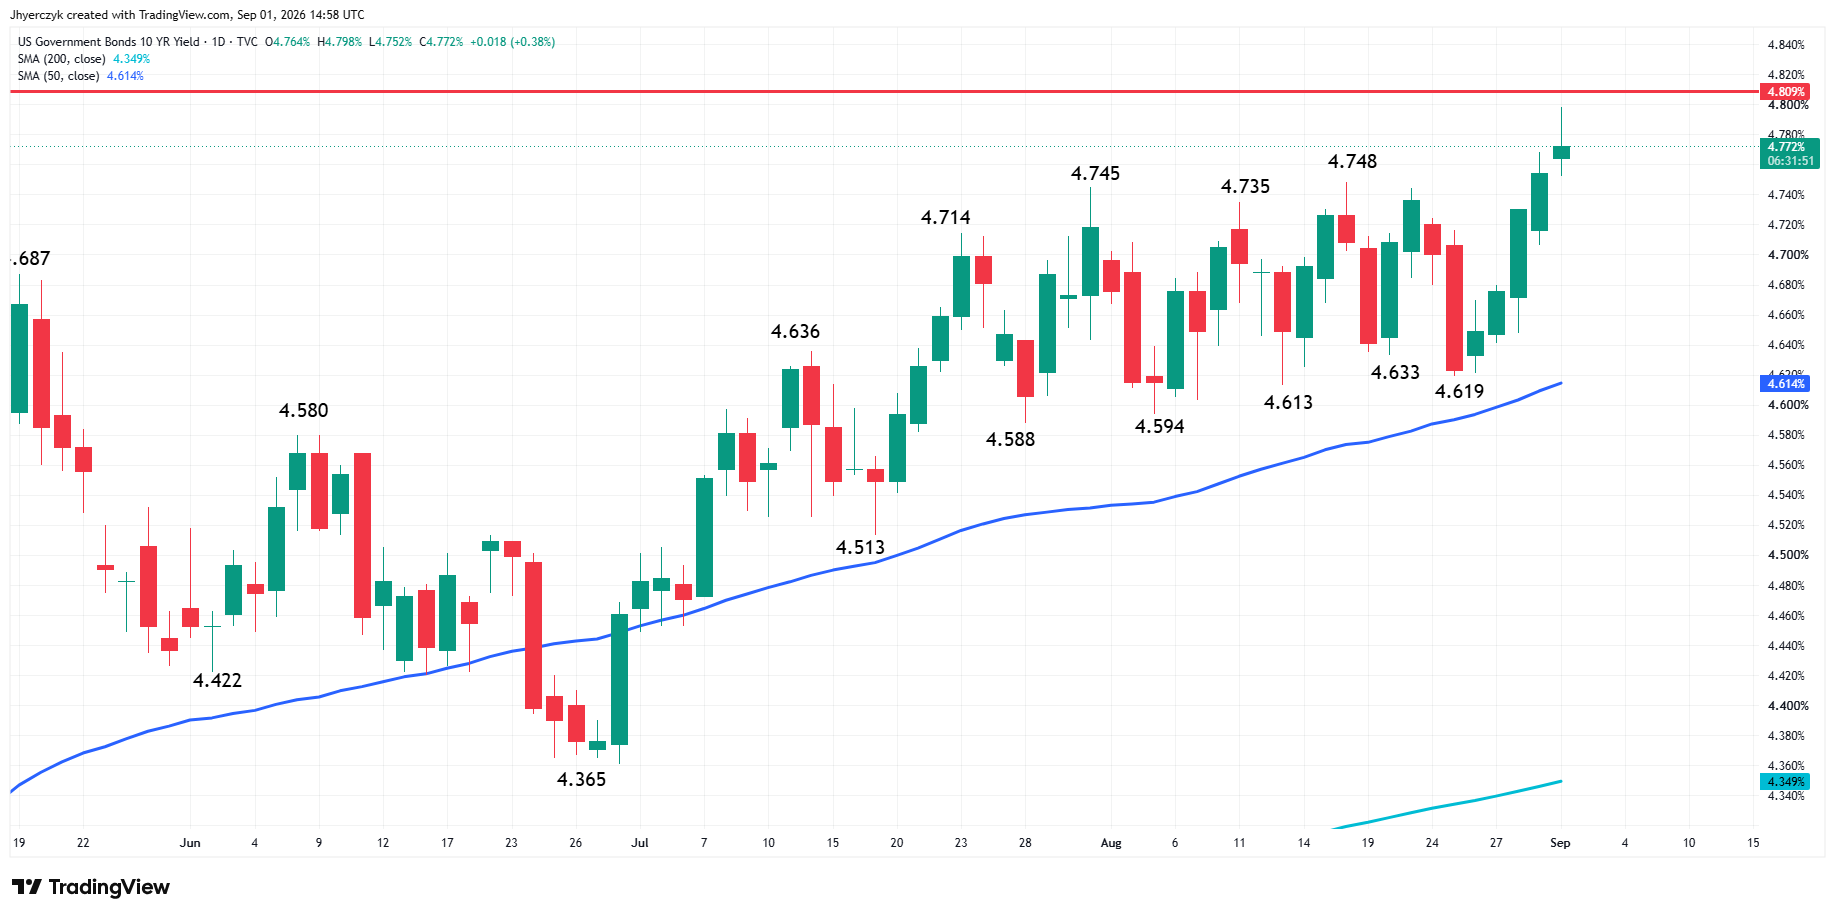
The U.S. 10-year climbed to 4.788%, a 20-month high. The 2-year is near 4.365%. The 30-year remains above 5.2%. That alone would be enough to pressure equities. Tuesday it is not alone.
Japan’s 10-year government bond yield crossed 3% for the first time in three decades. The 2-year hit a 31-year high near 1.81%. The yen has moved back through 160 per dollar for the third straight session and the Bank of Japan is running out of room to stay patient with a weaker currency, higher oil costs and domestic yields all climbing at the same time.
U.K. 10-year gilt yields jumped to 5.25%, the highest since the financial crisis. The 30-year gilt reached 5.89%, a level not seen since 1998. Euro area August inflation rose to 3.3% from 2.9% in July. Energy inflation accelerated to 14.3%. The market is nearly fully pricing a European Central Bank rate increase this month.
Warsh started this at Jackson Hole. The bond market turned it into something bigger. Yields are rising in the United States, Japan, the United Kingdom and Europe at the same time. The stock market is dealing with all four as one trade.
Oil Keeps Feeding the Inflation Side
WTI is up about 3% above $88 per barrel Tuesday. Brent is higher by more than 2% near $92. The U.S. and Iran are back to direct military action. A tanker was hit by projectiles in the Strait of Hormuz. President Trump threatened a hard response to Iran’s latest attacks on U.S. military bases. The shipping route is still running at a fraction of normal traffic.
Crude above $88 WTI and near $92 Brent goes straight into the same inflation argument the bond market is already trading. Warsh said at Jackson Hole that inflation has not improved enough. Oil is not giving the Fed any reason to disagree with that read. The equity market can handle high oil or high yields for a stretch. Tuesday morning it is getting both.
The AI Trade Is Not Providing Cover
Nvidia, AMD and Micron are all lower by around 2%. Microsoft and Alphabet have lost more than 1%. The names that carried the Nasdaq through August are absorbing the rate hit first Tuesday because they have the most expensive valuations to defend.
The Dow is holding up better because it has less direct exposure to the semiconductor group. The Dow bounced off its 50-day moving average after being down more than 300 points earlier. That does not make the blue-chip index strong. It means the Nasdaq is taking a bigger share of the global yield trade.
What to Watch
The jobs data decides whether the global yield trade keeps running into the Fed meeting. JOLTS lands next. ADP follows Wednesday. Friday’s nonfarm payrolls report is the number that can either keep September hike odds elevated or force the bond market to pull back. Oil above $88 WTI and near $92 Brent is not going away while the Strait of Hormuz is still disrupted. The technology trade needs yields to stop making new highs. It does not need a major bond rally. It needs the 10-year to stall.
The S&P 500 main trend changed to down Tuesday after taking out 7,639.01. The former record high at 7,620.90 is the next level. Losing that means the late-summer gains are gone. The Nasdaq is closing in on its 50-day at 25,955.33 with two secondary lower tops already on the chart. The Dow bounced off its 50-day at 52,854.62 Tuesday morning. All three indices are leaning the same direction. The bond market from Tokyo to London is telling them why.
More Information in our Economic Calendar.