
Oil News: Demand Cuts Clash With Murky Hormuz Supply Flows
Oil prices on August 13 are being affected by the worsening demand outlook as the Middle Eastern supply is difficult to measure. The IEA is forecasting a 1.6 million barrel per day contraction in global oil demand in 2026 versus the earlier outlook. OPEC has revised down its oil demand growth outlook to 580,000 bpd. The IEA is forecasting a drop of 4.3 million bpd in global oil supply this year, net oil market deficit with continued disruptions in the Hormuz Strait.
The physical supply is unusually opaque. Tanker movements of Saudi Arabian crude along the Red Sea are moving without AIS. Saudi Arabia has increased its crude shipments through the Suez Canal and Egypt’s SUMED pipeline. With tanker movements going dark, estimates of actual Middle Eastern supply are very broad, posing a challenge for both OPEC and IEA supply assessments.
The U.S. data added a bearish weight to the market view. During the week ending August 7, commercial crude oil stocks in the U.S. increased by 17.4 million barrels to 424.4 million barrels, posting the largest weekly increase since January 2023. Exports of crude oil dropped and imports of crude oil increased.
Natural gas supplies in the U.S. are ample. The EIA is estimating record high average natural gas production of 122.5 Bcf/d in 2026, combined with a forecast average of 17.4 Bcf/d of LNG exports, as compared to average exports of LNG in 2025 of 15.1 Bcf/d. Third quarter average exports of LNG are expected to be around 16.5 Bcf/d with continued disruptions in Hormuz, keeping global gas markets tight.
The energy climate is now highly fragmented. Bearish factors, such as decreasing oil demand and growing oil inventories in the US, are in opposition to constrained LNG shipping and uncertain exports out of the Gulf, which have created geopolitical supply risk.
Natural Gas Technical Analysis: NG Tests $2.80 Resistance After Reclaiming Both EMAs
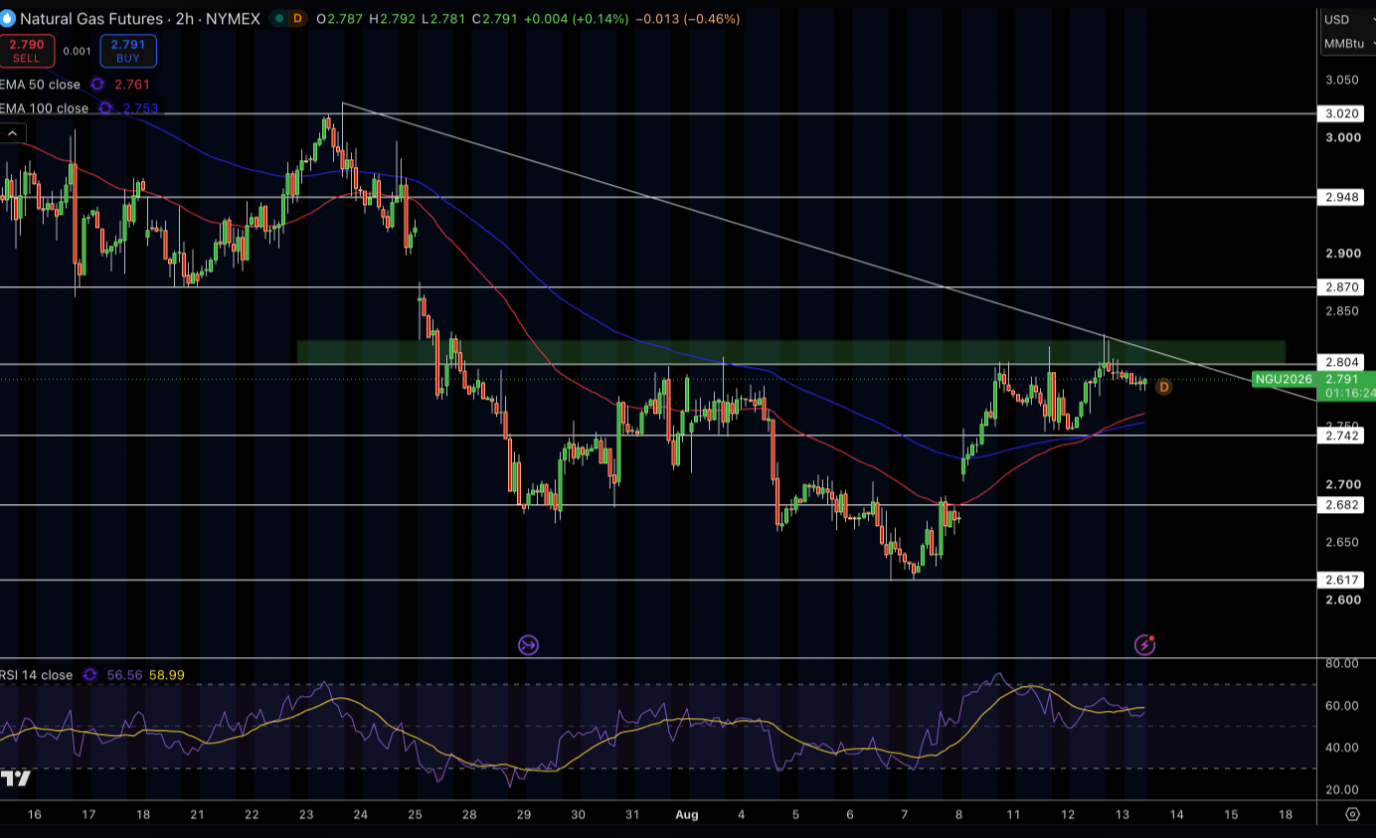
Natural gas is currently trading around $2.79 on the 2 hour chart after bouncing up from the support level $2.62 to $2.66. Price is now above the 50-EMA priced at $2.76 and the 100-EMA priced at $2.75. Buyers are keeping some pressure on the market but are reluctant to push for a breakout and nor have they made one. The previous pattern of descending trend lines has also been broken and should be viewed as an improvement in market structure as well.
RSI is at a level of about 57, not signalling any overbought territory, but instead showing some reasonable bullish sentiment. Resistance lines currently sit at $2.80, $2.87, and $2.95. $2.74, $2.68, and $2.62 form the support level.
In my opinion, closing a breakout above $2.80 should signal that the buy side commitment is there with a target of $2.87, but closing a $2.74 support break indicates that the buy side commitment is failing.
Natural Gas Price Forecast
Every new Natural Gas analysis as it publishes, today's technical signal and key levels, live price — on one page.
See all Natural Gas forecastsWTI Crude Oil Technical Analysis: WTI Holds Above $81.60 as Buyers Target $84.74
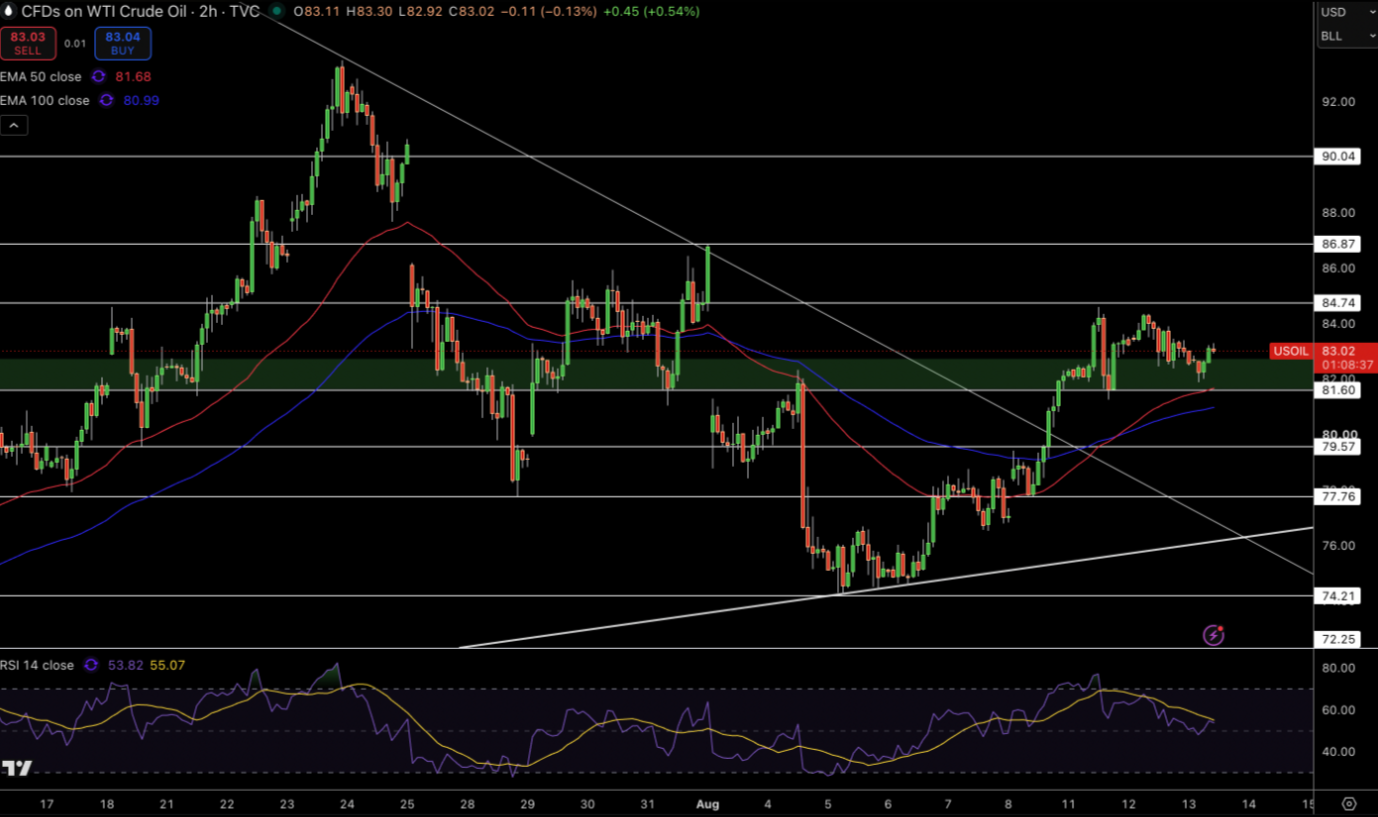
WTI crude oil is currently at $83.02 on the 2-hour chart after a strong bounce up from the $74.21 region. Current price action is above the previous falling trendline. The 50-EMA is at $81.68 and the 100-EMA is at $80.99, and price is comfortably above both of the moving averages. Recent price action has formed smaller candles around $83.00, and this indicates that price action has momentum that is pausing.
RSI is at 54 and is in a neutral zone with no overbought pressure. The price action that is above $83.00 has resistance that is at $84.74, with additional resistance at $86.87 and $90.04. Price action that is below $83.00 has support that is at $81.60 with additional support at $79.57 and $77.76.
In my opinion, as long as price action stays above $81.60, this recovery will stay intact, and a confirmed 2-hour close above $84.74 will target $86.87. A break of the $81.60 support will invalidate the recovery.
Brent Crude Oil Technical Analysis: Brent Consolidates Below $91.13 After Trendline Breakout
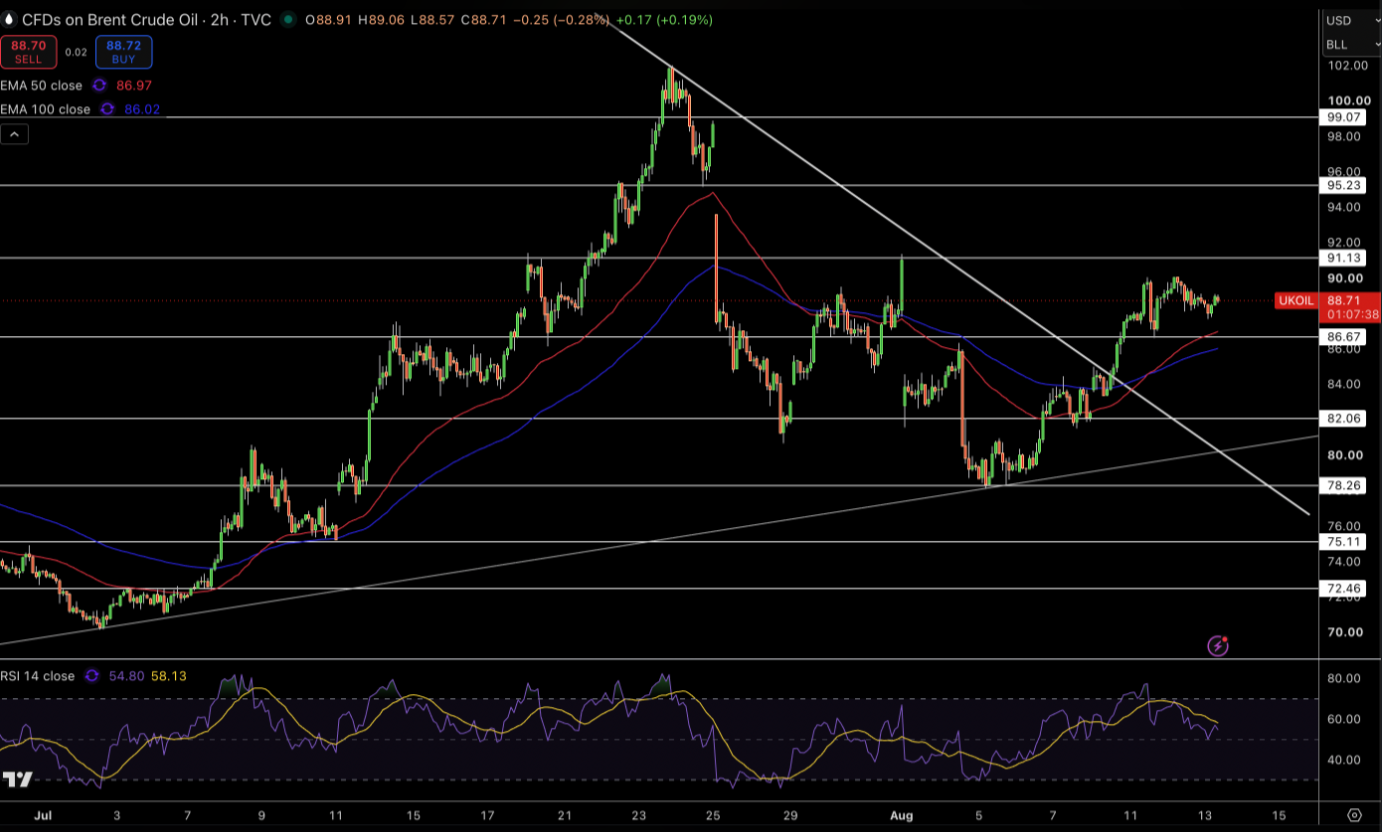
Brent crude is trading around $88.71 continuing to trade above the descending trendline that was controlling the break from the July highs. Price action is above the 50-EMA at $86.97 and the 100-EMA at $86.02, which shows that the short-term recovery has improved, and the short-term tech structure has been better. Price action has developed smaller candles below $90.00 and this indicates consolidation and not a bearish reversal.
RSI is at 55, and price action has formed a consolidation with support at $86.67 and lower support at $82.06 and $78.26.
Currently, the stratum would have me eye $86.67 as the vital bullish invalidation area; if price is above it, then we’re not out of the woods for a possible $91.13 run. A breakout above that level would then target $95.23.