



The strengthening dollar, making oil more costly for foreign currency holders, could impact oil and natural gas forecasts by reducing demand. These developments present a complex backdrop for energy markets, balancing geopolitical ease against economic pressures.
Natural Gas Price Forecast

On March 22, Natural Gas (NG) witnessed a modest increase, climbing by 0.30% to $1.8330. This uptick positions NG slightly above its pivot point of $1.8272, signaling potential for further upward movement. Resistance levels are identified at $1.9013, $1.9408, and $2.0067, with support found at lower thresholds of $1.7842, $1.7377, and $1.6795.
The 50-Day Exponential Moving Average (EMA) at $1.8284 closely aligns with the current price, whereas the 200-Day EMA at $1.9092 sets a higher benchmark for bullish momentum.
Given these dynamics, NG’s market outlook is bullish above the pivot point of $1.8272, yet a drop below this critical level could precipitate a significant selling trend.
WTI Oil Price Forecast
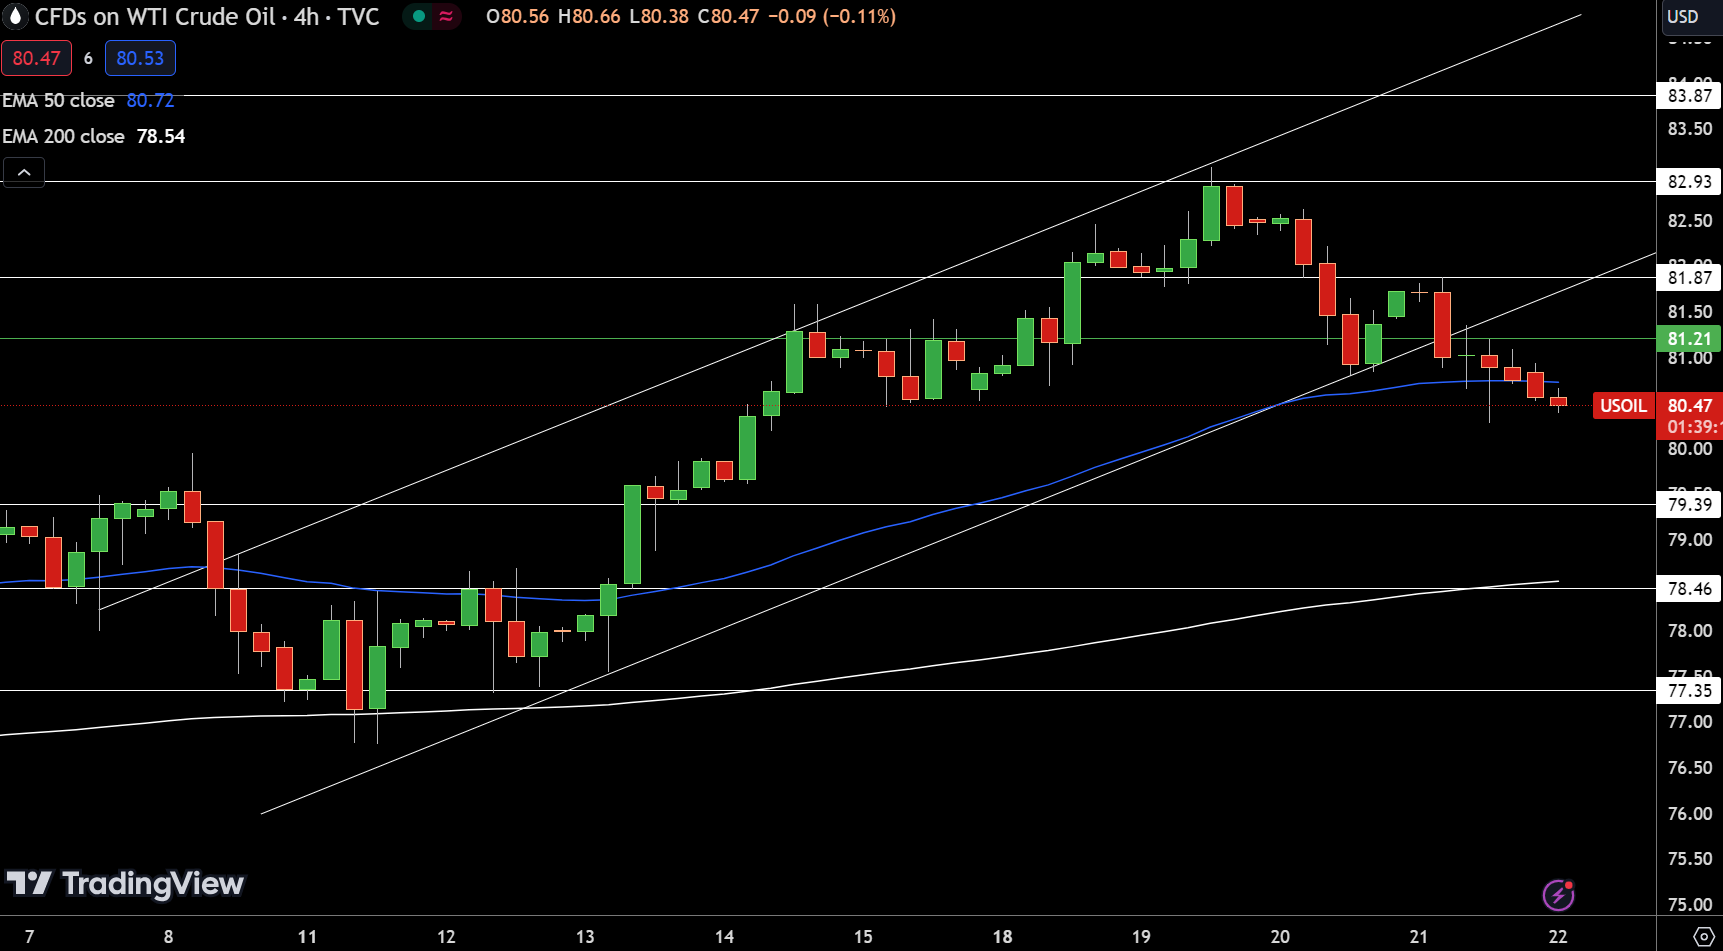
The overall market sentiment for USOIL is bearish below $81.21, but surpassing this level could indicate a shift towards a more bullish outlook.
Brent Oil Price Forecast
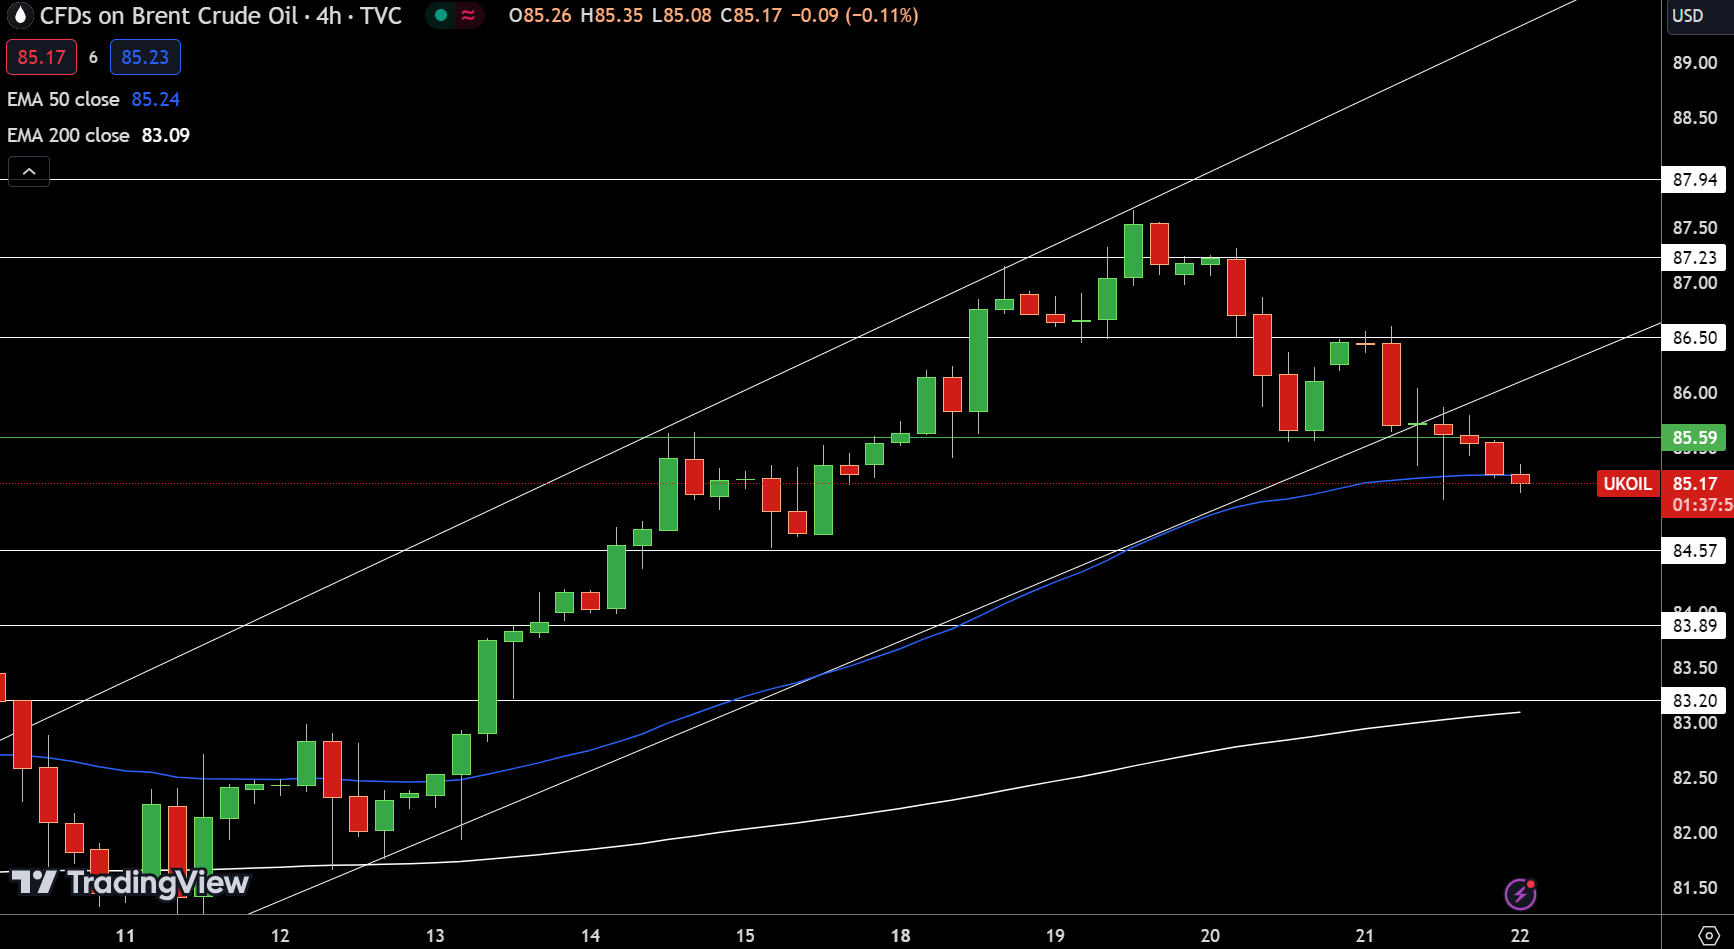
The 50-Day Exponential Moving Average (EMA) at $85.24 and the 200-Day EMA at $83.09 provide critical insights into the market’s direction, hinting at a bearish sentiment below the pivot point of $85.59. However, surpassing this threshold could imply a shift to a more bullish outlook.
For a look at all of today’s economic events, check out our economic calendar.


