
Oil News: Hormuz Talks Ease Supply Risk as Diesel Stocks Tighten
Developments around the Strait of Hormuz have eased fears of a prolonged disruption. The signing of a revenue sharing and management agreement by Iran and Oman, and the visit of the Prime Minister of Qatar to Iran for further talks, are steps to resolve the almost six month standoff. Hormuzaccounts for about one fifth of global consumption of oil and gas when at its normal capacity. However, the current flows represent less than a quarter of pre-war levels. There has been a slight increase in shipments from the previous low with visible commodity vessel shipments standing at 10 on Wednesday, compared to 8 on Tuesday. This is lower than the recent 10 day average of 15.
Data for petroleum products from the US provides mixed signals for inventory levels for the week ended August 21. The EIA reported a slight increase of 100,000 barrels in commercial crude stocks to a level of 428.9 million barrels. This is approximately 1 percent above the recent average. Gasoline inventories decreased by 2.5 million barrels during the week, while distillate stocks fell by another 2.2 million barrels to 103.4 million, or 14 percent of the average of recent years. Total demand for petroleum products for the previous four week period was 3 percent less than demand recorded during the corresponding period the previous year.
Depleted diesel pools continue to drive U.S. crude and Brent fundamentals. Middle East refinery damage, combined with Ukrainian attacks on Russian refining capacity, have reduced global supply of distillates whilst the crude market is less concerned.
Domestic natural gas is less restricted. The latest EIA outlook shows record U.S. production and pre-winter storage levels, while average LNG exports for the third quarter are expected to be around 16.5 Bcf/d. Freeport LNG’s maintenance has lessened demand for feedgas and allowed storage in the Gulf Coast to be rebuilt. The EIA’s natural-gas storage report, which is due today and thus time of writing still has not been released, means we currently do not know what the inventory figure for August 27 is.
For August 27, the current outlook for energy is less bullish for crude supply, but remains tight for refined fuels and global LNG.

Natural Gas Technical Analysis: NG Breaks Higher as Former Resistance Turns Into Support
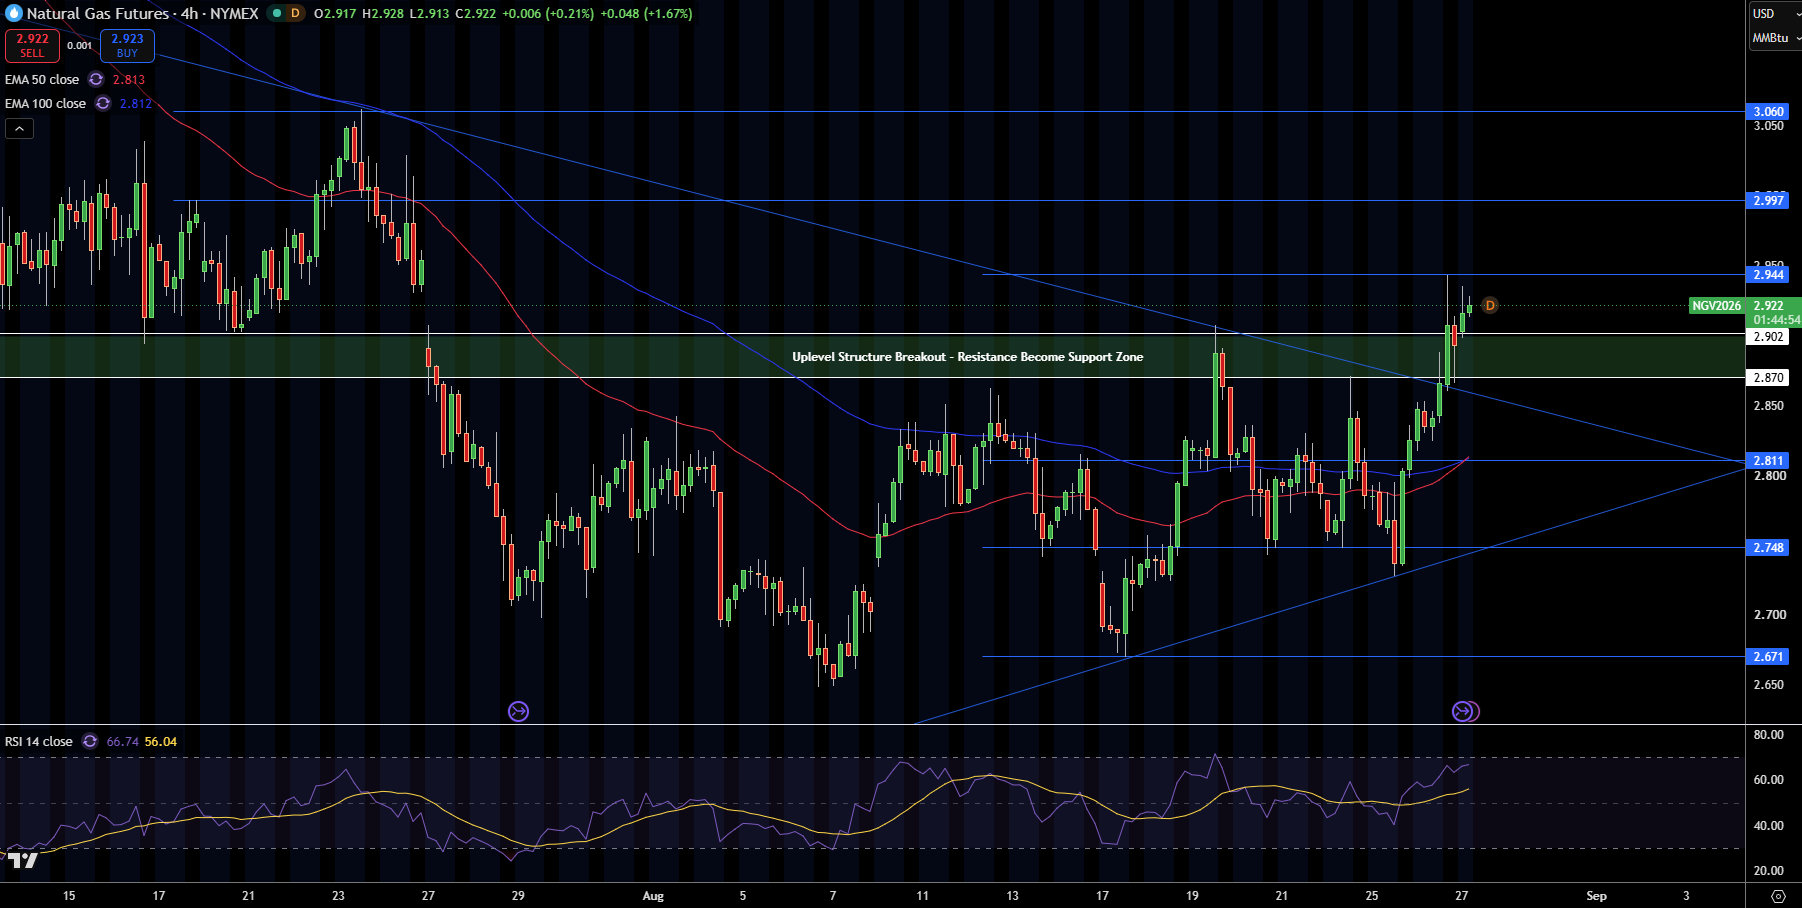
Natural gas currently trades at $2.92 on the 4-hour chart after moving decisively above the declining trend line and the previous resistance zone of $2.87-$2.90. This breakout has positively affected the short-term structure as price trades well above the 50 EMA at $2.81 and the 100 EMA at $2.81. The previous resistance zone of $2.87-$2.90 has now been breached and is likely a support area, which is bullish.
RSI is at 67, showing strong bullish momentum, but also showing that price may be extending beyond what is reasonable. Immediate resistance is at $2.94 with overhead priceieu at $3.00 and $3.06. In the event natural gas moves lower, support is expected at $2.90-$2.87 with additional support at $2.81 and $2.75.
For a trade on natural gas, I believe the bias has shifted to the bulls from $2.87-$2.90. A break above $2.94 could lead to gains and extend to $3.00 and $3.06. A break below $2.87 would lead to a lower price to the $2.81 area.
Natural Gas Price Forecast
Every new Natural Gas analysis as it publishes, today's technical signal and key levels, live price — on one page.
See all Natural Gas forecastsWTI Crude Oil Technical Analysis: WTI Holds $80.05 Support but Structure Remains Fragile
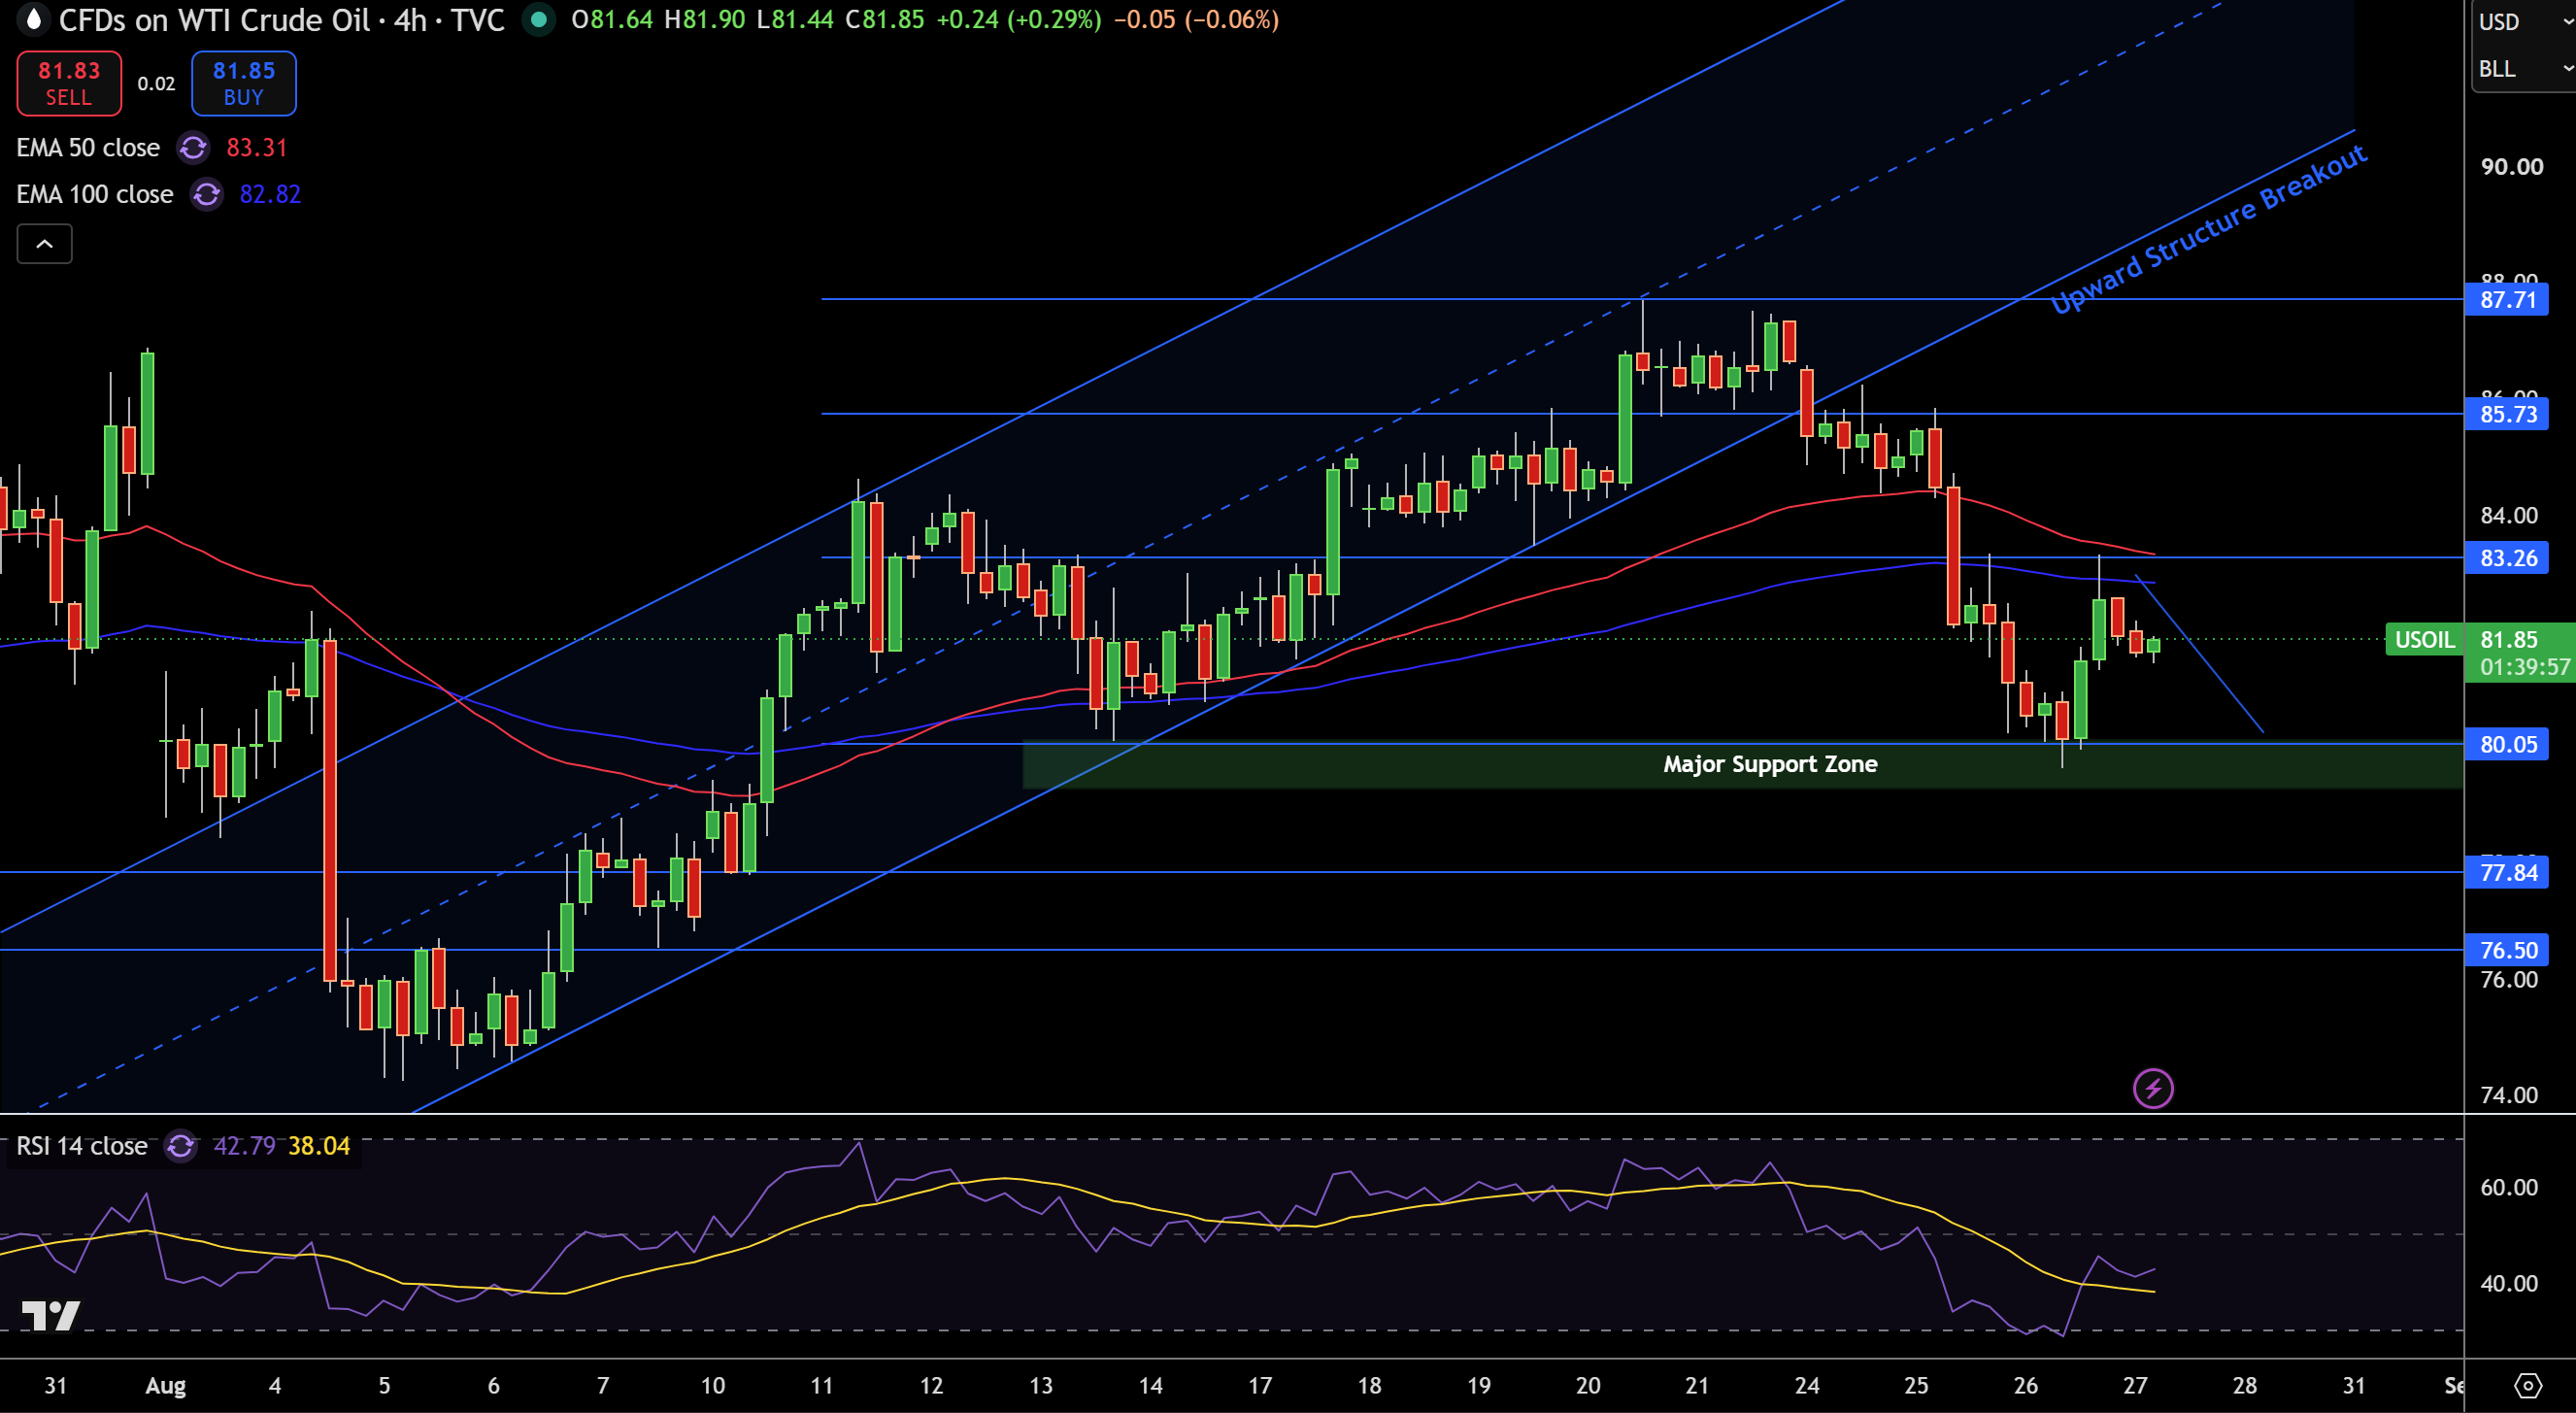
WTI is around $81.85 on the 4-hour chart after rebounding from the $80.05 significant support zone. Price is underneath the 50-EMA at $83.31 and the 100-EMA at $82.82, which also contributes to the cautious short-term outlook. The previous uptrend channels have been broken, and the recent bounce has not even returned to previously defined levels. Buyers lack strong evidence.
RSI is at 43 which shows that there is some improvement in price compared to the oversold levels, but is still trending downwards and below neutral levels. Immediate resistance is around $83.26, $85.73 and $87.71. The key support levels are $80.05, $77.84 and $76.50.
In my opinion, WTI is still trading in a vulnerable position while underneath $83.26. A cleanish recovery above would bring $85.73 into focus, but if $80.05 breaks, bearish structure would be validated and $77.84 would be in play.
Brent Crude Oil Technical Analysis: Brent Attempts Recovery From $84.50 but Remains Below Key EMAs
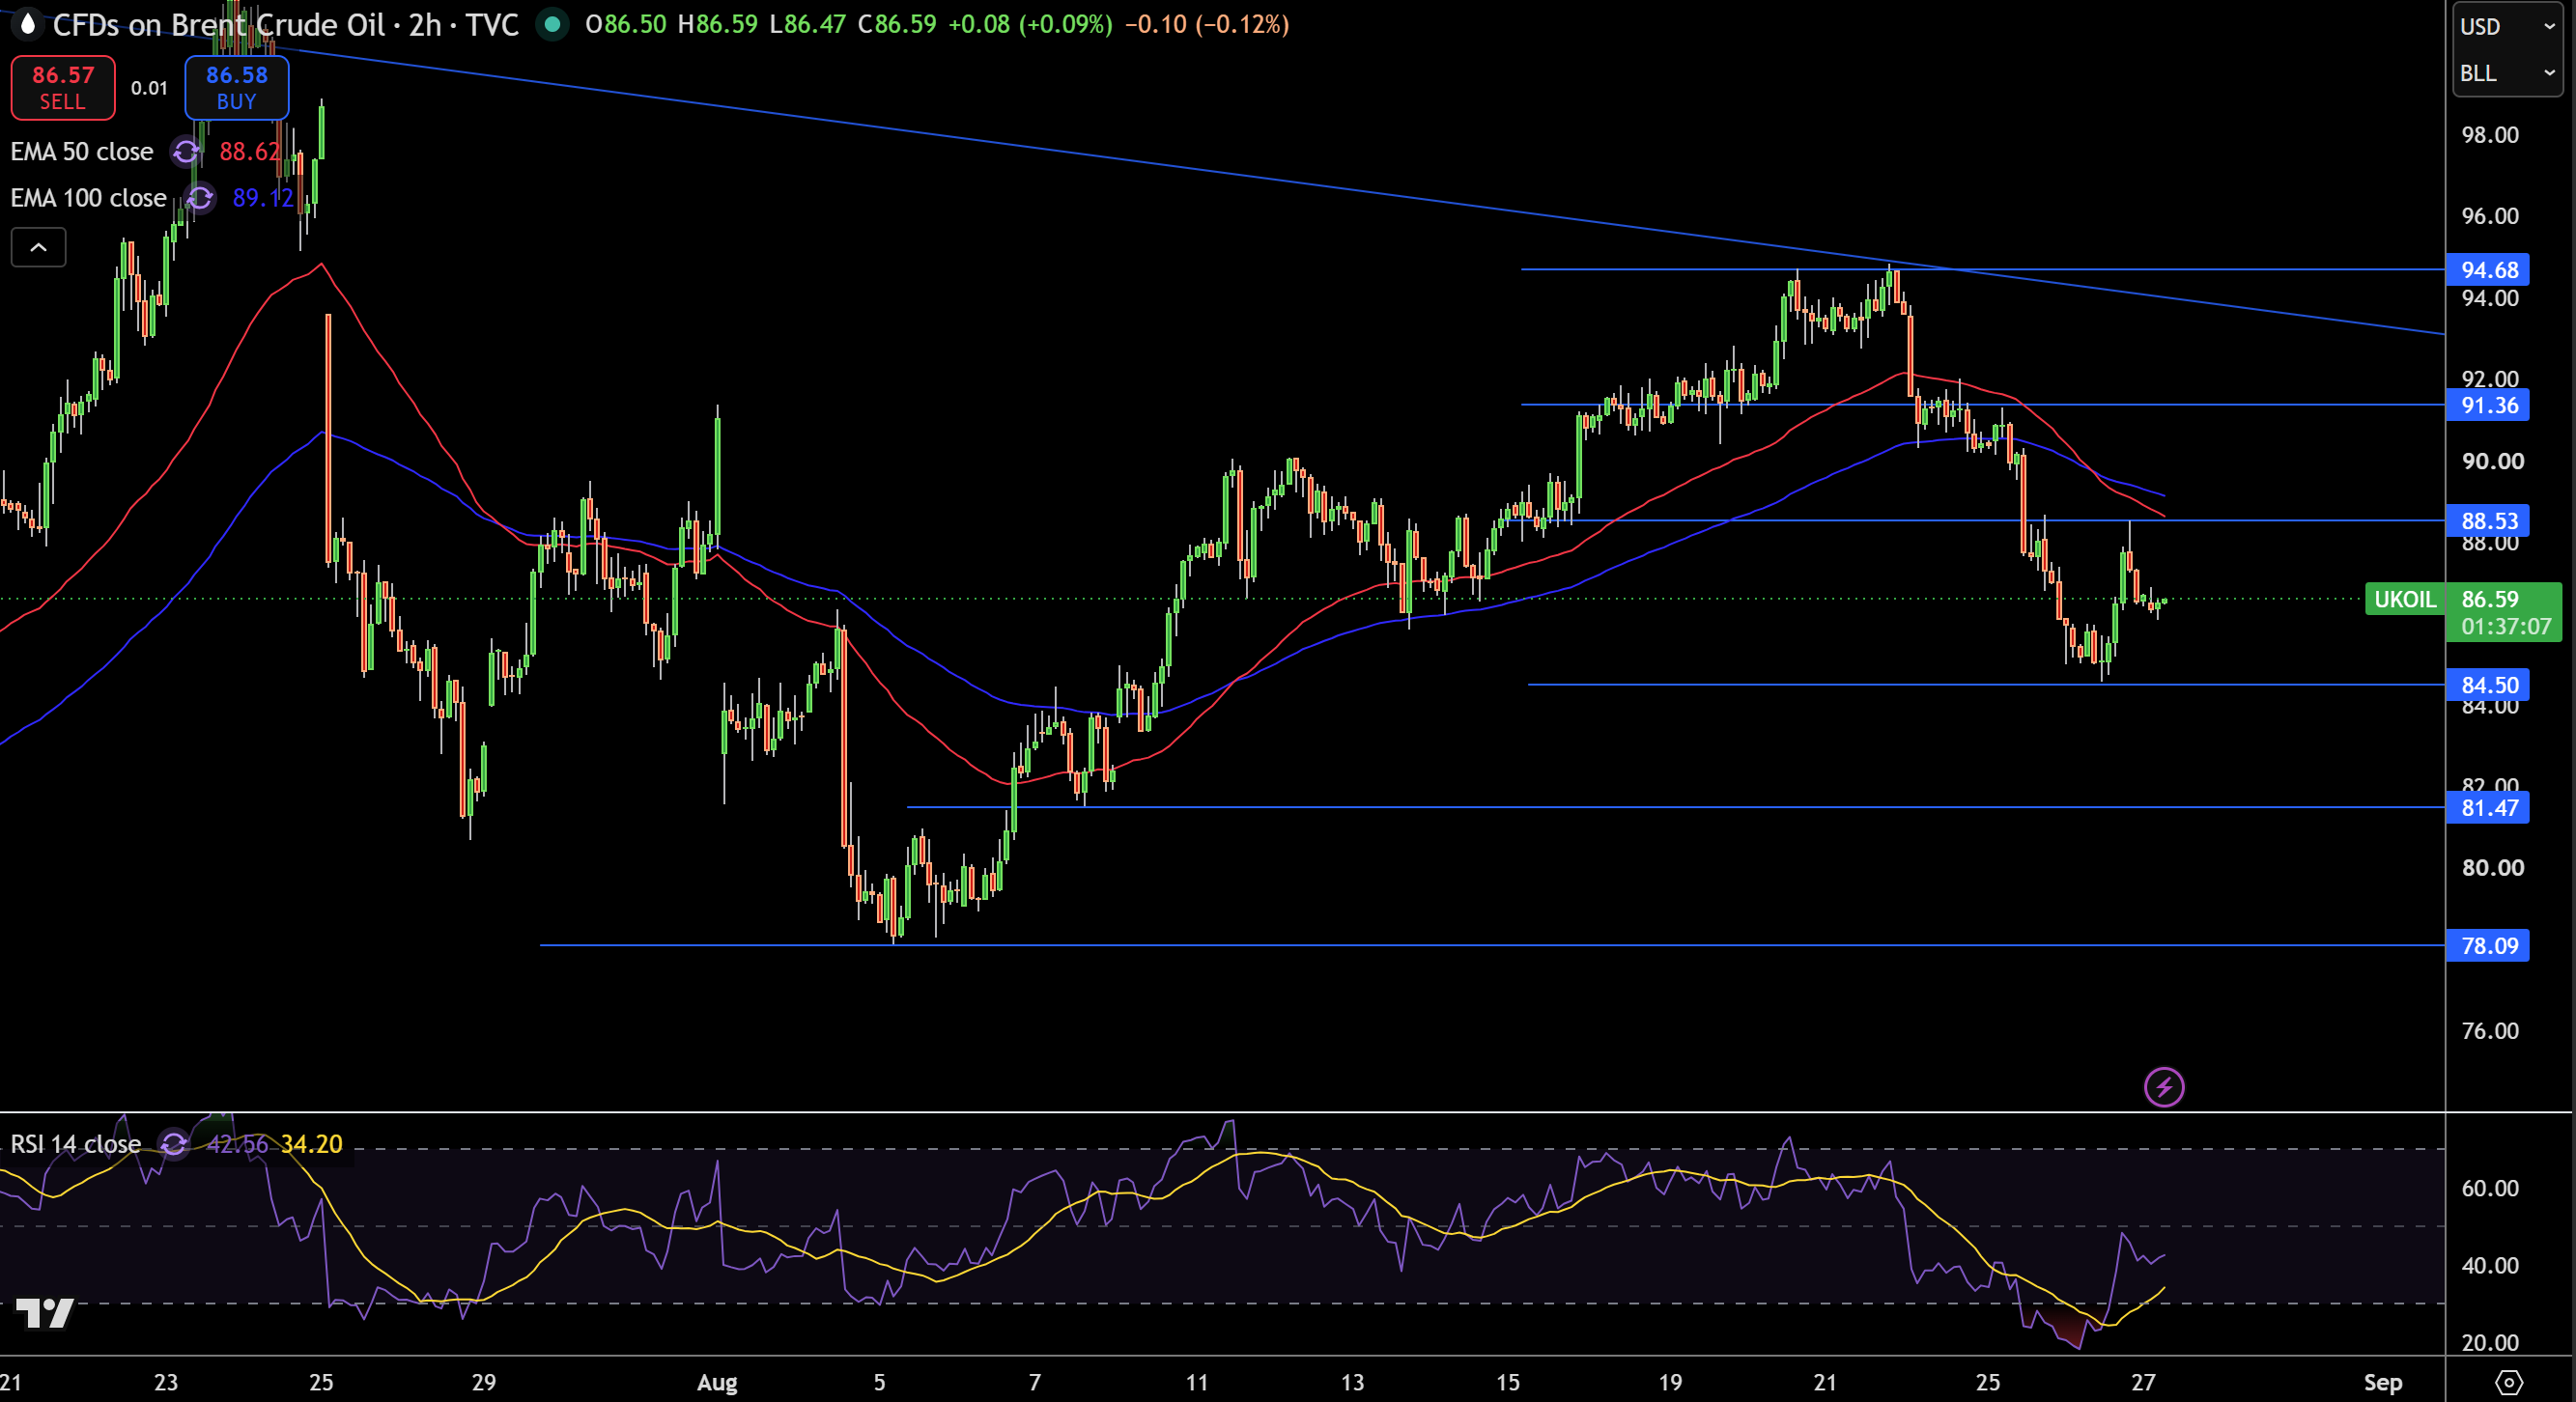
Brent crude is around $86.59 on the 2-hour chart after rebounding from the $84.50 support zone. While the recovery looks positive, price is still below the 50-EMA at $88.64 and the 100-EMA at $89.12. Consequently, the short-term trend is still to the downside. Above price is the broader bearish trendline which also impacts potential resistance and support levels.
This is a guest post by Editor, Sir Mufflington who manages research and rewrites in the core content team
RSI has reached 43, reflecting that price has recovered from oversold conditions, but has not yet transitioned to become bullish. Resistance lies at $88.53 and is followed by $91.36 and $94.68. Price Support resides at $84.50 and is followed by $81.47 and $78.09. Support will be tested first.
Price action below $88.53 to $89.12 maintains a bearish outlook on Brent. A break above the range would be constructive, while the range would act as resistance. Price action below the range would be bearish, targeting $81.47. A break of $84.50 would be constructive.