



The potential for a ceasefire between Israel and Hamas, which would allay worries about Middle East oil supply disruptions, and an unexpected increase in U.S. crude inventories added to this.
Impact on Oil and Natural Gas:
- Strategic Reserve Purchases: The U.S. plans to buy back oil for the Strategic Petroleum Reserve at $79 per barrel or lower, supporting oil prices.
- Geopolitical Developments: The possible ceasefire in the Middle East could reduce geopolitical risks that typically support higher oil prices.
- Market Dynamics: Despite the Fed’s rate decision suggesting slower economic growth, continued production cuts by OPEC+ are expected to bolster oil prices. However, if oil prices rise significantly, OPEC+ may ease these cuts, potentially capping gains.
This situation presents a complex scenario where various factors, such as strategic reserves, geopolitical developments, and OPEC+ policies, interplay to influence the oil and natural gas markets.
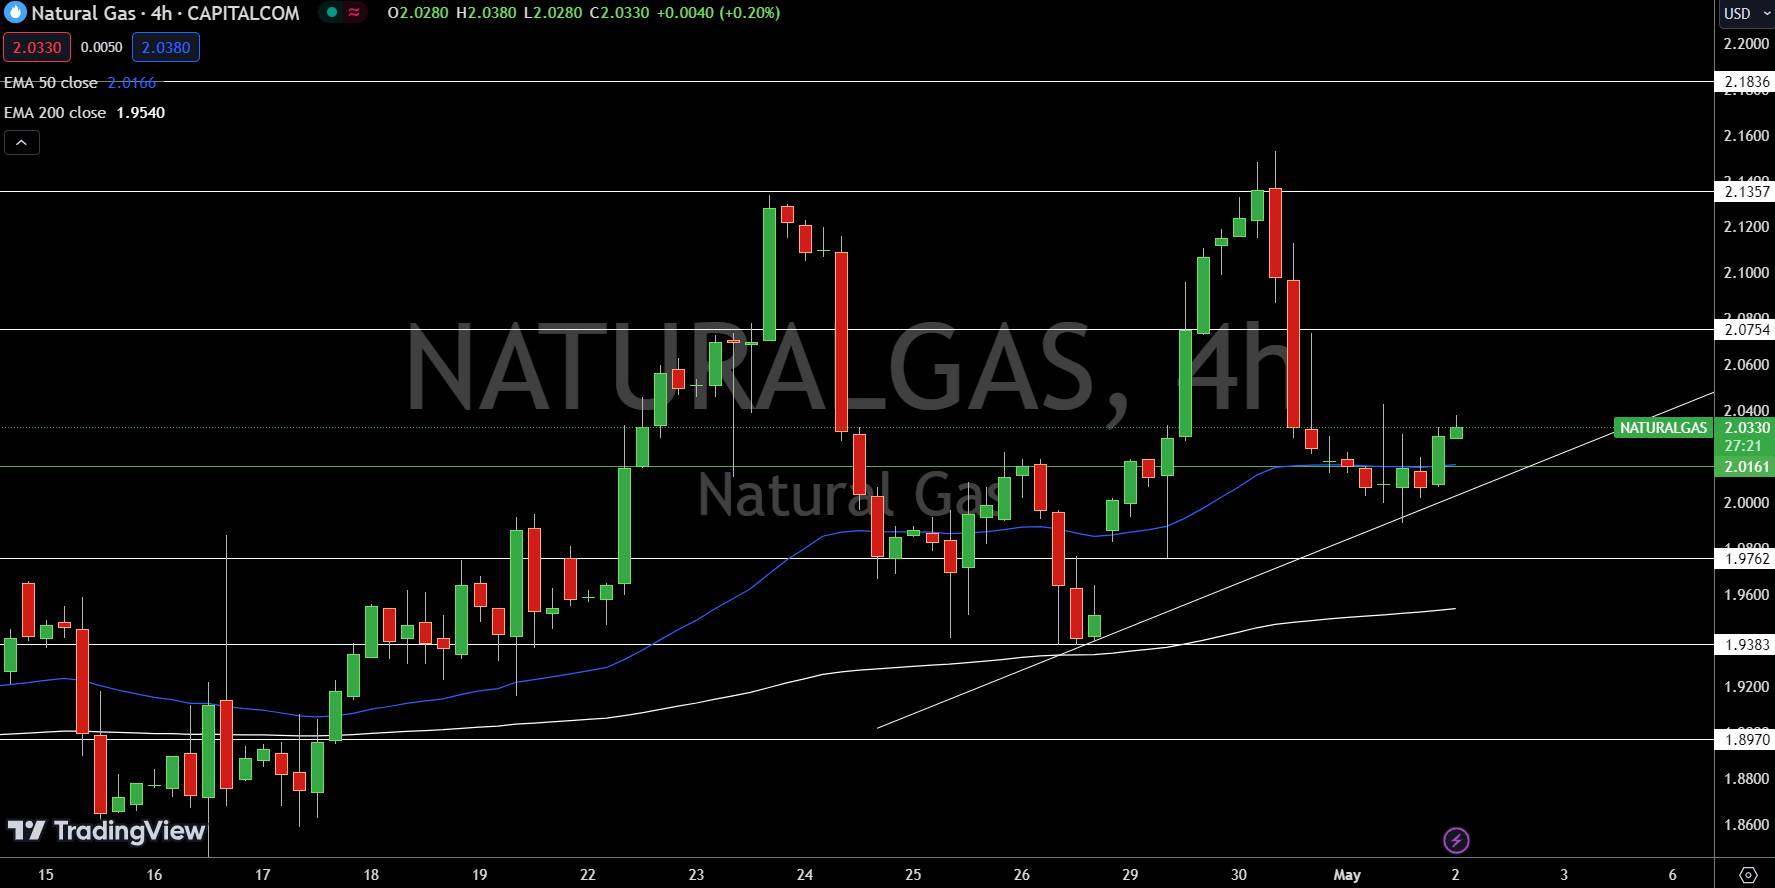
Today’s technical analysis for Natural Gas (NG) on May 2, 2024, shows the commodity trading at $2.02, up by 1.30%. It hovers just above the pivot point of $2.01, indicating a potential for bullish momentum if it remains above this mark. Resistance levels are set at $2.07, $2.13, and $2.18, which need to be breached to sustain an upward trend.
On the flip side, support is found at $1.97, $1.93, and $1.89; falling below these could lead to a significant sell-off. The 50-Day Exponential Moving Average (EMA) sits at $1.97, emphasizing this key support level, while the 200-Day EMA at $2.45 suggests a longer-term resistance.
Overall, Natural Gas appears poised for further gains provided it stays above $2.01, but caution is advised as shifts below this threshold could alter the market’s direction.
WTI Oil Price Forecast
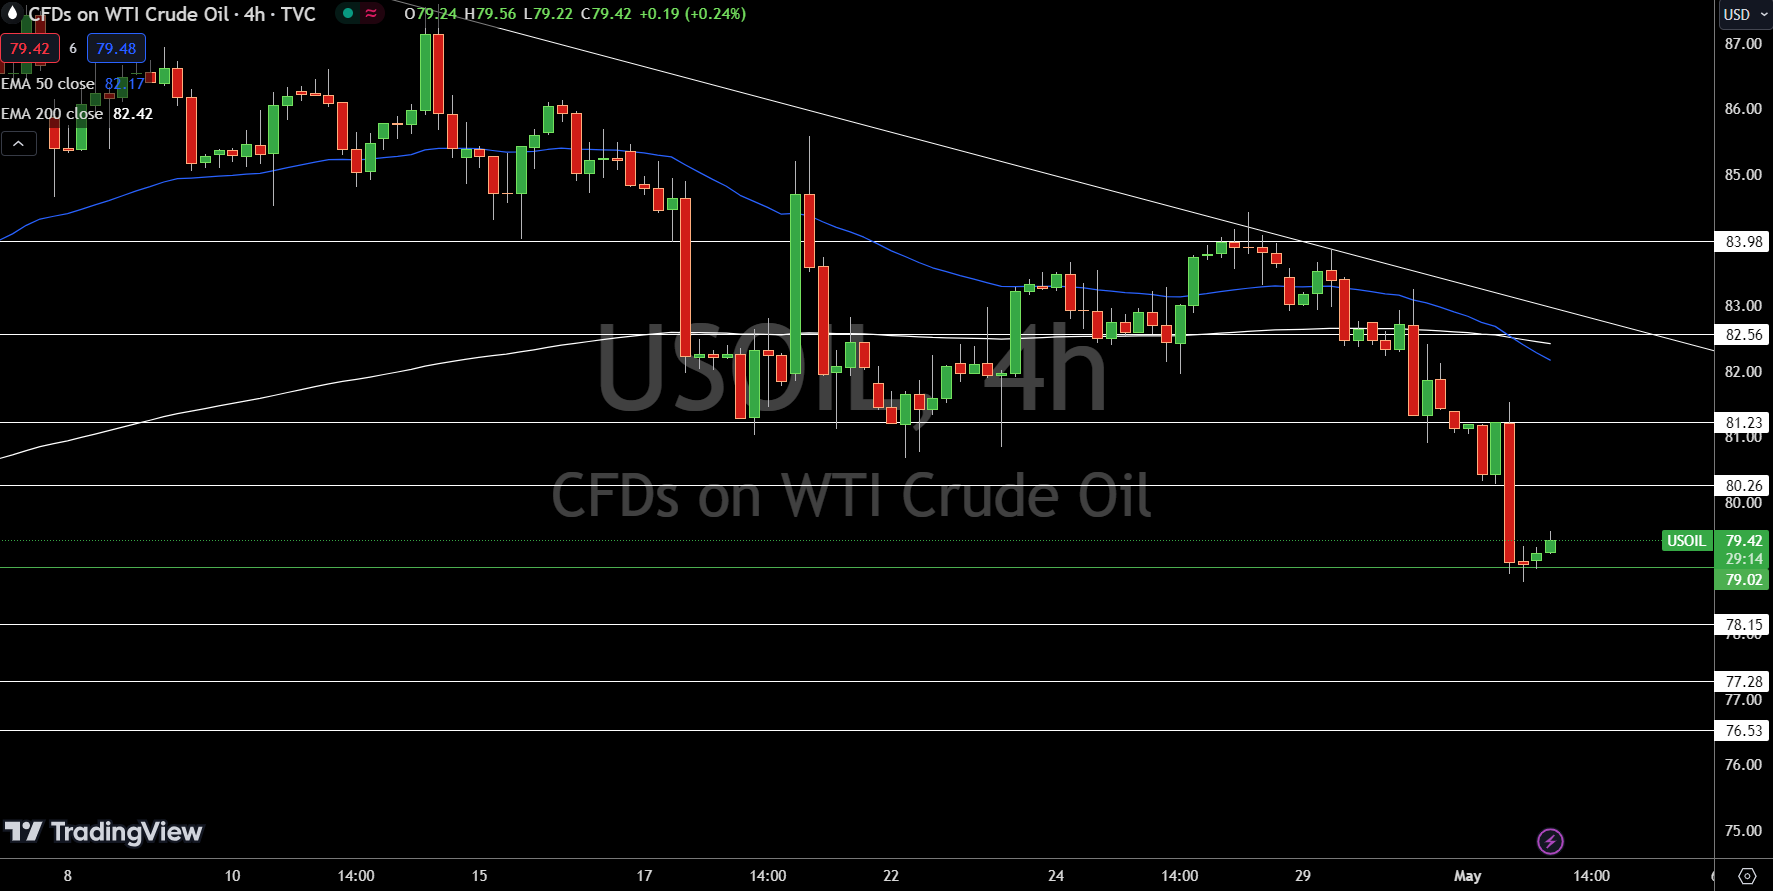
In today’s technical outlook for USOIL, the commodity is currently trading at $79.42, slightly above its pivot point of $79.02. This positioning indicates a potential upward trend if it maintains above this level. The immediate resistance levels are set at $80.26, $81.23, and $82.56. Overcoming these barriers may signal continued bullish momentum. Conversely, support levels are identified at $78.15, followed by $77.28 and $76.53. A breach of these support points could lead to a significant downward shift in price.
Technical indicators, including the 50-Day Exponential Moving Average (EMA) at $82.17 and the 200-Day EMA at $82.42, suggest that the resistance near these averages might cap upward movements. Overall, USOIL’s market stance is cautiously optimistic above the $79.02 pivot, with a clear bearish risk if it falls below this threshold.
Brent Oil Price Forecast
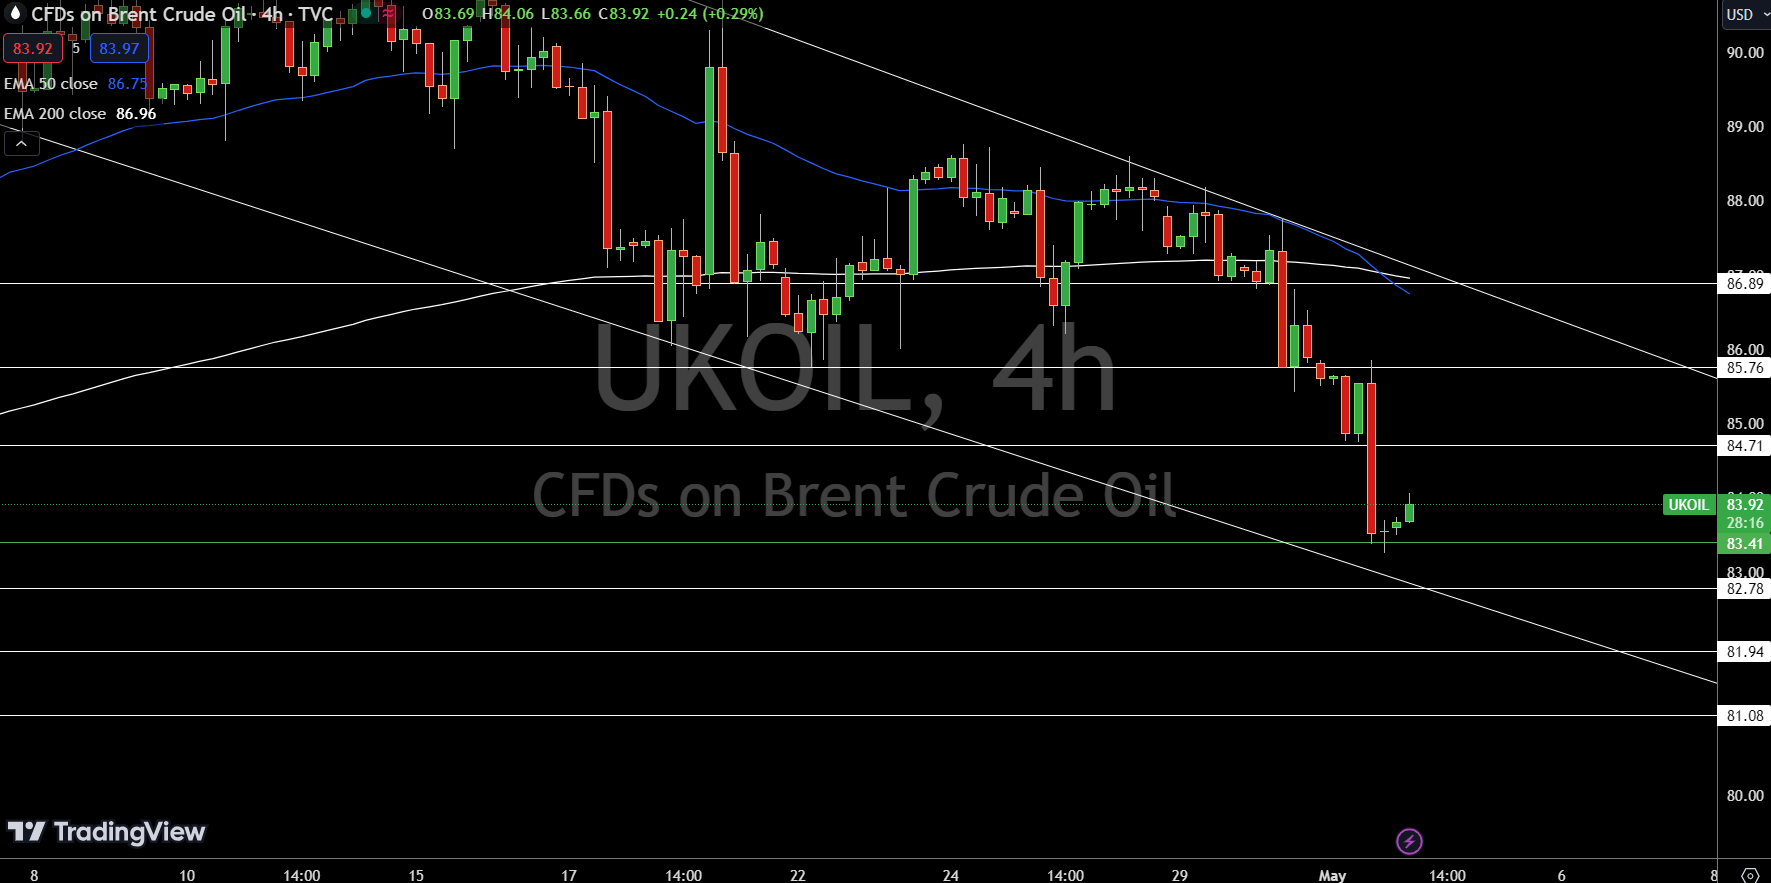
The outlook remains cautiously optimistic, maintaining a bullish stance as long as the price stays above $83.41.
For a look at all of today’s economic events, check out our economic calendar.


